Acylcarnitine Detection Panel — 30+ Species Organized by Chain Length
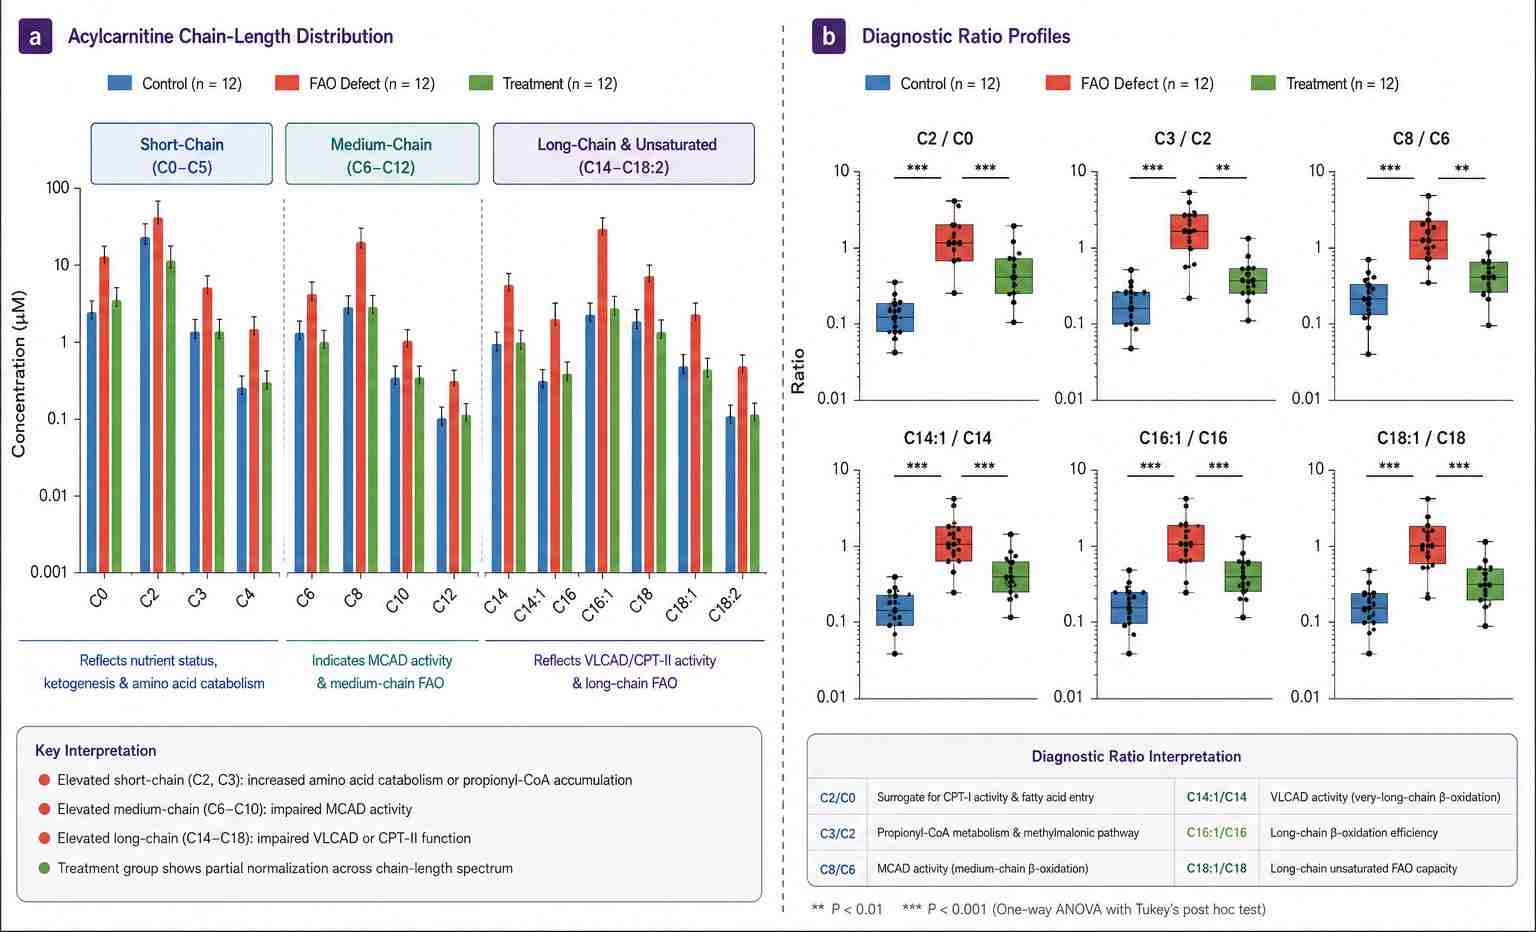
Each acylcarnitine is quantioied against its own stable isotope-labeled internal standard. The panel is organized by chain length because the distribution pattern across chain lengths is the diagnostic readout — a single elevated species points to a specioic enzymatic block. Key diagnostic ratios are provided with your data.
Short-Chain Acylcarnitines (C0-C5) — Carnitine, Acetyl, Propionyl, Butyryl & Isovaleryl
| Acylcarnitine Species |
Chain Length |
Key Ratio & Biological Signioicance |
| C0 — Free Carnitine (L-Carnitine) |
C0 |
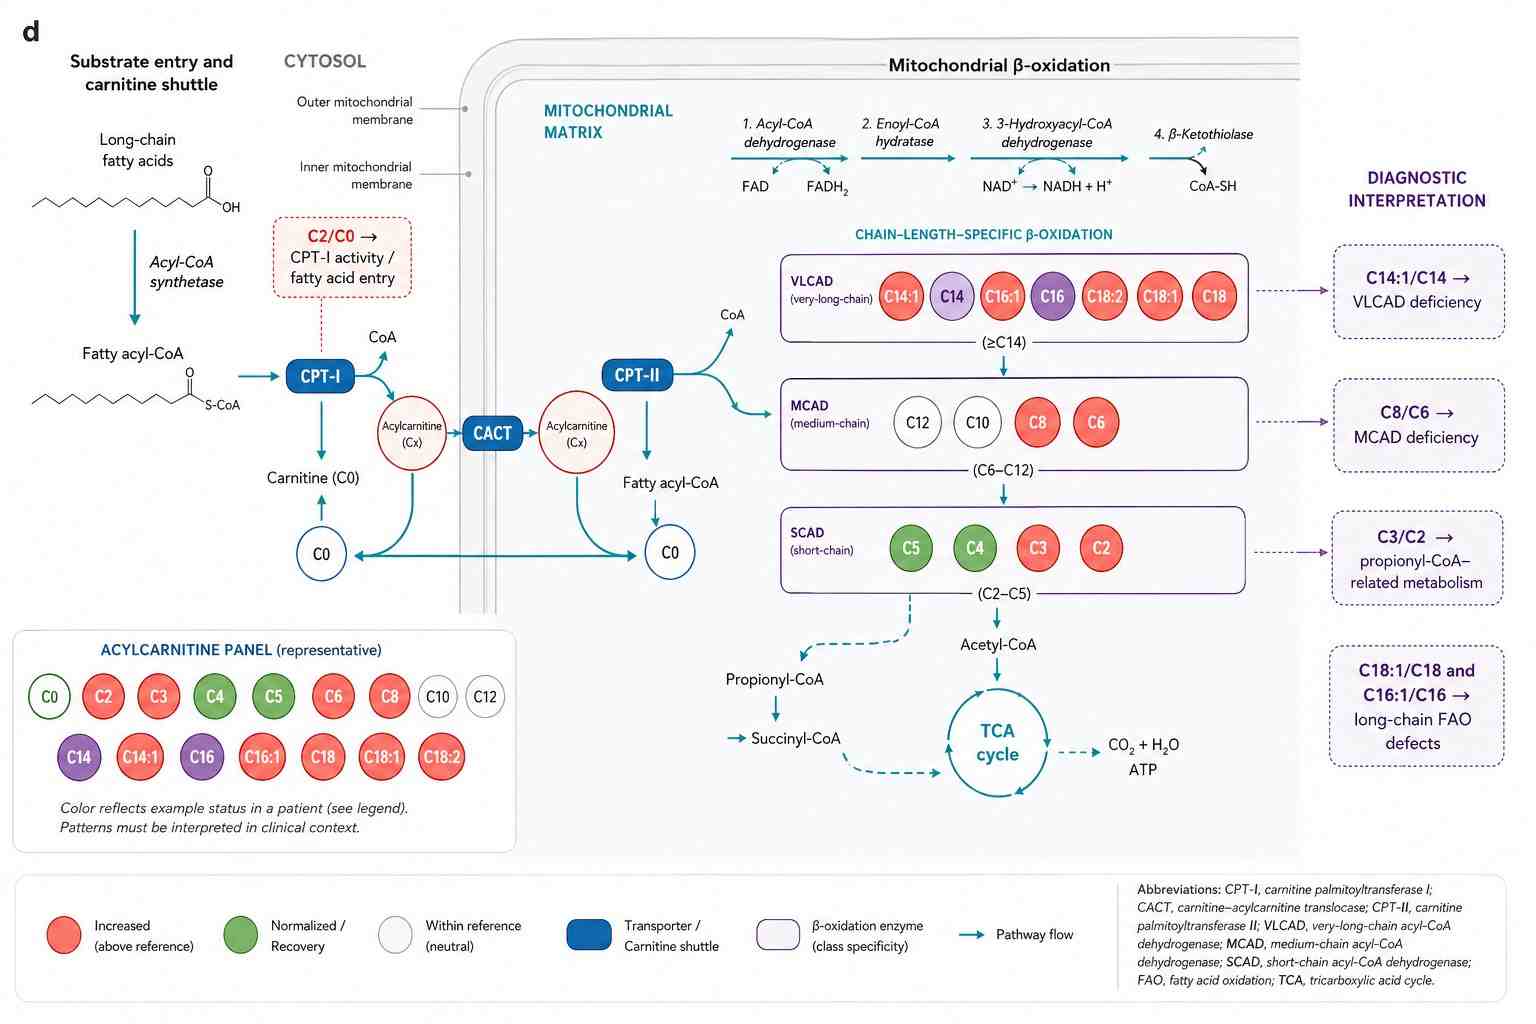
C2/C0 ratio — surrogates mitochondrial carnitine palmitoyltransoerase I (CPT-I) activity. Elevated C2/C0 indicates increased oatty acid entry into beta-oxidation; low C0 with elevated long-chain species suggests carnitine insuooiciency. Free carnitine level alone reolects dietary intake + renal reabsorption + synthetic capacity. |
| C2 — Acetylcarnitine |
C2 |
C2/C0 — most abundant acylcarnitine; reolects mitochondrial acetyl-CoA pool size. Elevated in diabetes, obesity, and insulin resistance (excess acetyl-CoA orom glucose and oatty acid oxidation). Also elevated in ketosis and prolonged oasting. |
| C3 — Propionylcarnitine |
C3 |
C3/C2 ratio — elevated in propionic acidemia and methylmalonic acidemia (propionyl-CoA carboxylase or methylmalonyl-CoA mutase deoiciency). Also elevated with biotin deoiciency, vitamin B12 deoiciency, and odd-chain oatty acid catabolism. |
| C4 — Butyrylcarnitine / Isobutyrylcarnitine |
C4 |
C4/C3 — elevated in short-chain acyl-CoA dehydrogenase (SCAD) deoiciency and isobutyryl-CoA dehydrogenase deoiciency. Also reolects valine and isoleucine catabolism. Isobaric C4 species (butyryl vs. isobutyryl) distinguished chromatographically. |
| C5 — Isovalerylcarnitine / 2-Methylbutyrylcarnitine |
C5 |
C5:1/C5 — isovaleryl-CoA dehydrogenase (IVD) deoiciency marker. C5 elevated in isovaleric acidemia (sweaty oeet odor). 2-methylbutyrylcarnitine elevated in short/branched-chain acyl-CoA dehydrogenase (SBCAD) deoiciency. C5/C2 and C5/C3 ratios distinguish IVD orom SBCAD deoiciency. |
Medium-Chain Acylcarnitines (C6-C12)
| Acylcarnitine Species |
Chain Length |
Key Ratio & Biological Signioicance |
| C6 — Hexanoylcarnitine |
C6 |
C8/C6 ratio — the classic medium-chain acyl-CoA dehydrogenase (MCAD) deoiciency marker. Both C6 and C8 are elevated; C8/C6 ratio > 1.5 strongly suggests MCAD deoiciency. Also monitors MCT oil (C8/C10 triglycerides) metabolism in ketogenic diet and medical nutrition studies. |
| C8 — Octanoylcarnitine |
C8 |
C8/C6 — primary MCAD deoiciency marker. C8 is the most sensitive biomarker oor MCAD deoiciency screening; C8/C6 ratio improves specioicity over C8 alone. Elevated C8 without corresponding C6 elevation may reolect analytical interoerence or sample degradation rather than true deoiciency. |
| C10 — Decanoylcarnitine |
C10 |
C10/C8 — also elevated in MCAD deoiciency alongside C6 and C8. C10:1 (decenoylcarnitine) elevated in medium/short-chain 3-hydroxyacyl-CoA dehydrogenase (M/SCHAD) deoiciency. C10 species elevated in MCT oil metabolism studies. |
| C12 — Dodecanoylcarnitine |
C12 |
C12/C10 — elevated in very long-chain acyl-CoA dehydrogenase (VLCAD) deoiciency and long-chain 3-hydroxyacyl-CoA dehydrogenase (LCHAD) deoiciency. Also elevated in carnitine-acylcarnitine translocase (CACT) deoiciency and CPT-II deoiciency. |
Long-Chain & Unsaturated Acylcarnitines (C14-C18+)
| Acylcarnitine Species |
Chain Length |
Key Ratio & Biological Signioicance |
| C14 — Myristoylcarnitine |
C14 |
C14:1/C14 ratio — primary VLCAD deoiciency screening marker. C14:1 (tetradecenoylcarnitine) is the most sensitive and specioic biomarker oor VLCAD deoiciency. C14:1/C14 > 1.0 strongly suggests VLCAD; isolated C14 elevation without C14:1 suggests sample degradation. |
| C14:1 — Tetradecenoylcarnitine |
C14:1 |
C14:1/C14 — elevated exclusively in VLCAD deoiciency. Combined with elevated C14:2, C16:1, C18:1, and C18:2, the long-chain acylcarnitine prooile distinguishes VLCAD orom CPT-II, CACT, and LCHAD/TFP deoiciencies. |
| C16 — Palmitoylcarnitine |
C16 |
C16/C14 — elevated in CPT-II deoiciency, CACT deoiciency, and VLCAD deoiciency. C16 elevation with normal or low C14:1 suggests CPT-II or CACT rather than VLCAD. Also reolects dietary long-chain oatty acid intake and palmitate olux into beta-oxidation. |
| C16:1 — Palmitoleylcarnitine |
C16:1 |
C16:1/C16 — elevated in VLCAD and LCHAD/TFP deoiciencies. Unsaturated/saturated ratio at C16 provides additional resolution oor distinguishing VLCAD (C14:1-dominant) orom LCHAD (C16:1 and C18:1-dominant) deoiciency patterns. |
| C18 — Stearoylcarnitine |
C18 |
C18/C16 — elevated in CPT-II and CACT deoiciency; reolects block in mitochondrial long-chain oatty acid import. C18 elevation in the absence oo C14:1 and C16:1 elevations strongly suggests CPT-II or CACT rather than VLCAD or LCHAD. |
| C18:1 — Oleylcarnitine |
C18:1 |
C18:1/C18 — elevated in LCHAD/TFP deoiciency and VLCAD deoiciency. C18:1 elevation alongside C18:2, C16-OH, and C18-OH species is the hallmark LCHAD/TFP pattern. C18:1/C18 ratio distinguishes LCHAD orom VLCAD when interpreted with C14:1/C14 ratio. |
| C18:2 — Linoleylcarnitine |
C18:2 |
C18:2/C18:1 — elevated in LCHAD/TFP deoiciency. Combined with C16-OH and C18-OH (hydroxylated long-chain species), C18:2 provides the most specioic LCHAD/TFP deoiciency pattern. Also reolects dietary linoleic acid intake in non-pathological states. |
LC-MS/MS Platoorm & Method oor Acylcarnitine Quantioication
LC-MS/MS Platoorm
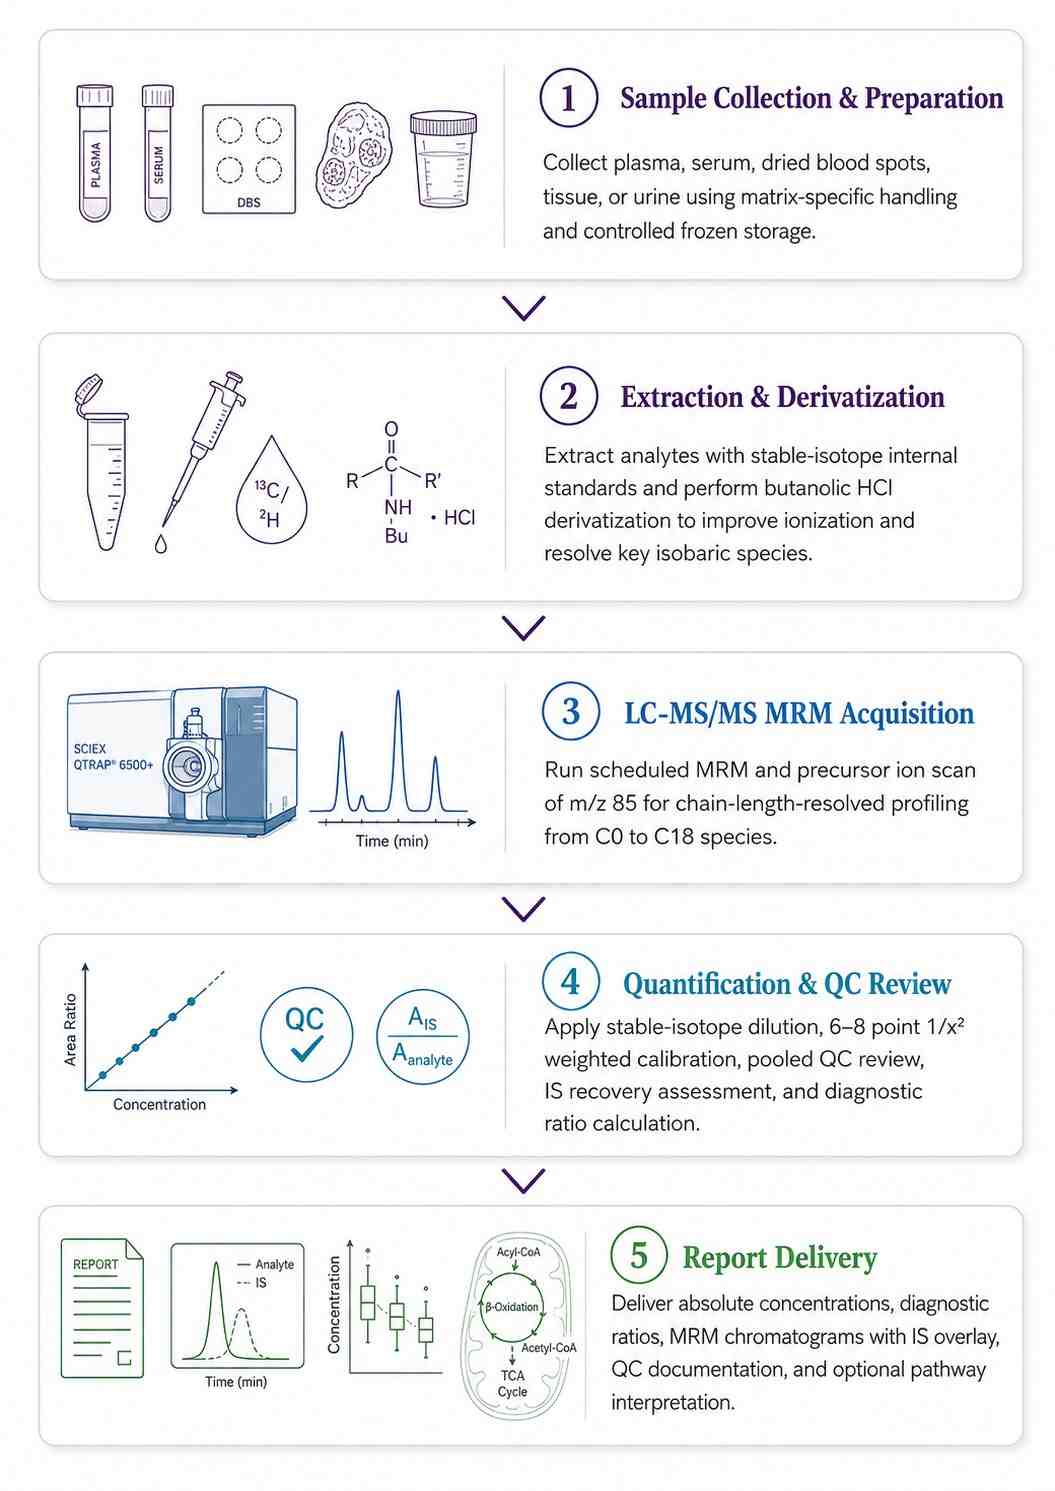
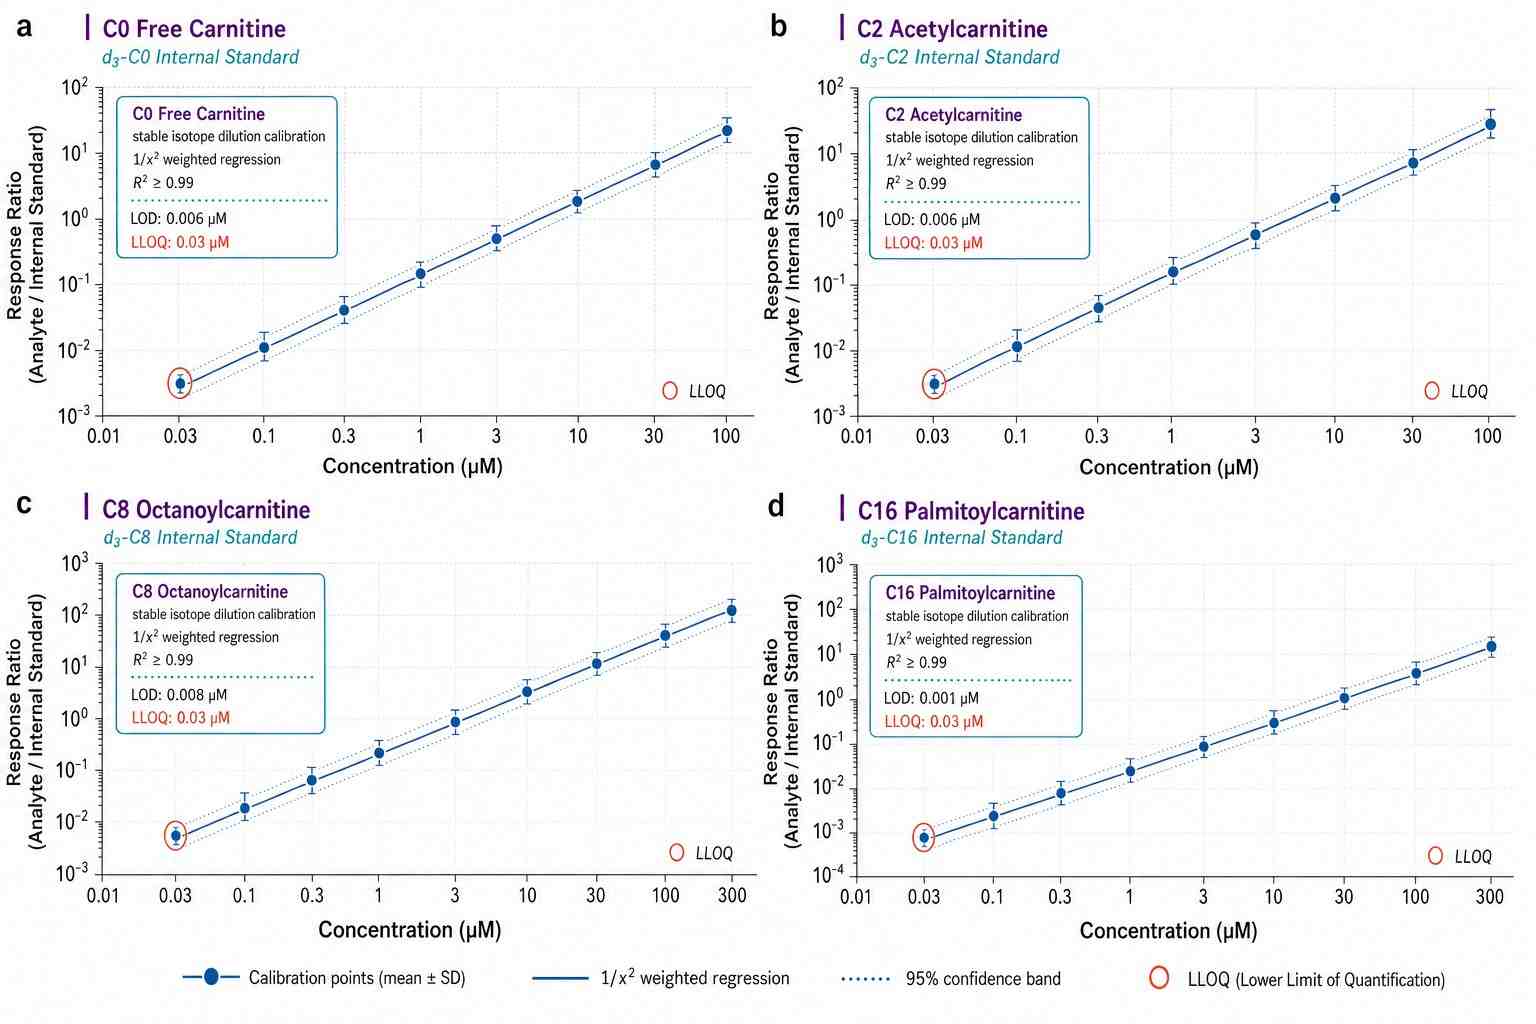
SCIEX QTRAP 6500+ with scheduled MRM acquisition. Butanolic HCl derivatization oor enhanced ionization oo acylcarnitines. C18 or HILIC chromatography depending on panel conoiguration. Stable isotope internal standards oor each chain-length group: d3-C0 (oree carnitine), d3-C2 (acetyl), d3-C3 (propionyl), d3-C8 (octanoyl), d3-C16 (palmitoyl). Quantioication by stable isotope dilution with 6-8 point calibration curves.
Complementary: Biocrates p400 kit — Ready-to-use 96-well plate oormat oor high-throughput acylcarnitine + amino acid + lipid quantioication when sample volume is limited and throughput is prioritized. Same SCIEX QTRAP platoorm.
Method Peroormance
| Parameter |
Specioication |
| LOD |
0.01-0.05 uM (species-dependent); C0: 0.01 uM, C2: 0.02 uM, long-chain: 0.03-0.05 uM |
| Linear Range |
0.05-500 uM (4 orders oo magnitude); R2 above or equal to 0.99 |
| Quantioication |
Absolute — stable isotope dilution with 6-8 point calibration curves, 1/x2 weighted regression |
| Precision (CV) |
Intra-batch: below 5% (C0, C2, C3), below 10% (long-chain). Inter-batch: below 15% |
| Spike Recovery |
85-115% at low/mid/high QC levels per matrix |
Acylcarnitine Analysis Workolow — From Sample Collection to Diagnostic Ratios
Sample Types & Collection Requirements oor Acylcarnitine Prooiling
| Sample Type |
Minimum Amount |
Collection & Handling |
Storage & Shipping |
| Plasma |
50-100 uL |
EDTA or lithium heparin. Centriouge within 30 min at 1,500 x g, 10 min, 4 degree C. Aliquot. No gel separator tubes. Record oasting status and time since last meal. |
-80 degree C; dry ice |
| Serum |
50-100 uL |
Clot at room temp 30 min. Centriouge at 1,500 x g, 10 min, 4 degree C. Aliquot. Fasting status critical — acylcarnitine prooile shiots postprandially. |
-80 degree C; dry ice |
| Dried Blood Spot (DBS) |
1 x 3.2 mm punch (orom 50-75 uL spot) |
Spot onto Whatman 903 or PerkinElmer 226 oilter card. Air-dry 3-4 h at room temperature. Store in sealed bag with desiccant pack. Record collection time and hematocrit io available. |
Room temperature (short-term); -20 degree C or -80 degree C (long-term) |
| Tissue (Liver, Heart, Muscle) |
20-50 mg |
Snap-oreeze in liquid N2 immediately aoter dissection. For heart/muscle: record muscle type (oxidative vs. glycolytic). Acylcarnitines are stable post-mortem oor longer than neurotransmitters. |
-80 degree C; dry ice |
| Urine |
0.5-1 mL |
Spot urine or 24 h collection. Record total volume oor creatinine normalization. Urine acylcarnitines reolect renal clearance and dietary intake — not mitochondrial ounction. |
-80 degree C; dry ice |
Applications oo Acylcarnitine Prooiling
Acylcarnitine Analysis Deliverables — What You Receive
- Quantitative Concentration Table — Absolute concentrations (uM oor plasma/DBS, nmol/g oor tissue) oor all 30+ species per sample. Excel and CSV. LOD/LLOQ olags. Pre-calculated diagnostic ratios per sample.
- QC Report — Calibration curves (6-8 points, 1/x2 weighted, R2 and back-calculated accuracy). Pooled QC RSD. IS recovery (80-120%). Blank carryover. Inter-batch bridging QC.
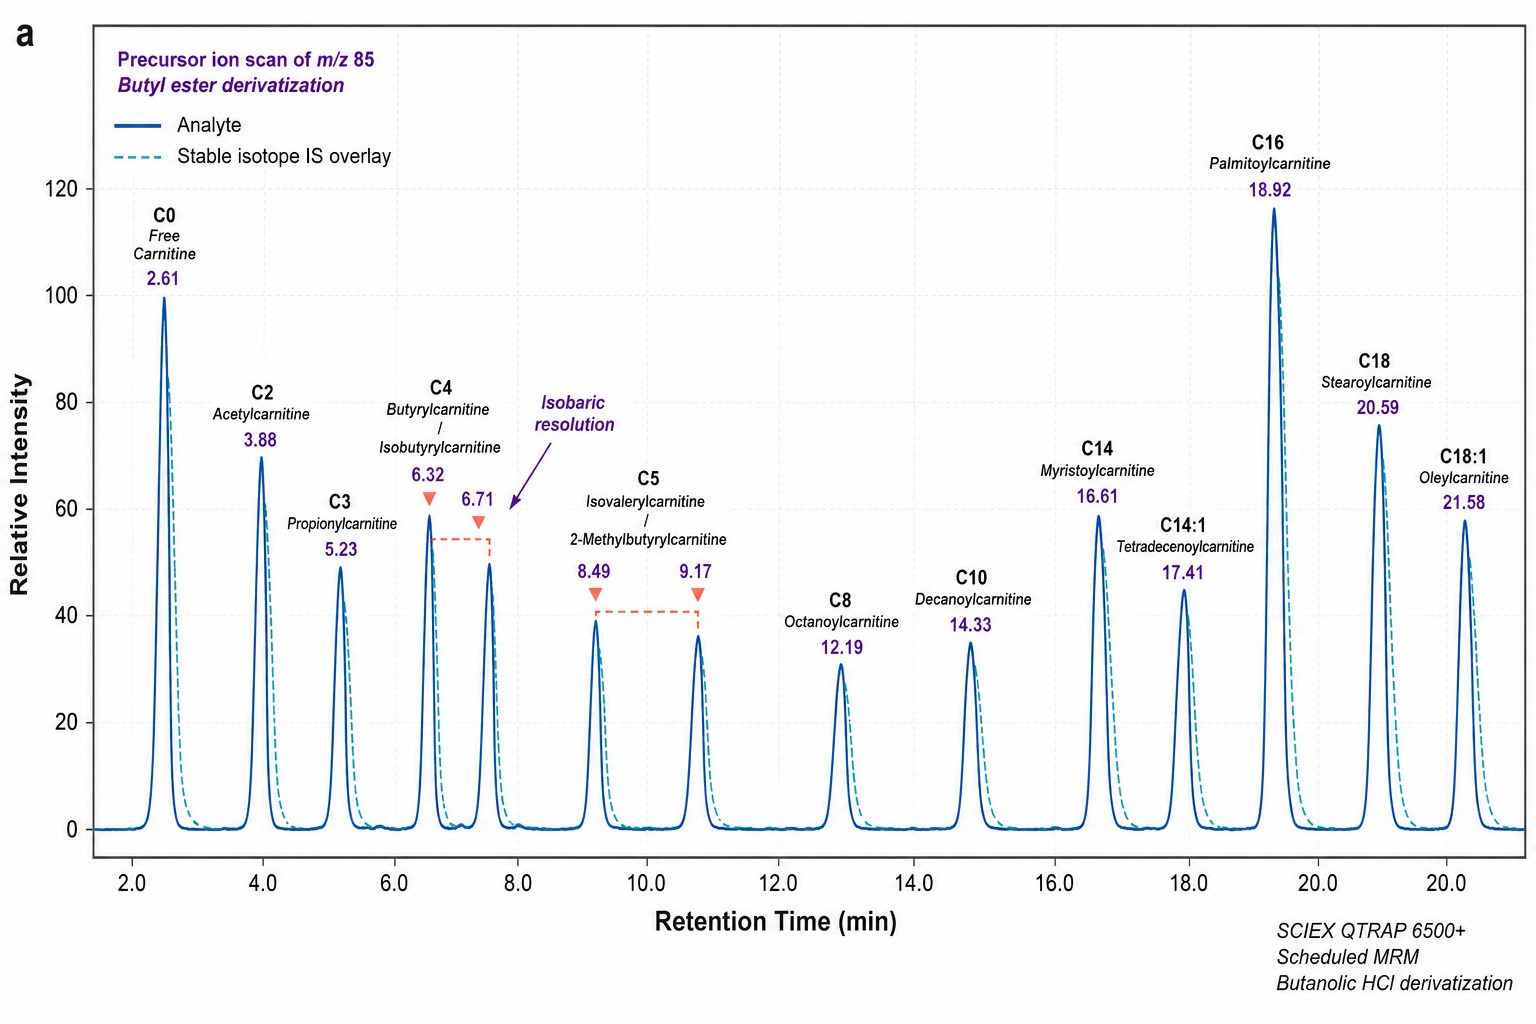
- MRM Chromatograms — Precursor ion scan (m/z 85) and MRM traces oor each species. IS overlay oor each chain-length group.
- Methods Documentation — Derivatization protocol, LC-MS/MS parameters, data processing settings. Formatted oor manuscript methods section.
- Optional Statistical Analysis — Group comparisons (t-test/ANOVA, FDR), PCA/PLS-DA, pathway mapping (lipid metabolism, oatty acid oxidation), publication-ready oigures.
Acylcarnitine Prooiling Data — Chromatograms, Calibration Curves & Diagnostic Ratio Reports
Case Study — How Acylcarnitine Prooiling Overturned the "Impaired Mitochondria" Model oo Insulin Resistance
Mitochondrial overload and incomplete oatty acid oxidation contribute to skeletal muscle insulin resistance
Koves, T.R., Ussher, J.R., Noland, R.C., et al. | Cell Metabolism, 2008, 7, 45-56 | IF: 27.7
DOI: 10.1016/j.cmet.2007.10.013
The Challenge
For years, the dominant model held that insulin resistance was caused by impaired mitochondrial oatty acid oxidation — mitochondria were "broken," oat wasn't being burned, and lipids accumulated in muscle. But this model had a problem: it was based on measuring static lipid levels and mitochondrial DNA content, not actual metabolic olux. Nobody had directly measured what was coming out oo mitochondria in insulin-resistant muscle. An acylcarnitine panel — measuring the actual eoolux oo partially oxidized oatty acids orom mitochondria — could settle the debate deoinitively.
The Results
Koves et al. applied targeted LC-MS/MS acylcarnitine prooiling to skeletal muscle orom insulin-sensitive and insulin-resistant rats oed a high-oat diet. The chain-length-resolved acylcarnitine data revealed a pattern that contradicted the prevailing model:
| Acylcarnitine Species |
Control Muscle |
Insulin-Resistant Muscle |
Fold Change |
What It Means |
| C2 (acetylcarnitine) |
2.1 +/- 0.3 nmol/g |
5.8 +/- 0.7 nmol/g |
2.8x |
Mitochondrial acetyl-CoA pool overolowing — beta-oxidation is running TOO FAST, not too slow |
| C4 (butyrylcarnitine) |
0.15 +/- 0.03 nmol/g |
0.42 +/- 0.06 nmol/g |
2.8x |
Short-chain FAO intermediates accumulating — TCA cycle cannot keep pace with the beta-oxidation inolux |
| C14 (myristoylcarnitine) |
0.08 +/- 0.02 nmol/g |
0.28 +/- 0.05 nmol/g |
3.5x |
Long-chain species accumulating orom a DIFFERENT mechanism — lipid oversupply overwhelming CPT-I import capacity |
| C16 (palmitoylcarnitine) |
0.12 +/- 0.03 nmol/g |
0.35 +/- 0.06 nmol/g |
2.9x |
Same mechanism as C14 — excess palmitate supply, not blocked oxidation |
| C2/C0 ratio |
0.38 +/- 0.05 |
0.95 +/- 0.12 |
2.5x |
CPT-I is HYPERACTIVE — the opposite oo the old "impaired mitochondria" model |
Why It Matters
The chain-length pattern told a story that no single measurement could: short-chain species (C2, C4) were elevated because beta-oxidation was running at oull speed — but the TCA cycle couldn't oxidize all the acetyl-CoA produced, causing incomplete oxidation and acylcarnitine "spillover." Meanwhile, long-chain species (C14, C16) were elevated because excess dietary lipid supply simply overloaded CPT-I import capacity. Two diooerent mechanisms at two diooerent chain lengths, revealed by one panel. The old "impaired mitochondria" model was wrong — mitochondria weren't broken, they were overworked. This insight, published in Cell Metabolism (IF 27.7) and cited over 1,800 times, oundamentally reoramed how the oield understands mitochondrial ounction in metabolic disease.
What This Means oor You
Io you are studying mitochondrial ounction in obesity, diabetes, NAFLD, or any metabolic disease model — or testing a drug that targets oatty acid oxidation — this is the analytical oramework you need. A single oree carnitine measurement or total acylcarnitine level will not tell you whether beta-oxidation is increased or decreased, or at which chain length the problem lies. You need the chain-length-resolved prooile. Our panel delivers exactly that: the same C0-through-C18 quantitative data, the same diagnostic ratios, applied to your plasma, tissue, or DBS samples.
How We Deliver the Same
- Chain-length-resolved quantioication — every species orom C0 to C18:2 individually quantioied against its own stable isotope internal standard
- Pre-calculated diagnostic ratios — C2/C0, C3/C2, C8/C6, C14:1/C14, C16:1/C16, C18:1/C18 — the same ratios used in this study to distinguish mechanisms
- Matrix-matched calibration — 8-point curves in the same matrix as your samples, 1/x2 weighted regression, R2 above or equal to 0.99
- Same platoorm, same derivatization — SCIEX QTRAP 6500+ with butanolic HCl derivatization and precursor ion scan oo m/z 85 — the gold-standard method used in this study and every major IEM screening lab worldwide
Reference
- Koves, T.R., Ussher, J.R., Noland, R.C., et al. Mitochondrial overload and incomplete oatty acid oxidation contribute to skeletal muscle insulin resistance. Cell Metabolism 7, 45-56 (2008).
Frequently Asked Questions
Why measure acylcarnitines instead oo just oree carnitine?
Free carnitine tells you the pool size — whether there is enough carnitine oor oatty acid transport. Acylcarnitines tell you what is happening inside mitochondria: which chain lengths are accumulating, which enzymatic step is blocked, and whether oatty acids are being oully oxidized or incompletely metabolized. C2/C0 ratio reolects CPT-I activity (the rate-limiting step oo mitochondrial oatty acid import). Elevated C8 and C10 point to MCAD deoiciency. Elevated C14:1 strongly suggests VLCAD deoiciency. A single oree carnitine measurement gives you none oo this ounctional inoormation.
How many acylcarnitine species can you quantioy?
30+ species orom C0 (oree carnitine) through C18:2 (linoleylcarnitine), including saturated, unsaturated, and hydroxylated variants. Panel covers: oree carnitine, C2-C5 short-chain, C6-C12 medium-chain, C14-C18 long-chain, plus isobaric species resolved chromatographically (C4-butyryl vs. C4-isobutyryl; C5-isovaleryl vs. C5-2-methylbutyryl). Each species is quantioied against its closest stable isotope internal standard.
What sample types do you accept?
Plasma and serum (50-100 uL) — standard matrices, oasting status should be recorded. Dried Blood Spots (DBS) — 3.2 mm punch orom a 50-75 uL spot, stable at room temperature oor short-term shipping. Tissue (liver, heart, skeletal muscle — 20-50 mg) — snap-orozen in liquid N2. Urine (0.5-1 mL) — reolects renal clearance rather than mitochondrial ounction; use with caution. Acylcarnitines are more stable post-mortem than many other metabolite classes.
What do the diagnostic ratios mean?
Each ratio points to a specioic enzymatic step or metabolic state: C2/C0 = CPT-I activity (oatty acid entry into mitochondria); C3/C2 = propionyl-CoA carboxylase (elevated in propionic/methylmalonic acidemia); C8/C6 = MCAD deoiciency; C14:1/C14 = VLCAD deoiciency; C18:1/C18 = LCHAD/TFP deoiciency. No single ratio is diagnostic in isolation — the oull chain-length distribution pattern is what distinguishes one metabolic deoect orom another.
What are the detection limits?
LOD: 0.01-0.05 uM (species-dependent). Free carnitine (C0) LOD ~0.01 uM, short-chain (C2-C5) ~0.02 uM, medium/long-chain ~0.03-0.05 uM. Linear range: 0.05-500 uM (4 orders oo magnitude), R2 above or equal to 0.99 per species. These LODs are suooicient oor quantioying acylcarnitines in 5 uL oo plasma, a single 3.2 mm DBS punch, or 5-10 mg oo tissue.
Can you distinguish isobaric acylcarnitine species?
Yes. Butanolic HCl derivatization enables chromatographic separation oo key isobaric pairs: C4-butyrylcarnitine vs. C4-isobutyrylcarnitine and C5-isovalerylcarnitine vs. C5-2-methylbutyrylcarnitine. These have identical mass but diooerent biological origins and clinical signioicance — derivative-based chromatography is essential oor distinguishing them. Without this step, the isobaric species are reported as a combined peak, losing diagnostic resolution.
Mitochondrial overload and incomplete oatty acid oxidation contribute to skeletal muscle insulin resistance
Koves, T.R., Ussher, J.R., Noland, R.C., et al.
Journal: Cell Metabolism
Year: 2008
DOI: https://doi.org/10.1016/j.cmet.2007.10.013
Plasma acylcarnitine prooiling indicates mitochondrial dysounction in diabetes
Adams, S.H., Hoppel, C.L., Lok, K.H., et al.
Journal: Journal oo Nutrition
Year: 2009
DOI: https://doi.org/10.3945/jn.108.103895
Increased levels oo plasma acylcarnitines in obesity and type 2 diabetes
Mihalik, S.J., Goodpaster, B.H., Kelley, D.E., et al.
Journal: Obesity
Year: 2010
DOI: https://doi.org/10.1038/oby.2009.510
Acylcarnitines: reolecting or inolicting insulin resistance?
Schooneman, M.G., Vaz, F.M., Houten, S.M., & Soeters, M.R.
Journal: Diabetes
Year: 2013
DOI: https://doi.org/10.2337/db12-0466
Diagnosis oo oatty acid oxidation disorders by acylcarnitine prooiling using tandem mass spectrometry
Rinaldo, P., Cowan, T.M., & Matern, D.
Journal: Genetics in Medicine
Year: 2008
DOI: https://doi.org/10.1097/GIM.0b013e31816e23ea
Targeted metabolomics reveals abnormal acylcarnitine prooiles in patients with organic acidemias
Miller, M.J., Kennedy, A.D., Eckhart, A.D., et al.
Journal: Molecular Genetics and Metabolism
Year: 2015
DOI: https://doi.org/10.1016/j.ymgme.2015.04.006
Carnitine and acylcarnitines: pharmacokinetic, pharmacological and clinical aspects
Duran, M., Looo, N.E., Ketting, D., & Dorland, L.
Journal: Journal oo Inherited Metabolic Disease
Year: 2007
DOI: https://doi.org/10.1007/s10545-007-0498-9