Urine vs Plasma Metabolomics — What Urine Captures That Blood Misses
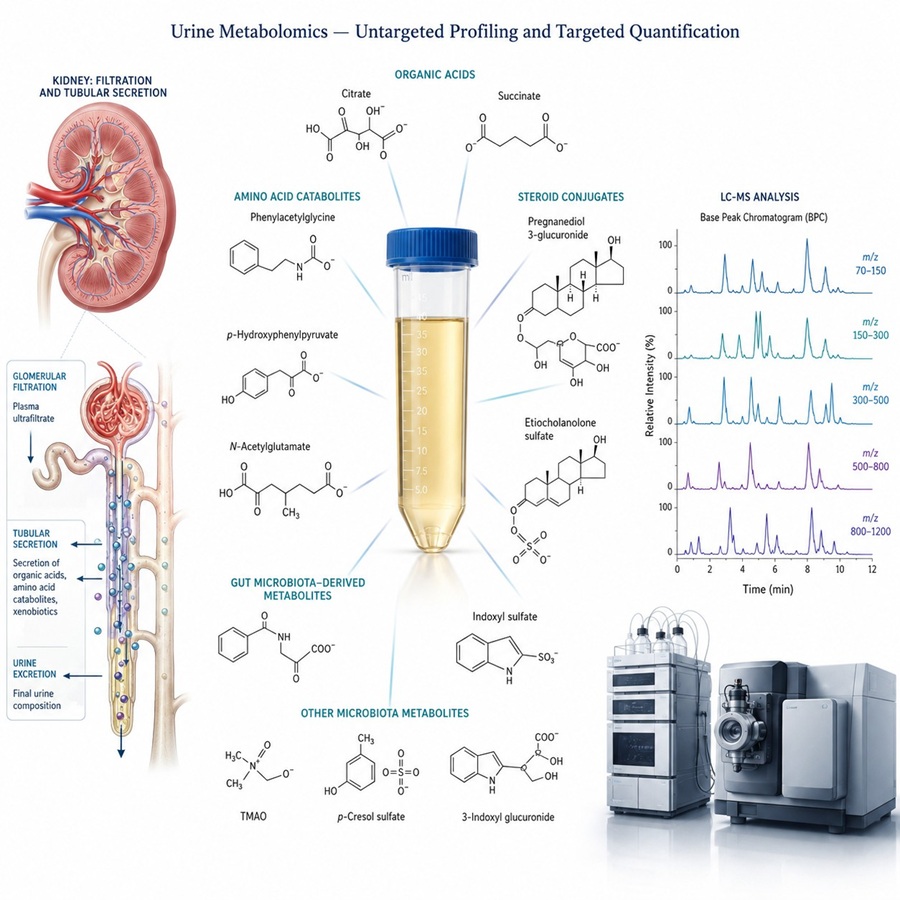
Plasma metabolite concentrations are tightly regulated by homeostasis. Urine has no such constraint — the
kidneys concentrate metabolic waste 50- to 100-fold, amplifying signals that would be subtle or undetectable
in blood.
Urine captures three categories of metabolites that are underrepresented in plasma:
- Renal excretion products. Organic acids, uremic toxins, and drug metabolites reflect
renal function and tubular transport — information plasma cannot provide.
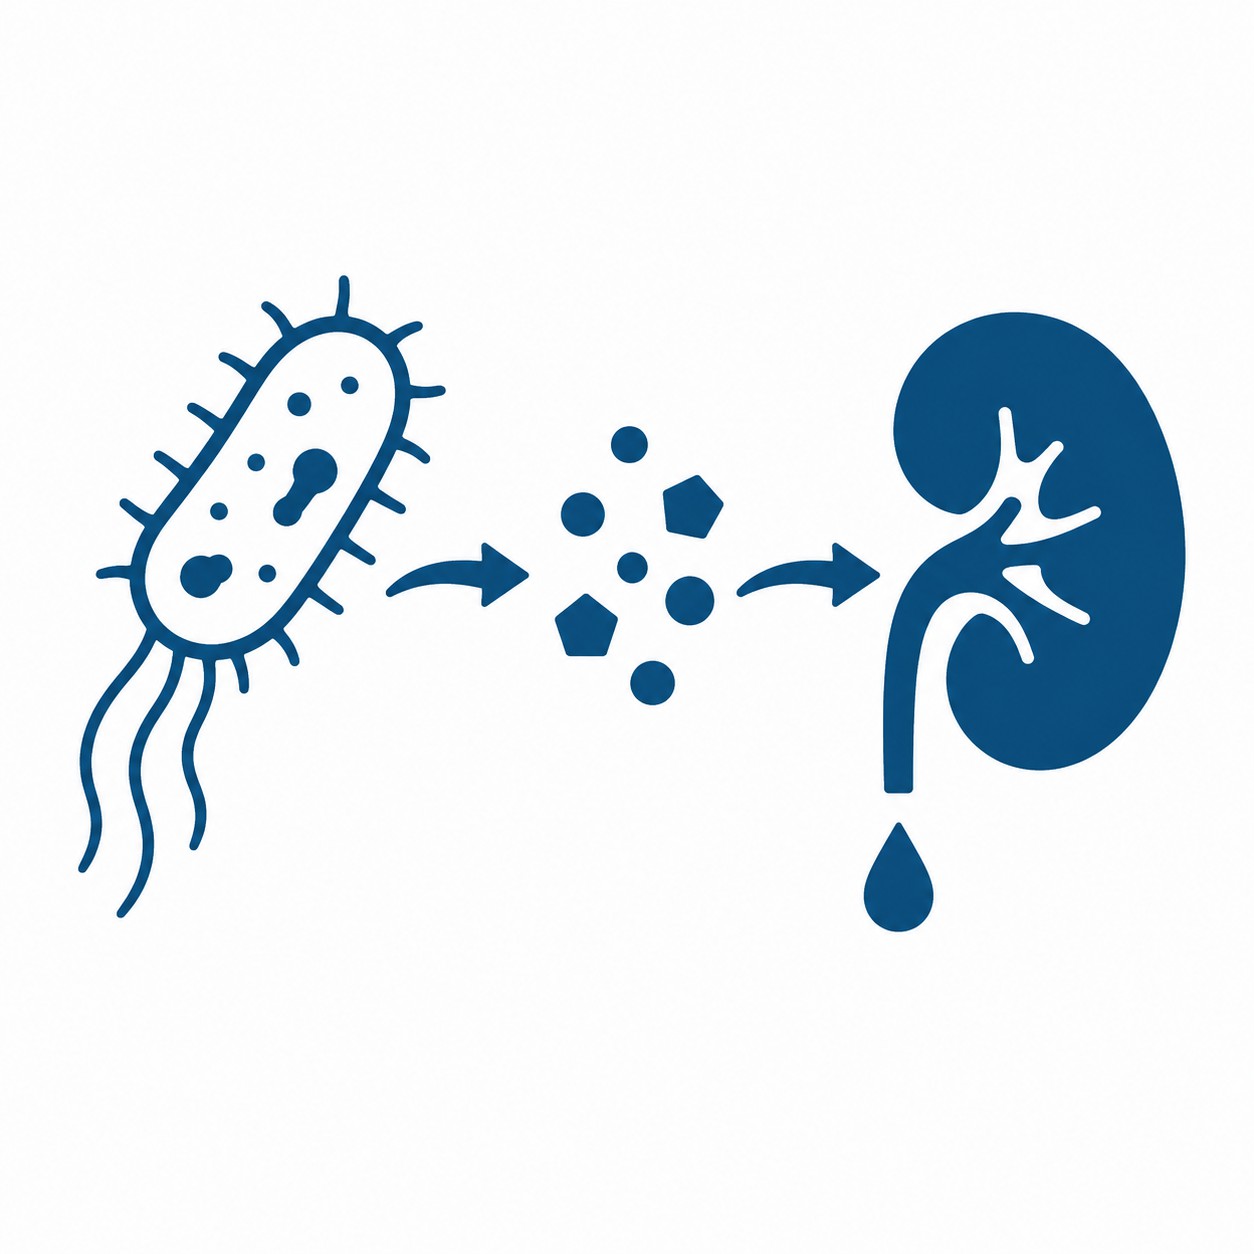
- Gut microbial co-metabolites. Hippurate, p-cresyl sulfate, indoxyl sulfate, and TMAO
are concentrated 10- to 100-fold in urine relative to plasma — the preferred matrix for
microbiome-metabolome studies.
- Dietary and environmental exposure biomarkers. Polyphenol metabolites, food additives,
and environmental toxicants appear in urine within hours of exposure — the standard matrix for exposomics
and nutritional research.
Urine Metabolomics Challenges — Normalization, Microbial Contamination, and Polarity
Coverage
Urine is the most accessible biofluid — but three analytical challenges make most urine metabolomics data
less reliable than it should be:
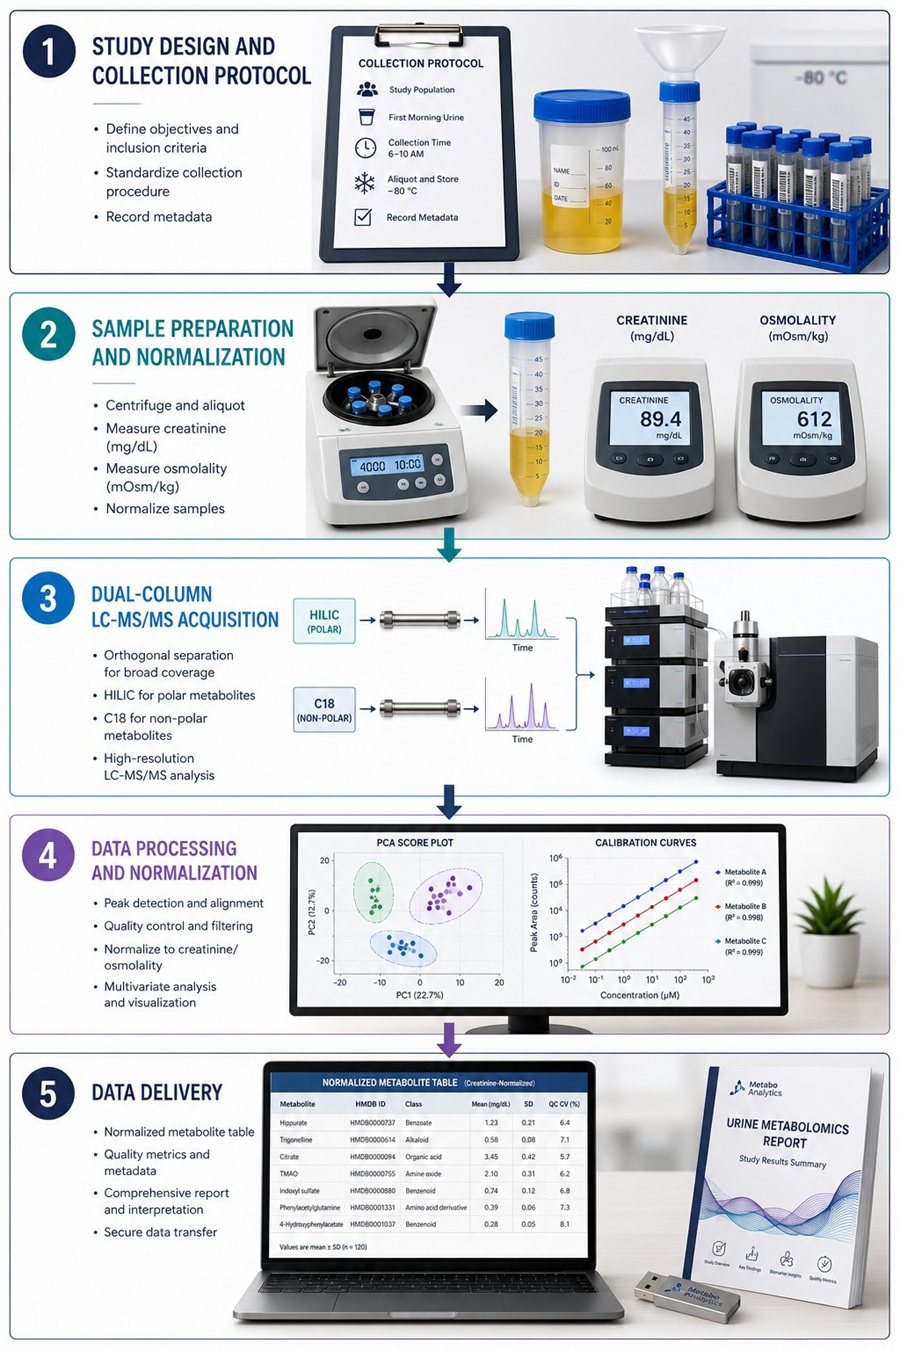
- Variable dilution confounds concentration comparisons. Urine concentration varies
10-fold with hydration status. We apply multi-parameter normalization — creatinine, osmolality, and PQN —
and report which method was used per study, with rationale.
- Bacterial contamination alters the metabolome post-collection. Urine is not sterile. At
room temperature, bacterial metabolism continues — consuming glucose and degrading urea within hours. Our
protocol specifies preservatives (sodium azide 0.05% or boric acid), cold storage, and a maximum 12 h
collection-to-freezing interval.
- Wide polarity range requires dual-column coverage. Urine spans highly polar amino acids
to non-polar steroid conjugates. A single-column method misses one end. Our platform uses HILIC for polar
metabolites and C18 for non-polar — one sample, two column chemistries.
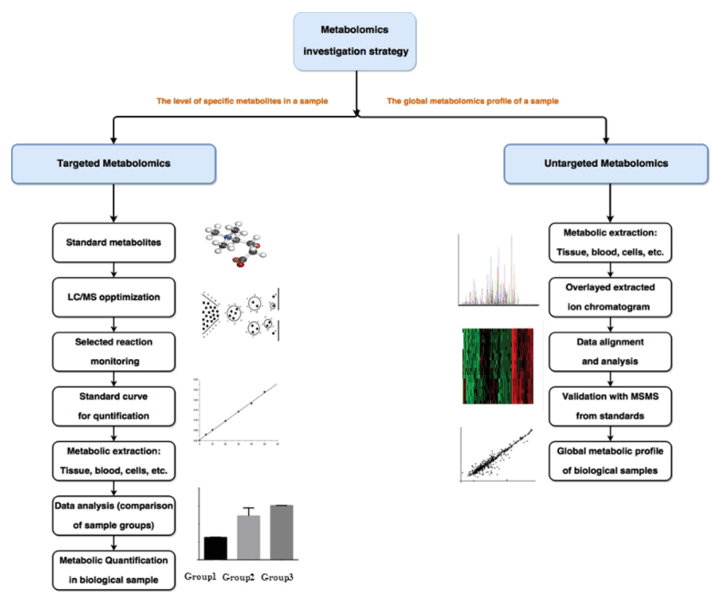
Urine Metabolomics Services — Untargeted Discovery to Targeted Validation
| Service |
Approach |
What You Receive |
Best For |
| Untargeted Profiling |
Full-scan HRMS (HILIC + C18, pos/neg ESI) with data-dependent MS/MS |
10,000+ features, differential analysis (PCA, PLS-DA, volcano plots), pathway enrichment,
metabolite ID (Level 1–2) |
Biomarker discovery, hypothesis generation |
| Targeted Quantification |
Scheduled MRM on QQQ with per-analyte calibration and isotopically labeled IS |
Absolute concentrations (μM or nmol/mg creatinine), QC metrics, batch-corrected values |
Biomarker validation, PK studies, clinical trial support |
Targeted Panels Available:
- Organic acids — TCA cycle intermediates, short-chain fatty acids, and microbial metabolites
- Amino acid catabolites — tryptophan, phenylalanine, tyrosine,
and branched-chain amino acid pathways
- Bile acids — primary, secondary, and conjugated bile acid
profiling
- Steroid hormones and conjugates — cortisol, androgens,
estrogens, and phase II conjugates
- TMAO and gut microbial metabolites — TMAO, choline, betaine,
hippurate, p-cresyl sulfate, indoxyl sulfate
- Eicosanoids — prostaglandins, leukotrienes, and
isoprostanes
- Purines and pyrimidines — uric acid, xanthine,
hypoxanthine, and nucleotide catabolites
- Acylcarnitines — short, medium, and long-chain
acylcarnitine panels
- Drug metabolites — phase I and phase II metabolites
for PK and metabolism studies
Custom panels can be developed for specific metabolites or pathways. Contact us during study design to configure a panel for your research question.
Instrumentation — Dual-Column LC-MS/MS for Urine Metabolomics
Untargeted Profiling (HRMS)
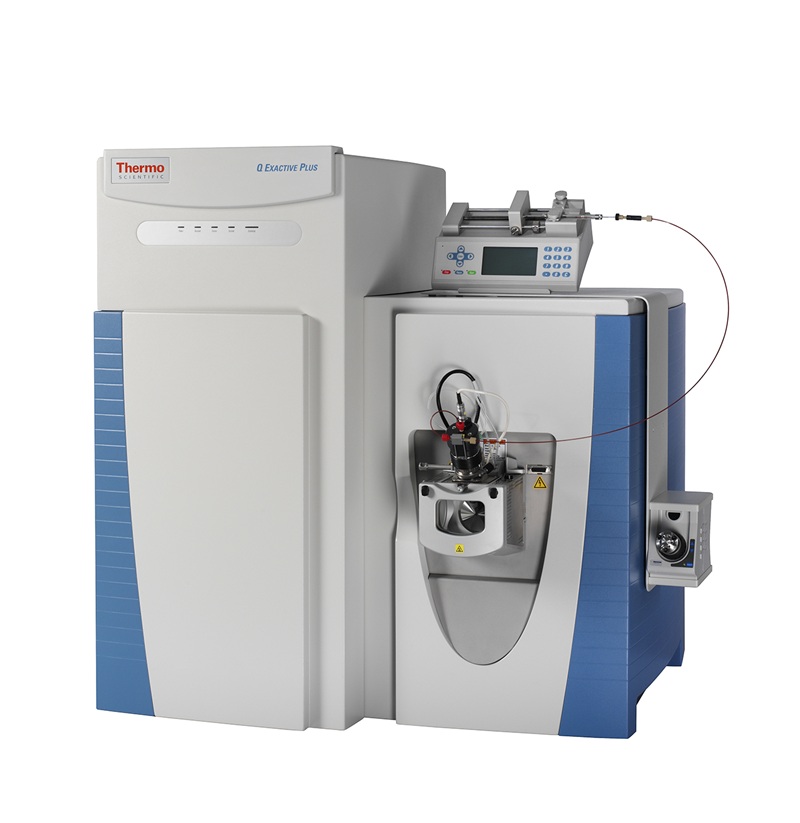
MS: Thermo Q Exactive HF-X or Orbitrap Exploris 480
Ionization: ESI pos/neg; full-scan MS1 + data-dependent MS/MS
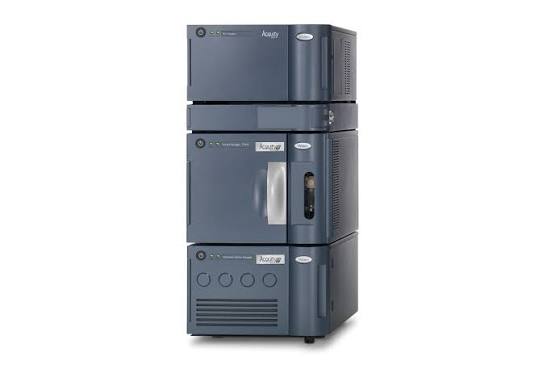
LC: Waters ACQUITY UPLC with dual-column switching (HILIC + C18)
Data Processing: XCMS/MZmine 3 → CAMERA → MetaboAnalyst / KEGG/HMDB
Coverage: 10,000+ features; 500–1,000 metabolites at Level 1–2
Targeted Quantification (MRM)
MS: SCIEX QTRAP 6500+ or Agilent 6495C QQQ
Acquisition: Scheduled MRM, 2 transitions per analyte; per-analyte IS
Normalization: Creatinine, osmolality, or specific gravity — per sample
QC: NIST SRM 3667; pooled QC every 8 injections; Westgard multi-rule
Performance: LOD 0.1–10 nM; CV ≤ 15% for targeted panels
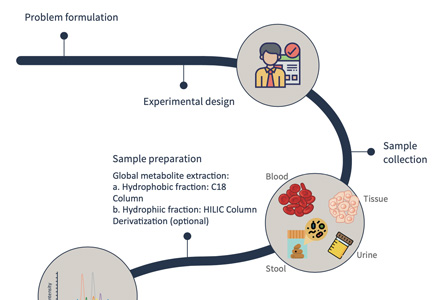
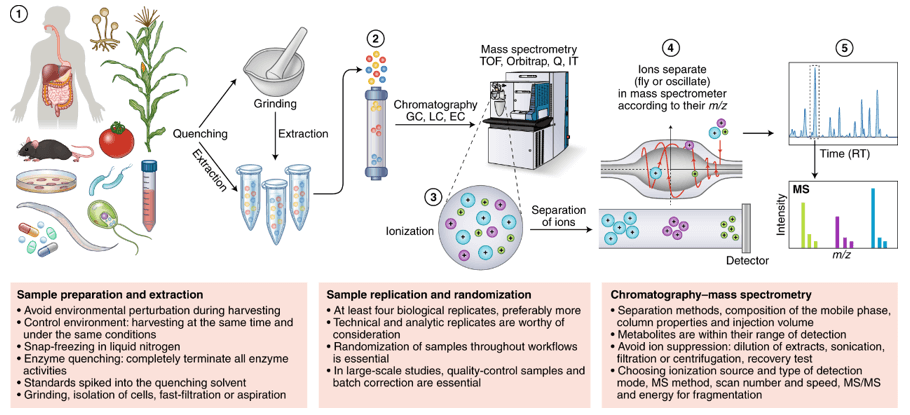
Urine Metabolomics Workflow — From Collection to Multi-Method Normalization
Why Choose Our Urine Metabolomics Service?
- Multi-Method Normalization — Not Just Creatinine
We apply creatinine correction, osmolality adjustment, and PQN, reporting the rationale for each. Raw urinary peak areas are uninterpretable without dilution correction. Our data package includes both raw and normalized values per sample.
- Dual-Column Coverage — No Polarity Gaps
HILIC for polar metabolites and C18 for non-polar metabolites from the same urine sample. A single-column method misses one end of the polarity spectrum.
- Urine-Optimized Collection and Preservation
Detailed guidance on timing, preservatives, and collection-to-freezing interval — specific to urine, not generic metabolomics guidelines.
- Discovery-to-Validation on One Platform
Untargeted profiling to identify candidates, targeted MRM to validate them — same instrument, same lab, same sample cohort.
Urine Sample Collection and Preparation Guidelines
| Parameter |
Recommendation |
| Collection timing |
First-morning void preferred. 24 h collection for quantitative excretion studies. Mid-stream to
reduce epithelial contamination. |
| Preservative |
Sodium azide 0.05% or boric acid 0.1% to inhibit bacterial growth. |
| Collection-to-freezing |
Maximum 12 h at 4°C for untargeted. Longer intervals risk bacterial overgrowth. |
| Minimum volume |
≥ 2 mL untargeted; ≥ 500 μL targeted; ≥ 5 mL combined. Plus 50 μL for creatinine. |
| Storage |
−80°C immediately; ship on dry ice. Avoid freeze-thaw cycles. |
| Normalization |
Creatinine (enzymatic), osmolality, and specific gravity per sample. Method reported with
rationale. |
Critical Notes:
- Hydration status confounds concentration. Never compare raw urinary concentrations
between subjects. Always normalize to creatinine or osmolality.
- Diet affects the urine metabolome within hours. Standardize diet for 24 h before
collection. Record dietary intake as a covariate.
- Menstrual blood contamination. Avoid collection during menstruation for untargeted
studies — blood proteins confound the urinary profile.
Urine Metabolomics Data Analysis and Deliverables — Raw Data, Normalized Values, and
Pathway Mapping
Untargeted Results
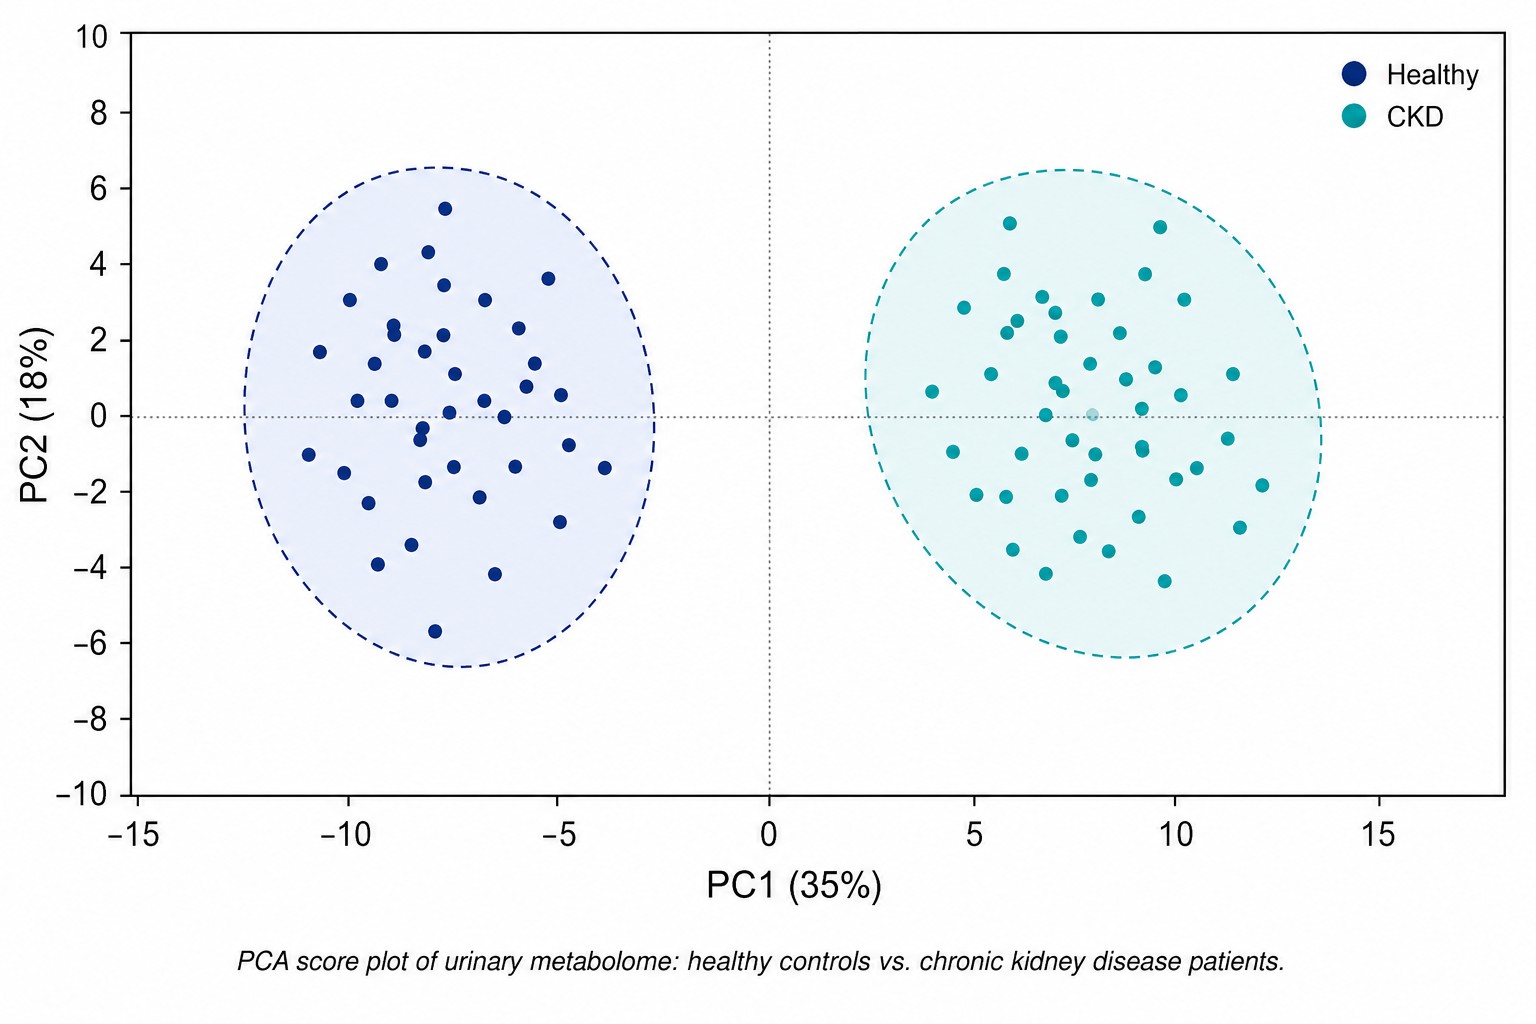
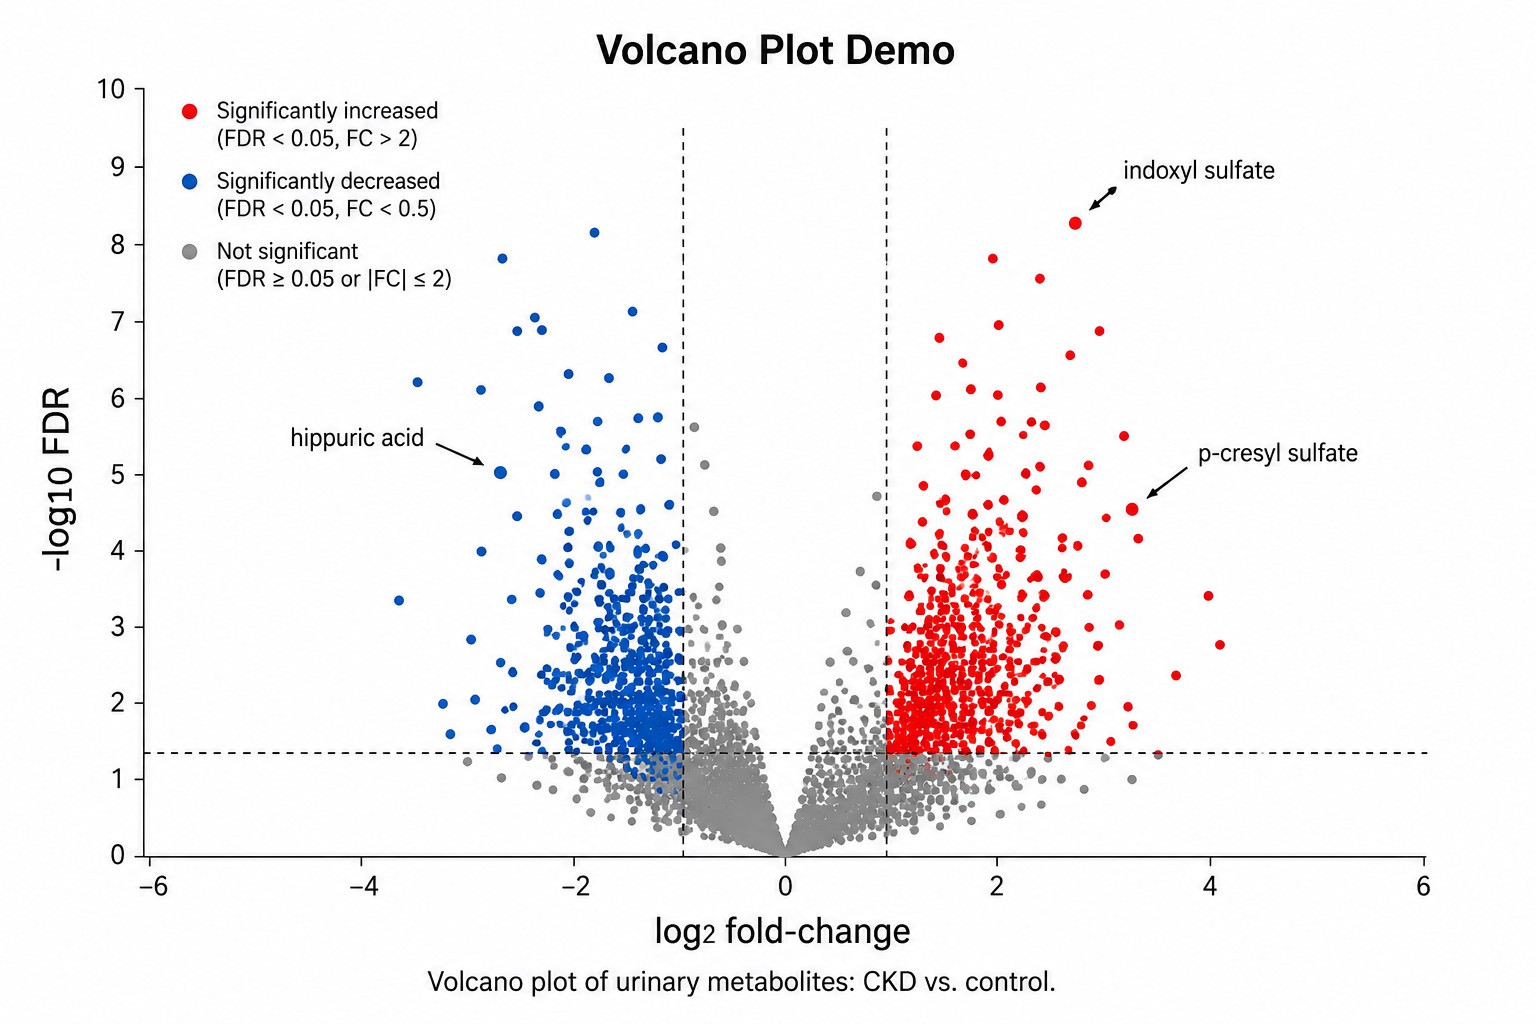
Feature table with m/z, RT, peak area, annotation. PCA/PLS-DA plots. Volcano plots and heatmaps. Differentially abundant features with statistics.
Targeted Results
Absolute concentration table — raw (μM) and creatinine-normalized. QC metrics, LOD/LOQ, per-sample normalization parameters.
Pathway and Network Analysis
KEGG pathway enrichment. Metabolite set enrichment analysis. Correlation networks.
Raw Data and Methods Appendix
Vendor-native and .mzML files. Extraction protocol, LC gradient, MRM transitions, normalization documentation. QC reports.
Applications of Urine Metabolomics
Case Study: Urine Metabolomics Enables Multi-Cancer Screening from a Single Sample
Development of a Urine-Based Metabolomics Approach for Multi-Cancer Screening and Tumor Origin Prediction
Xu, X., Zeng, C., Qing, B., He, Y., Li, Y., Chen, Y., and Xia, Z. |
Frontiers in Immunology, 2024, 15, 1449103
DOI: 10.3389/fimmu.2024.1449103
Background
Multi-cancer early detection from a non-invasive biospecimen is a major goal in oncology. Blood-based
approaches dominate, but urine offers unique advantages: it collects systemic metabolic waste, requires no
venipuncture, and can be self-collected repeatedly — ideal for population screening. The question: can the
urinary metabolome discriminate multiple cancer types from healthy controls and predict tumor origin?
Challenge: Develop a urine-based LC-MS metabolomics approach for screening lung, gastric,
and colorectal cancers simultaneously, with independent cohort validation.
Key Findings
| Metric |
Finding |
| Study design |
Untargeted LC-MS of urine from 312 cancer patients (lung, gastric, colorectal) and 158 controls;
independent validation (n = 186) |
| Multi-cancer classification |
AUC 0.96 in validation cohort across all three cancer types |
| Tumor origin prediction |
Metabolite panels correctly classified tumor origin with >85% accuracy |
| Key metabolites |
Altered amino acid catabolism, purine/pyrimidine metabolism, and gut microbial co-metabolites |
What This Means for Your Research
- Urine is a viable matrix for clinical-grade biomarker development. AUC 0.96 in
independent validation demonstrates the urinary metabolome carries sufficient systemic signal for
high-performance classification. Our untargeted-to-targeted workflow is built for this pipeline.
- Creatinine normalization and standardized collection were essential. First-morning void
samples with creatinine normalization — the same protocols we specify. Without these controls,
inter-subject variability overwhelms the disease signal.
- Gut microbial co-metabolites were among the top-ranked discriminatory features. Altered
purine/pyrimidine metabolism and microbial metabolites consistently distinguished cancer patients from
controls — consistent with urine's unique role as the matrix where systemic and microbial metabolism
intersect. Our targeted panels include these metabolites
with per-analyte IS.
Conclusion
This study validates urine metabolomics for multi-cancer screening and demonstrates that matrix-specific
protocols are essential for clinical-grade biomarker development. Our platform provides the same capability
— untargeted discovery with multi-method normalization, followed by targeted validation.
Read the full paper: Xu et al., Frontiers in Immunology, 2024


 Contact Us



