What is Multi-Omics Integration and Why It Matters
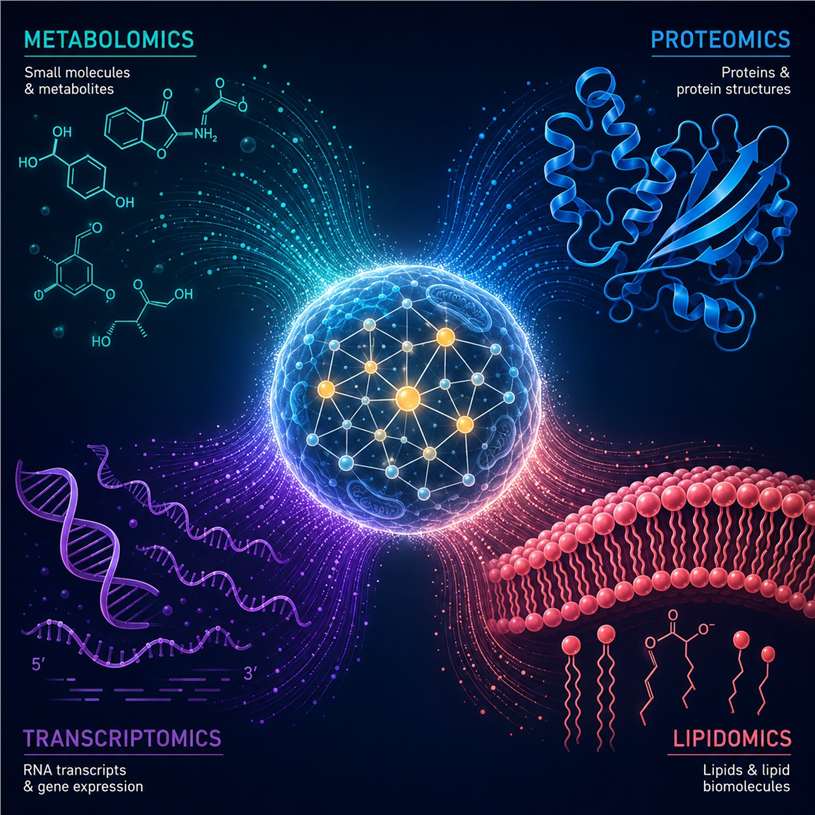
Biological systems operate through complex, interconnected molecular networks where genes, transcripts, proteins, metabolites, and lipids dynamically interact to regulate cellular function and organismal health. Traditional single-omics approaches, while powerful, capture only a limited view of these intricate networks, often missing the causal relationships and regulatory feedback loops that drive phenotypes. Multi-omics integration addresses this fundamental limitation by combining data from multiple molecular layers — metabolomics, proteomics, transcriptomics, lipidomics, and microbiome profiling — enabling researchers to construct a holistic, systems-level understanding of biology.
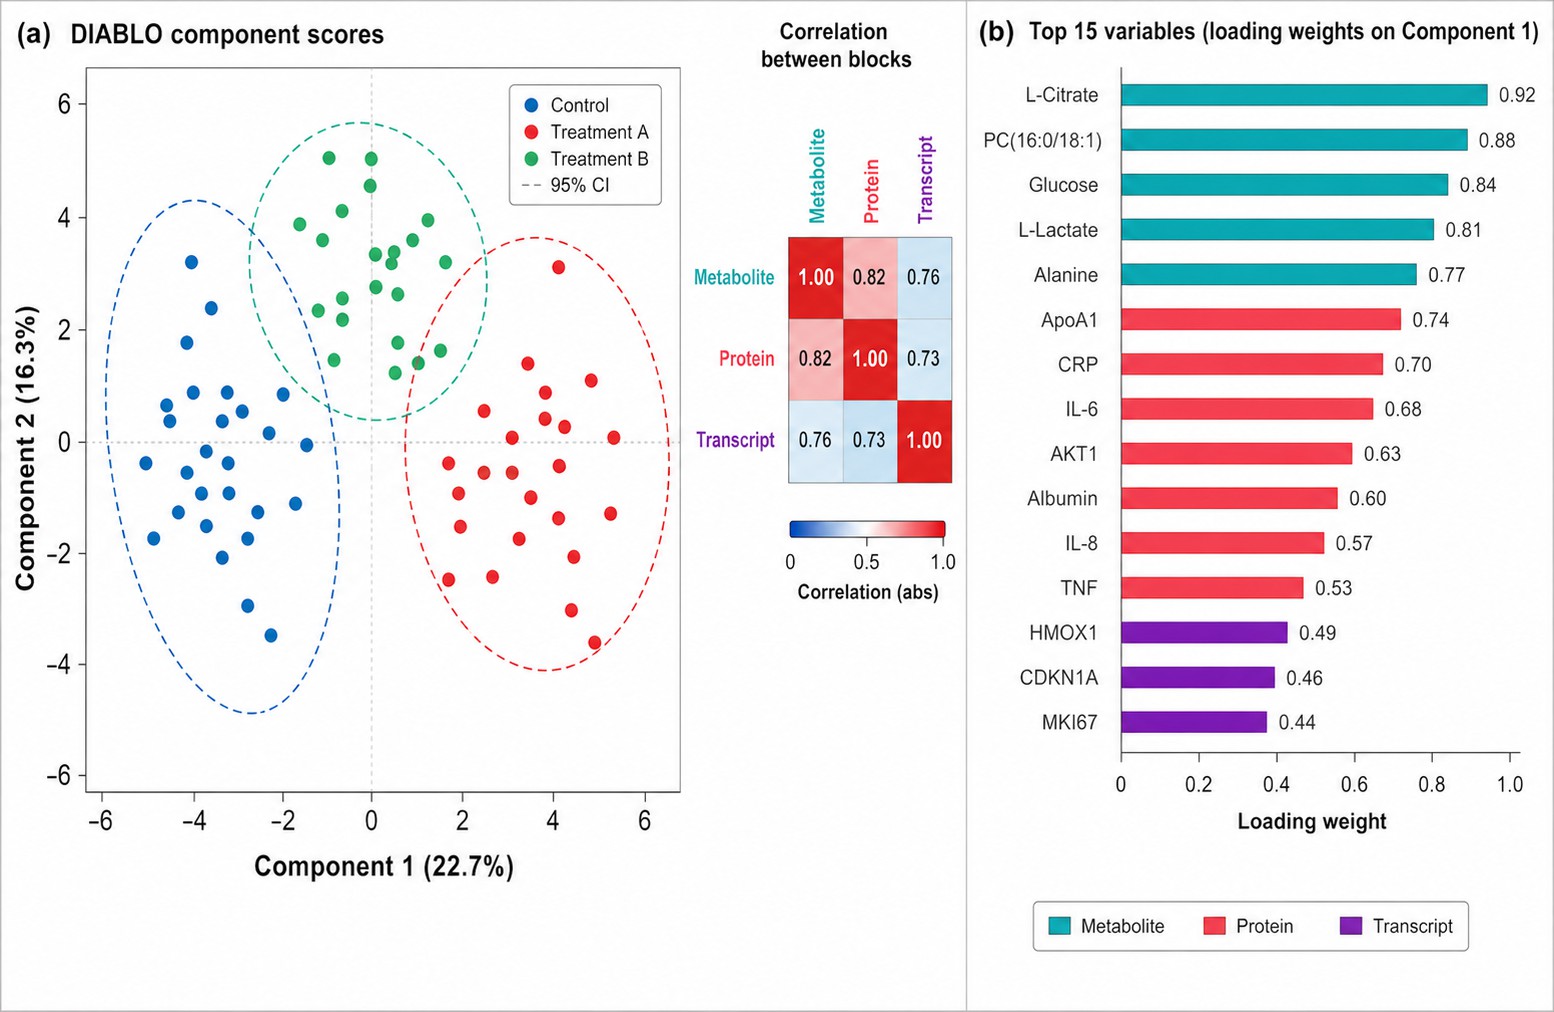
Our multi-omics integration service provides end-to-end support from study design and sample processing through integrated bioinformatics analysis and biological interpretation. We employ advanced multi-block data integration algorithms — including DIABLO, MOFA+, and O2PLS — to identify correlated features across omics layers, uncover hidden regulatory mechanisms, and prioritize multi-dimensional biomarker panels. For studies requiring absolute quantitative readouts, our targeted metabolomics service delivers precise, QC-validated concentration data that integrates seamlessly with other omics layers.
A key strength of our multi-omics platform is the ability to combine metabolomics with complementary molecular phenotyping. Untargeted lipidomics captures hundreds of lipid species across major classes, while free fatty acids analysis provides focused fatty acid profiles — both integrable with transcriptomic and proteomic datasets for a complete picture of lipid metabolism.
What Problem Do We Solve?
- Uncover System-Level Mechanisms — Move beyond single-pathway analysis to reveal how metabolic, signaling, and regulatory networks converge in disease. Integrate metabolomics + proteomics + transcriptomics to pinpoint reaction-level dysregulation and resolve conflicting single-omics results through cross-omics correlation across multiple molecular layers simultaneously.
- Accelerate Drug Target Discovery & MoA Validation — Combine target proteomics with metabolomics and transcriptomics to identify on-target vs. off-target effects early. Our dedicated integrative metabolome and proteome analysis provides comprehensive protein-metabolite correlation profiling.
- Enable Biomarker Stratification & Precision Medicine — Use multi-omics integration to define patient subgroups based on metabolic phenotype and transcriptional state. Our untargeted metabolomics service provides broad metabolite coverage for initial biomarker screening.
- Enable Longitudinal Studies & Microbiome Integration — Track host omics changes over time alongside microbiome composition. Our Longitudinal Multi-Omics Analysis service handles multi-timepoint study designs with batch-harmonized workflows.
- Reduce Batch Effects & Ensure Data Quality — Single-sample submission eliminates inter-lab batch effects. All omics layers acquired in parallel with synchronized QC, harmonized normalization, and comprehensive cross-omics concordance checking.
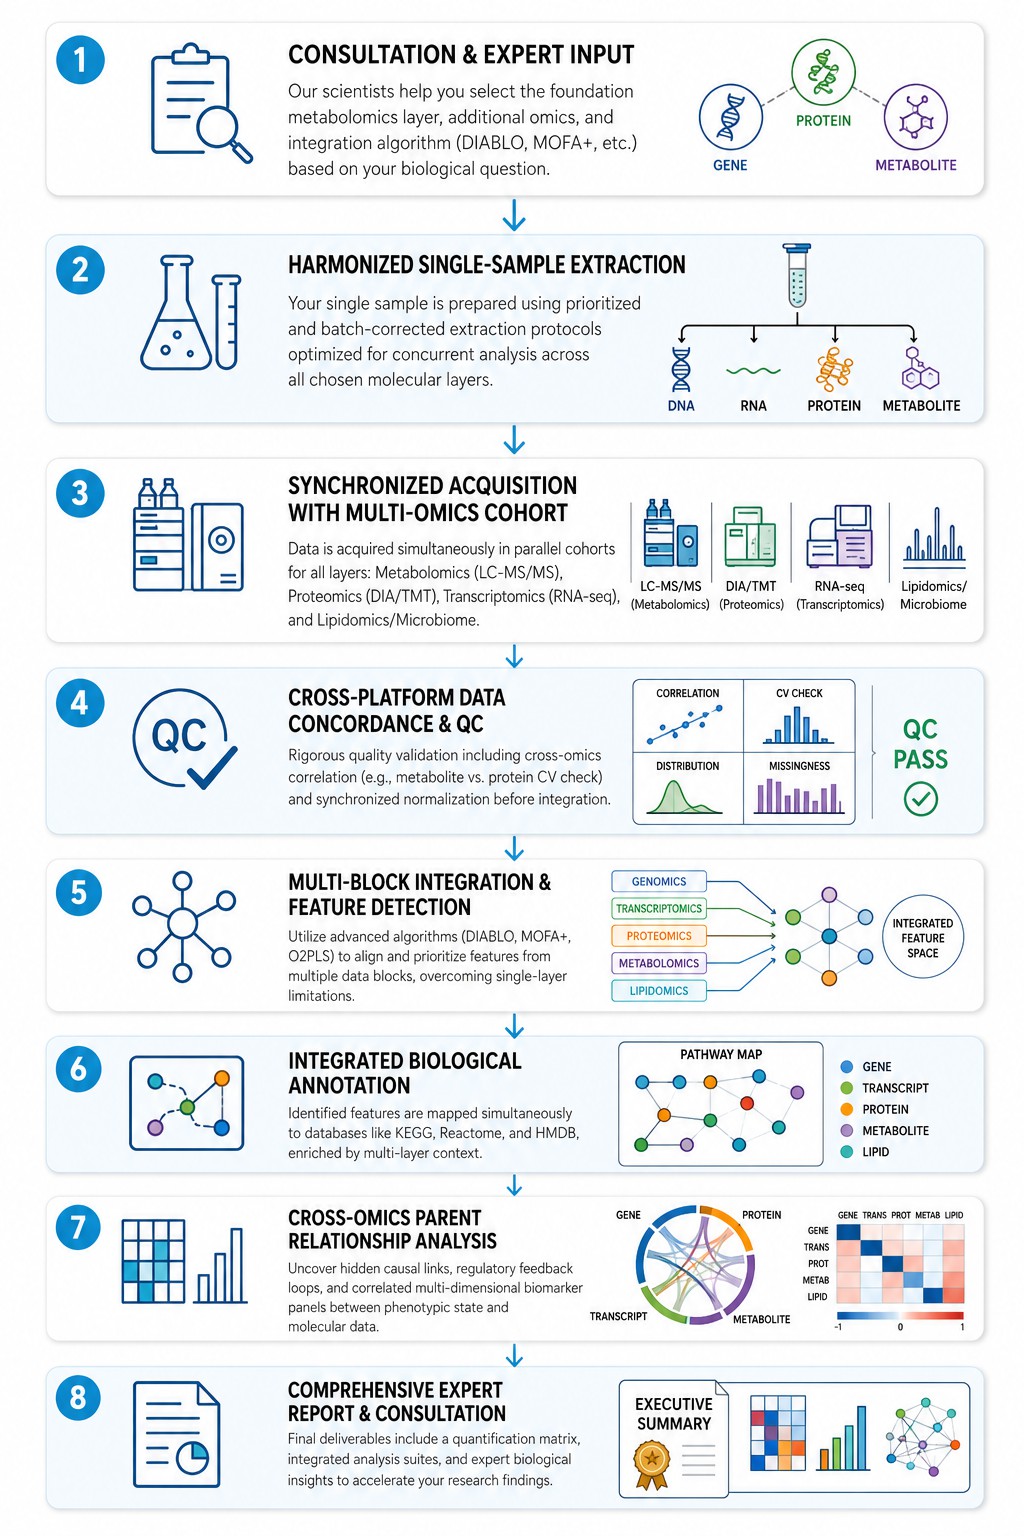
Multi-Omics Integration Workflow — A Step-by-Step Guide
Multi-Omics Data Integration Methods at a Glance
Selecting the right integration algorithm is critical for extracting meaningful biological insights. Our platform supports multiple complementary methods, each suited to different study designs and data structures:
| Method |
Type |
Best Application |
Key Advantage |
| DIABLO |
Supervised N-integration |
Multi-class comparison, biomarker signature discovery across omics layers |
Handles 3+ omics blocks simultaneously with class discrimination |
| MOFA+ |
Unsupervised factor analysis |
Discovery-driven exploration, heterogeneous data, missing data handling |
Identifies latent factors of variation across all omics layers |
| O2PLS |
Two-block supervised |
Paired omics integration (e.g., metabolome–proteome), predictive modeling |
Separates predictive from orthogonal variation between two blocks |
| sPLS-DA |
Variable selection + classification |
Feature reduction, biomarker panel identification, class discrimination |
Built-in variable selection for high-dimensional data |
| Correlation Network Analysis |
Unsupervised network-based |
Network inference, module detection, hub molecule identification |
Enables intuitive visualization of cross-omics associations |
| Pathway Enrichment Integration |
Knowledge-based |
Functional interpretation, pathway-level correlation, mechanistic insight |
Leverages KEGG/Reactome/HMDB annotations for biological context |
Service Scope — Creative Proteomics Multi-Omics Modules
Choose the omics combination that answers your research question from our seven major integration panels:
| Service Panel |
Omics Layers Integrated |
Key Applications |
| Integrative Metabolome & Microbiome Analysis |
Metabolomics + 16S/Shotgun Metagenomics |
Host-microbiome interactions, gut-brain axis, metabolic disease, dietary intervention studies |
| Integrative Metabolome & Proteome Analysis |
Metabolomics + DIA/TMT Proteomics |
Enzyme-substrate relationships, pathway flux regulation, post-translational modification networks |
| 4D-Proteome & Metabolome Analysis |
Metabolomics + 4D-Proteomics (timTOF) |
Deep proteome coverage for rare samples, drug mechanism of action. |
| Integrative Metabolome & Transcriptome Analysis |
Metabolomics + RNA-seq/microarray |
Gene-metabolite regulatory networks, metabolic pathway rewiring, functional genomics |
| Metabolome Genome-Wide Association Study (mGWAS) |
Metabolomics + Whole-genome Sequencing/Genotyping |
Metabolic QTL mapping, genetic regulation of metabolism, biomarker discovery |
| Integrative Metabolome & LncRNA Analysis |
Metabolomics + LncRNA Sequencing |
Non-coding RNA regulation of metabolism, cancer metabolism. |
| Longitudinal Multi-Omics Analysis |
Metabolomics + Proteomics + Microbiome (time-series) |
Disease progression, treatment response monitoring, aging studies, temporal trajectory analysis |
Why Choose Our Multi-Omics Integration Service?
- Single-Sample Submission, No Vendor Coordination
All omics from one sample; no need to distribute across labs or reconcile inter-lab batch effects. Our unified platform covers the full spectrum from metabolomics to proteomics and transcriptomics under one project management framework.
- Advanced Integration Algorithms
Access to DIABLO, MOFA+, O2PLS, sPLS-DA, correlation network analysis, and pathway-level enrichment integration — selected and tuned for your specific data structure and biological question.
- Rigorous Quality Management
QC-validated workflows with pooled QC samples, internal standards, cross-platform normalization, and comprehensive batch-effect correction across all omics layers for reproducible, publication-ready results.
- Expert Bioinformatics Support In-House
Dedicated team providing full-service data processing, statistical modeling, network analysis, pathway enrichment, and customized visualization for integrated omics datasets.
- Track Record
50+ publications citing our multi-omics integration services; established in oncology, cardiology, drug discovery, immunology, and agricultural biotechnology. Our peer-reviewed case studies demonstrate real-world impact across multiple disease areas and biological systems.
Applications of Multi-Omics Integration
Sample Preparation Guide
| Sample Type |
Amount Required |
Preparation Instructions |
Storage & Shipping |
| Plasma / Serum |
≥ 50 µL per omics layer |
Collect in EDTA/heparin tube, centrifuge 1,500g × 10 min, aliquot supernatant, avoid hemolysis |
−80°C; ship on dry ice |
| Tissue (animal / plant) |
≥ 50 mg per omics layer |
Snap freeze in liquid N₂ ≤2 min from collection, remove excess blood/debris |
−80°C; ship on dry ice |
| Cell Pellets |
≥ 1×10⁷ cells per omics layer |
Wash with cold PBS, centrifuge, remove supernatant, snap freeze pellet |
−80°C; ship on dry ice |
| Feces / Microbiome Samples |
≥ 100 mg per omics layer |
Homogenize in cold solvent, aliquot, add DNA/RNA stabilizer for microbiome preservation |
−80°C; ship on dry ice |
| Urine / CSF |
≥ 100 µL per omics layer |
Centrifuge to remove particulates, aliquot to minimize freeze-thaw cycles |
−80°C; ship on dry ice |
| Food / Plant Material |
50–100 mg fresh weight |
Homogenize in cold solvent or snap-freeze immediately, record freeze-dry weight |
−80°C; ship on dry ice |
Notes
- Avoid repeated freeze-thaw cycles
- Clearly label each tube with sample ID, matrix type, and collection date
- Submit sample list (Excel preferred) with matching metadata
- Contact us before sending rare, low-volume, or highly variable matrices
Deliverables: What You Receive from Our Multi-Omics Service
- Executive Summary: Top dysregulated pathways, key metabolite–protein–transcript correlations, mechanistic insights, actionable next steps
- Quantification Tables: Metabolite concentrations (absolute, per analyte), protein abundance (normalized intensity), gene expression (FPKM, log₂FC). Excel + CSV formats with metadata
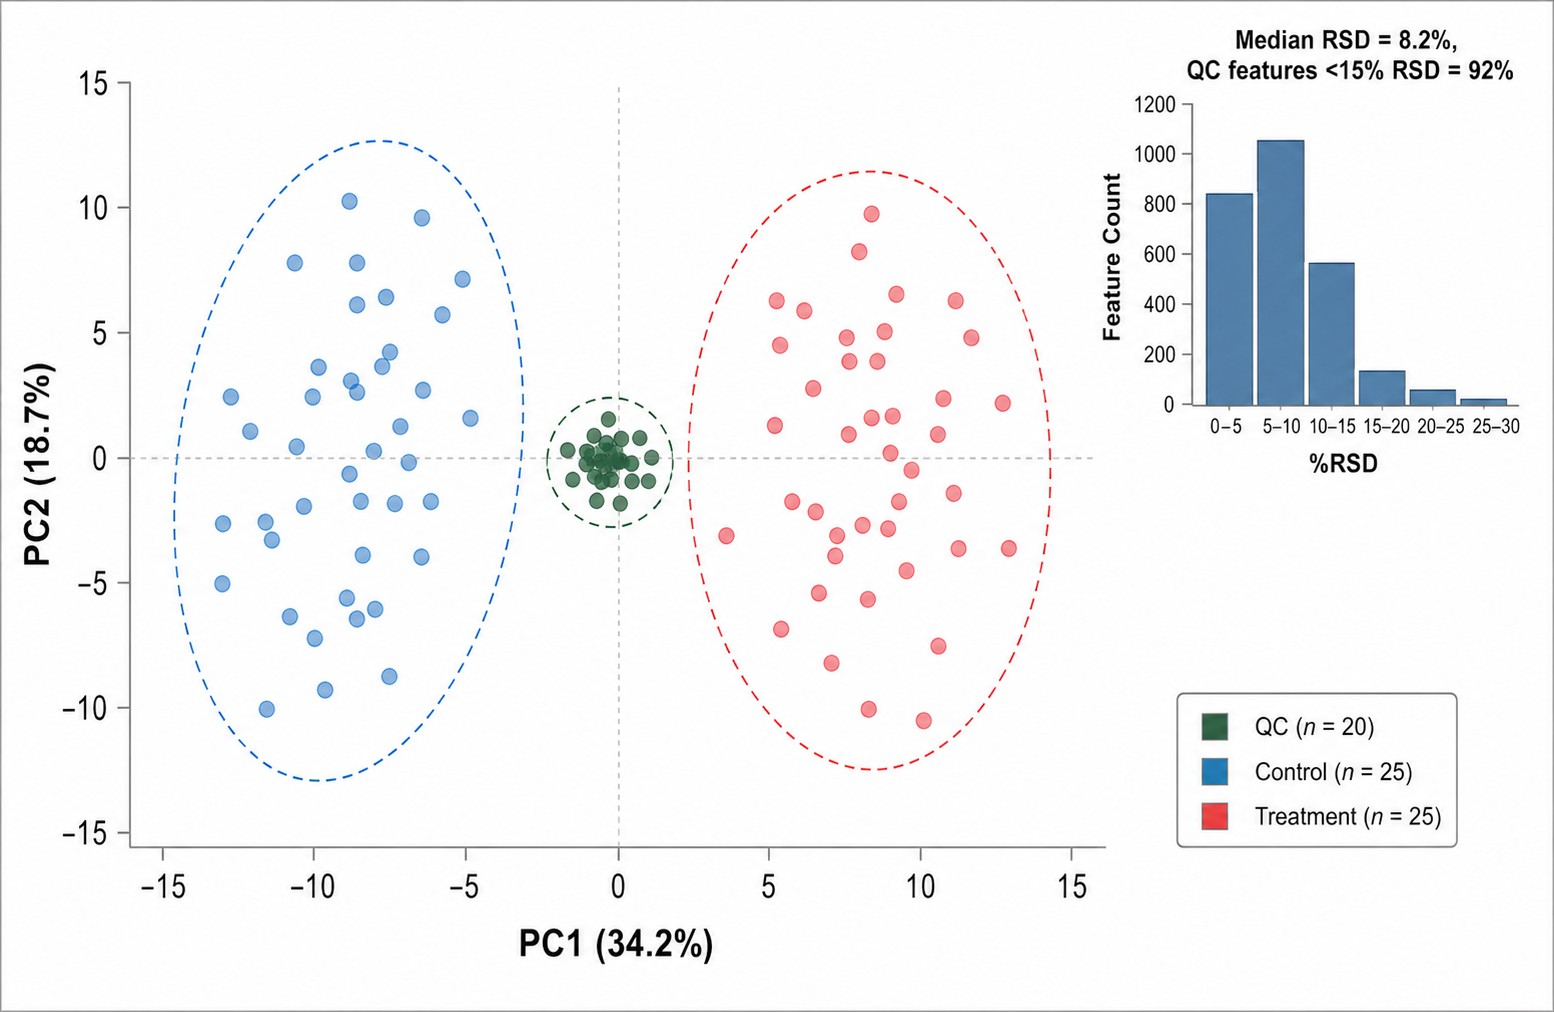
- Quality Control Report: Calibration curves (R² ≥0.99), intra- and inter-batch precision (%CV ≤15%), batch-effect correction plots, outlier detection results
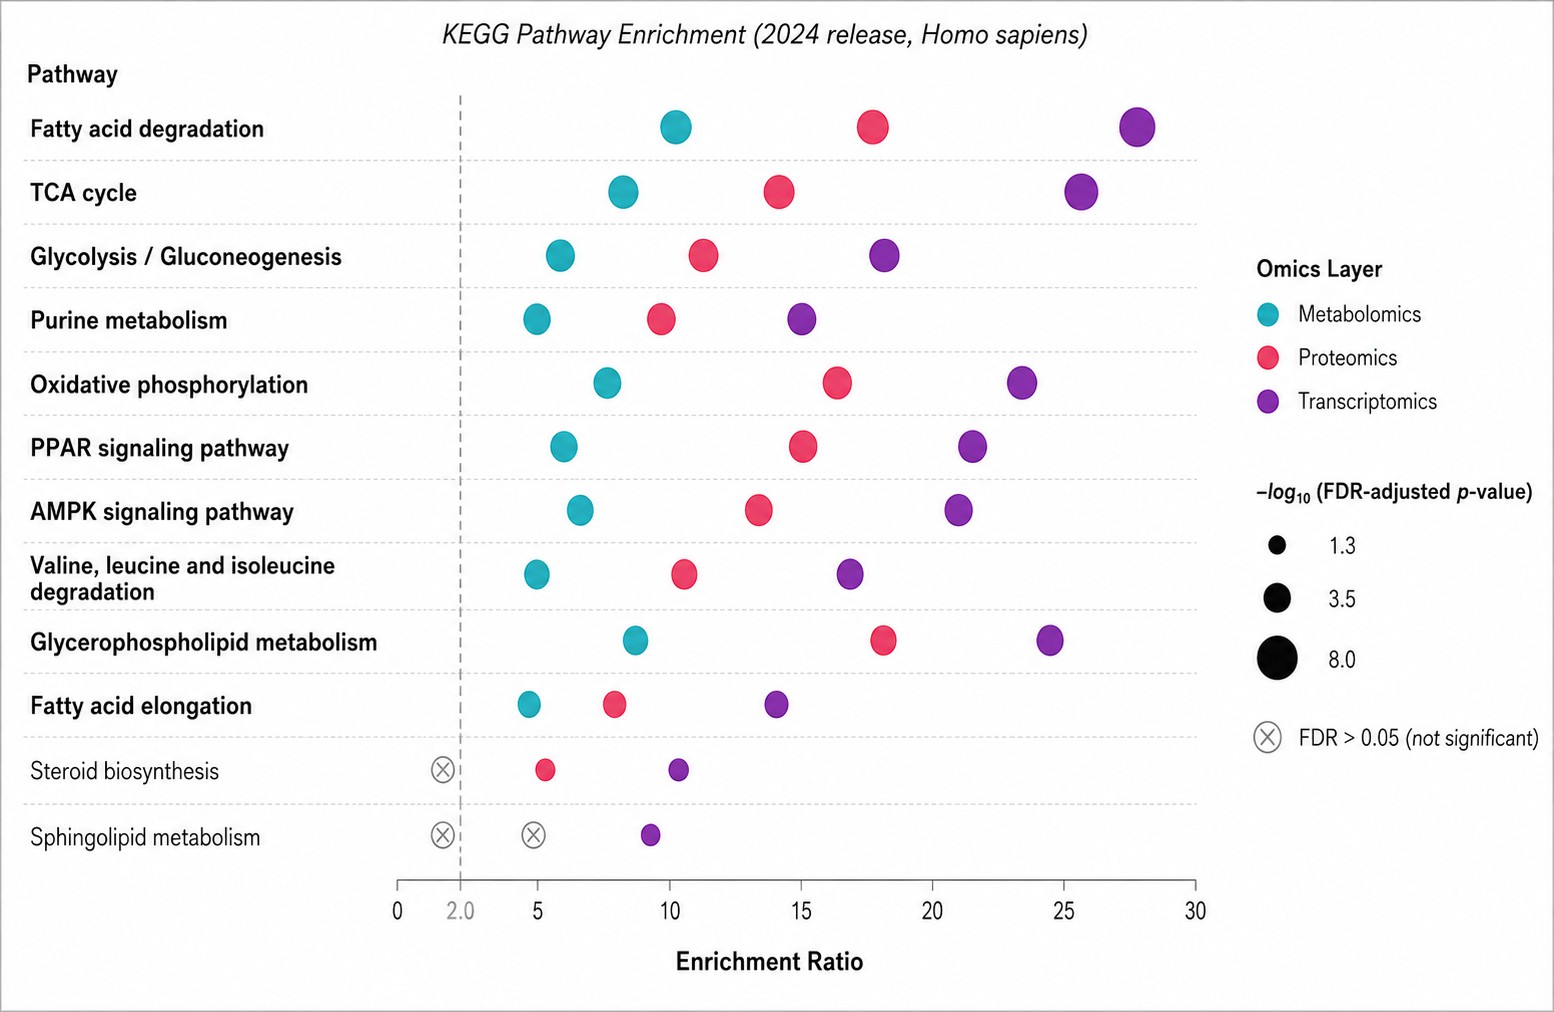
- Integrated Analysis Report: Pathway enrichment (KEGG, Reactome; FDR-adjusted p-values), network diagrams, co-dysregulation heatmaps, multi-block integration performance metrics
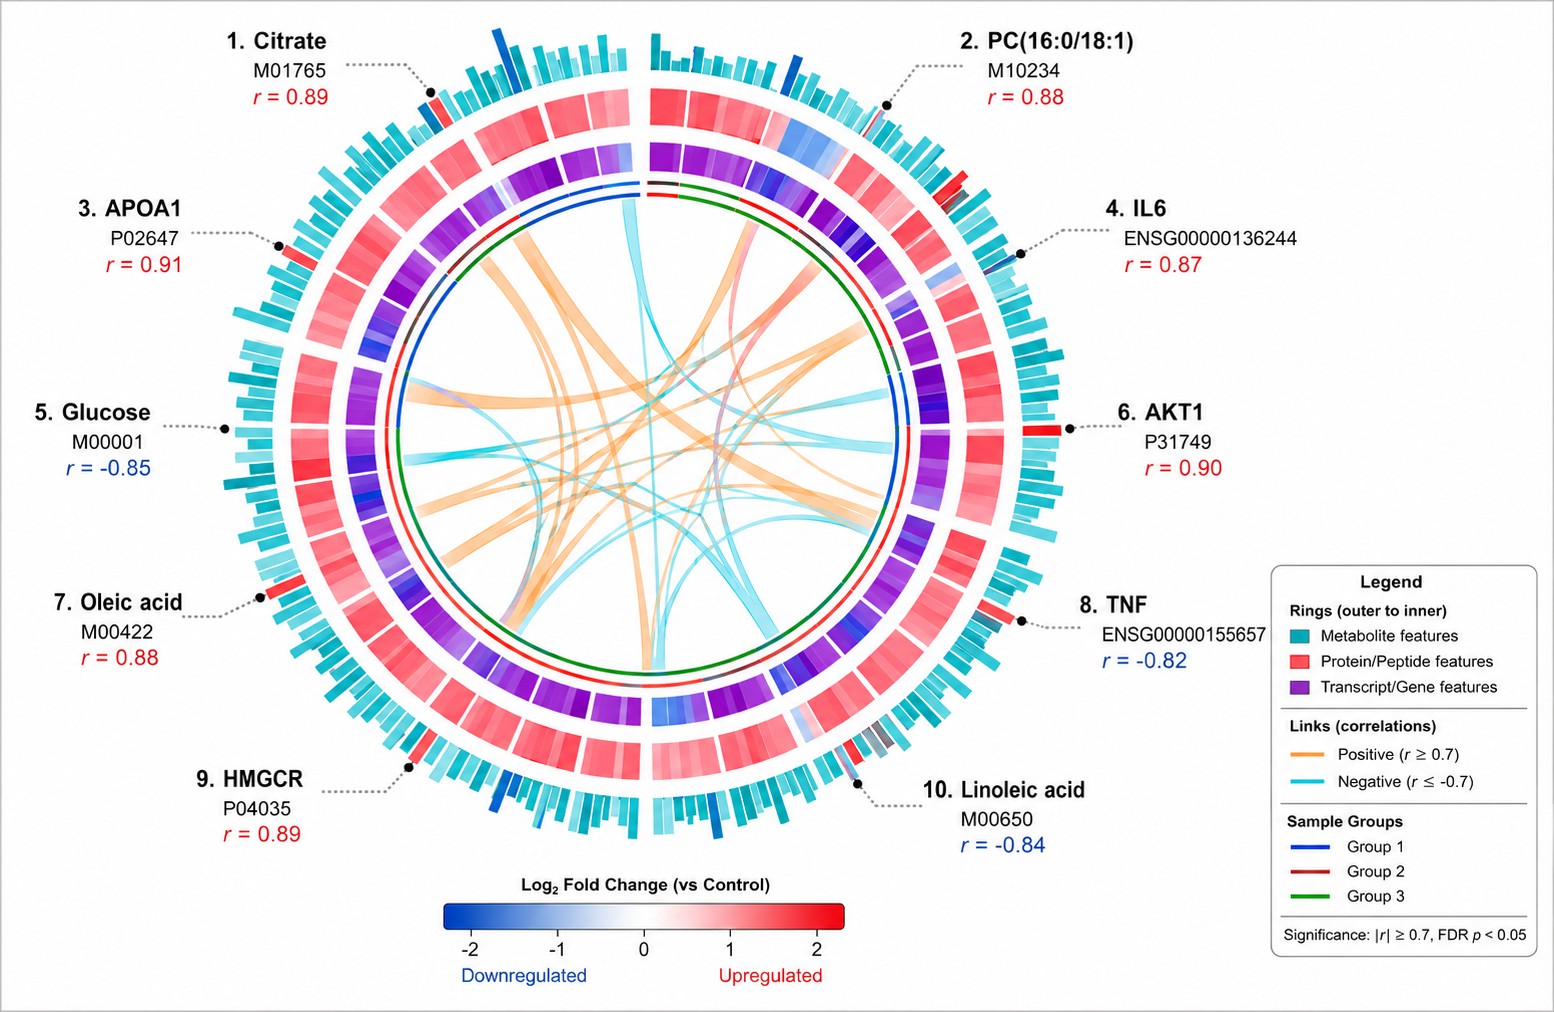
- Visualization Suite: PCA/UMAP projections, correlation Circos plots, factor loading plots, network diagrams, pathway maps with fold-change heat coloring per omics layer
- Methodology & Experimental Details: Full instrument parameters, extraction protocols, data processing pipelines, software versions, and parameter settings for complete experimental transparency and reproducibility
- Raw & Processed Data: Vendor instrument files (.raw, .d), processed peak lists (.mzML, .mgf), open-format matrices for independent analysis
Multi-Omics Case Study: Lipid Droplet-Associated LncRNA LIPTER Preserves Cardiac Lipid Metabolism
Background & Challenge
Obesity and type 2 diabetes impair cardiac fatty acid oxidation, leading to lipid accumulation and cardiomyopathy. The underlying mechanism — how long non-coding RNAs (lncRNAs) regulate lipid droplet trafficking and metabolism in human cardiomyocytes — was unknown. Single-layer transcriptomics would reveal LINC00881 downregulation in diabetic hearts but not the metabolic consequence. A multi-omics integration approach was required to bridge the gap between gene dysregulation and metabolic phenotype.
Experimental Design: Multi-Omics Integration
Han et al. (Nature Cell Biology 2023) integrated four complementary omics layers to investigate LIPTER function:
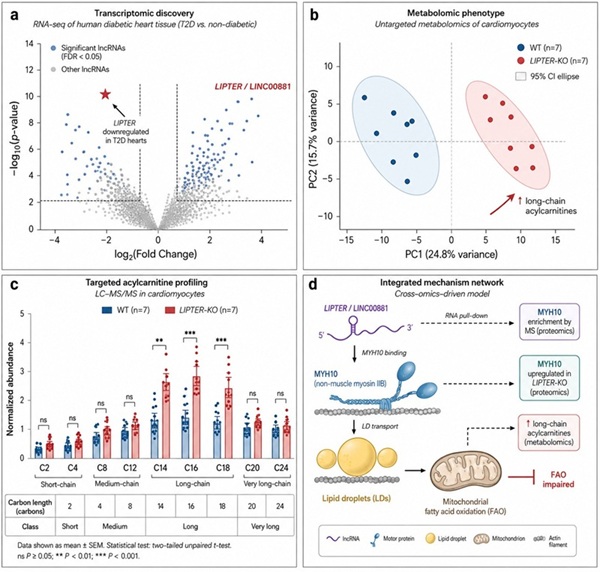
- Transcriptomics (RNA-seq): Identified cardiomyocyte-enriched lncRNAs; prioritized LINC00881 (renamed LIPTER) as most downregulated in type 2 diabetes hearts
- Untargeted Metabolomics (LC-MS/MS): Profiled lipid droplet composition, free fatty acids, acylcarnitines (C2–C24), phospholipids, and energy metabolites. Detected dysregulated acylcarnitine profiles upon LIPTER knockout
- Targeted Proteomics: Quantified myosin motors (MYH10), lipid droplet-associated proteins (PLIN5, ATGL), and mitochondrial respiratory chain proteins
- Functional Assays: Measured lipid droplet transport by live-cell imaging, fatty acid oxidation capacity, oxygen consumption rate, and ATP production
Key Findings from Multi-Omics Integration
- Transcriptomics: LIPTER downregulated ~5-fold in type 2 diabetes vs. controls
- Metabolomics: LIPTER knockout led to accumulation of long-chain acylcarnitines (C14, C16, C18), reduced acetyl-CoA production, and impaired phospholipid remodeling
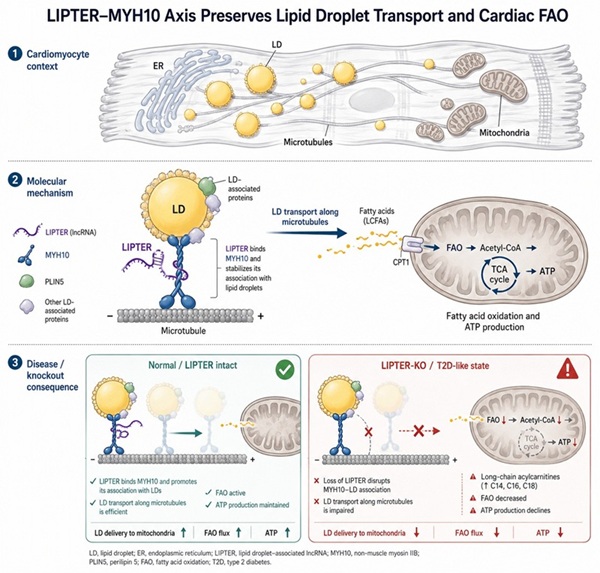
- Proteomics: LIPTER directly binds MYH10 (myosin motor protein); knockout reduces myosin-LD association
- Phenotype: Impaired lipid droplet transport from ER to mitochondria, reduced fatty acid oxidation, mitochondrial dysfunction, cardiomyocyte death under metabolic stress
Why This Case Study Matters for Your Multi-Omics Research
This study exemplifies how integrated multi-omics analysis can bridge the gap between transcriptomic discovery and metabolic mechanism — a challenge faced by many research projects across diverse biological systems. Four key takeaways for researchers considering multi-omics integration:
- Transcriptomics identified the target: RNA-seq screening of patient samples pinpointed LINC00881 (LIPTER) as the most dysregulated lncRNA, but could not reveal its functional role — only multi-omics integration could bridge discovery to mechanism.
- Metabolomics provided the functional readout: Untargeted LC-MS/MS profiling detected ~1,000 features across lipid classes, acylcarnitines (C2–C24), and energy metabolites. The accumulation of long-chain acylcarnitines (C14, C16, C18) upon LIPTER knockout directly demonstrated impaired fatty acid transport into mitochondria — a functional phenotype invisible to transcriptomics alone.
- Proteomics identified the molecular mechanism: Targeted proteomics revealed that LIPTER directly binds MYH10 (myosin motor protein), establishing the physical link between lncRNA dysregulation and impaired lipid droplet transport.
- Cross-omics correlation validated the pathway: The concordance between metabolomic (acylcarnitine accumulation), proteomic (MYH10 binding), and phenotypic (impaired FAO, reduced ATP) data provided multi-layered evidence for the LIPTER/MYH10/LD axis — a level of confidence unattainable from any single omics approach.
This integrated strategy can be applied to any biological question where mechanism discovery is the goal — cancer metabolism, immunology, plant stress responses, or microbial host interactions. The same multi-omics workflow used here is accessible through our service, tailored to your specific model system and research question.
Creative Proteomics' Contribution to This Study
Creative Proteomics provided the untargeted metabolomics (LC-MS/MS on Q Exactive MS systems) and targeted acylcarnitine profiling that established the metabolic phenotype. Specifically:
- Untargeted metabolomics: Detected ~1,000 molecular features across lipid classes, free fatty acids, acylcarnitines, phospholipids, and polar metabolites using Ultimate 3000 UHPLC coupled to Q Exactive MS with ESI ionization
- Targeted acylcarnitine panel: Absolute quantification of short-chain (C2–C6), medium-chain (C8–C12), and long-chain (C14–C24) acylcarnitines with QC-validated calibration (R² ≥0.99, RSD ≤15%)
- Data integration support: Provided processed metabolite feature tables and normalized abundance matrices compatible with downstream multi-omics integration (transcriptomics + proteomics correlation analysis)
The metabolomics data was essential for demonstrating that LIPTER loss impairs fatty acid β-oxidation — a finding that connected the transcriptomic discovery to the functional phenotype and validated the proposed mechanism.
Reference
- Han, L., Huang, D., Wu, S., et al. Lipid droplet-associated lncRNA LIPTER preserves cardiac lipid metabolism. Nature Cell Biology 25, 1033–1046 (2023).
Multi‐omics identify xanthine as a pro‐survival metabolite for nematodes with mitochondrial dysfunction
Gioran A, et al.
Journal: The EMBO Journal
Year: 2019
DOI: https://doi.org/10.15252/embj.201899558
The activity of the aryl hydrocarbon receptor in T cells tunes the gut microenvironment to sustain autoimmunity and neuroinflammation
Merchak AR, Cahill HJ, Brown LC, et al.
Journal: PLoS Biology
Year: 2023
DOI: https://doi.org/10.1371/journal.pbio.3002000
YAP mediates compensatory cardiac hypertrophy through aerobic glycolysis in response to pressure overload
Kashihara T, Mukai R, Oka SI, et al.
Journal: The Journal of Clinical Investigation
Year: 2022
DOI: https://doi.org/10.1172/JCI150595
Resting natural killer cell homeostasis relies on tryptophan/NAD+ metabolism and HIF-1α
Pelletier A, Nelius E, Fan Z, et al.
Journal: EMBO reports
Year: 2023
DOI: https://doi.org/10.15252/embr.202256156
A human iPSC-derived hepatocyte screen identifies compounds that inhibit production of Apolipoprotein B
Liu JT, Doueiry C, Jiang YL, et al.
Journal: Communications Biology
Year: 2023
DOI: https://doi.org/10.1038/s42003-023-04739-9