What is Spatial Metabolomics (MSI)
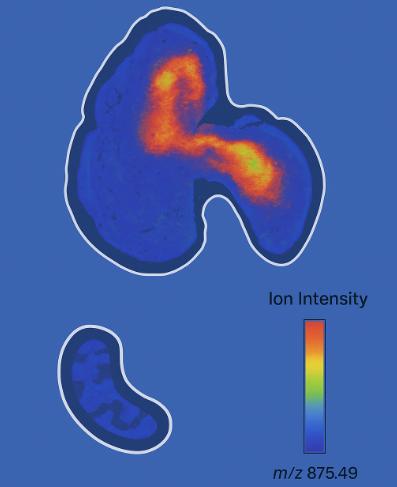
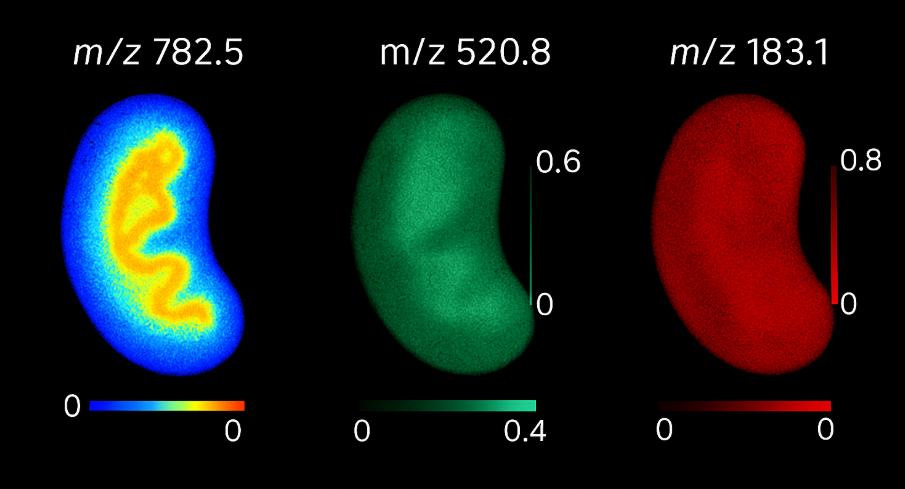
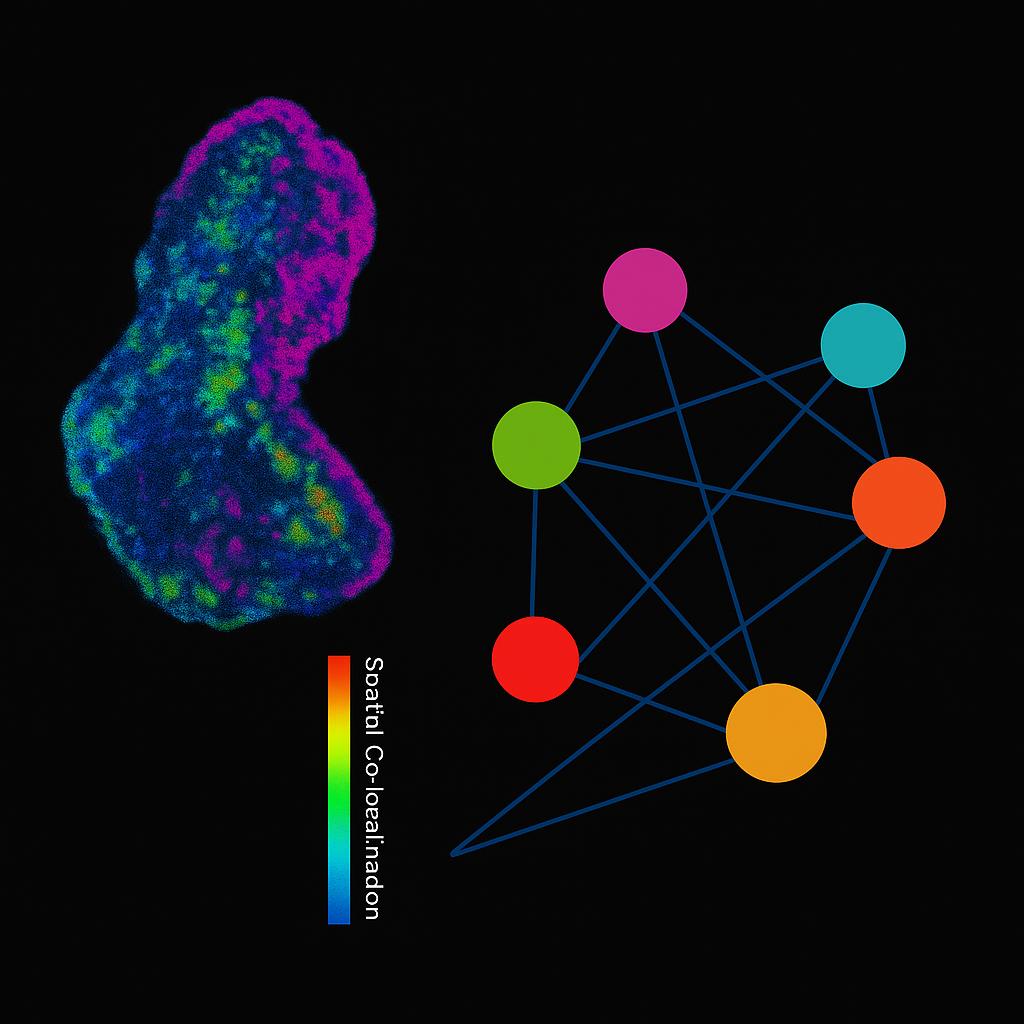
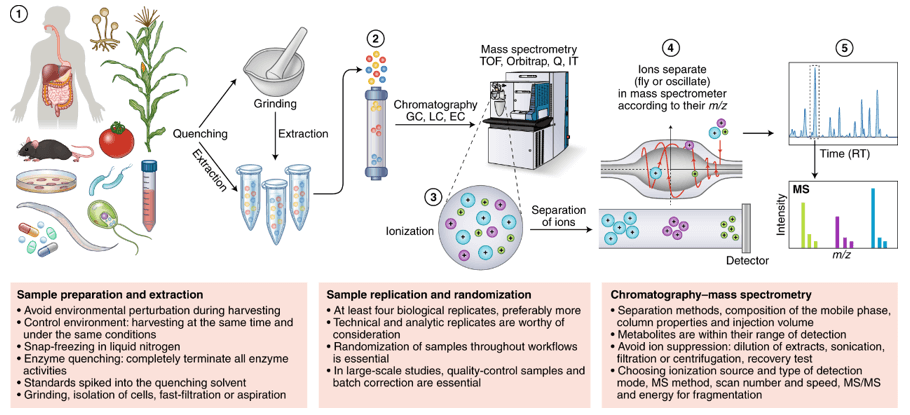
Spatial metabolomics uses mass spectrometry imaging (MSI—e.g., MALDI, DESI, nano-DESI) to map where metabolites, lipids, and xenobiotics reside directly on tissue sections at micrometer-scale pixel sizes. Instead of averaging signals from homogenized extracts, MSI preserves tissue architecture and produces ion images—two-dimensional molecular maps—co-registered to brightfield/H&E for region-of-interest (ROI) analysis. Typical study parameters include:
- Pixel size (spatial resolution): ~10–200 µm (selected per objective and matrix).
- m/z range: ~50–1,500 for small molecules and lipids.
- Ionization: positive and negative modes; matrix/solvent chemistry tuned per analyte class.
- Data outputs: imzML + vendor raw files, ROI statistics tables, pathway summaries, and publication-ready images.
Compatible sample types include fresh-frozen tissues, selected FFPE (lipid-focused and defined metabolite classes), organoids/spheroids, microbial biofilms, and plant/food matrices (method dependent).
Why Choose Spatial Metabolomics for Your Research
Why Now Is the Right Time to Use Spatial Metabolomics
- Mature imaging performance: Micrometer-scale pixel sizes with high mass accuracy (ppm-level on high-resolution analyzers), dual-polarity acquisition, and lock-mass/internal-calibrant workflows deliver reproducibility suitable for decision-grade research.
- Expanded chemical coverage: On-tissue derivatization (carbonyls, amines, carboxylates) and optimized matrices/solvents improve detection of difficult metabolite classes.
- Standardized, auditable pipelines: imzML-centered workflows support peak picking, deisotoping/adduct deconvolution, recalibration, normalization, annotation, and pathway enrichment with transparent QC.
- Broader sample compatibility & throughput: Robust methods for fresh-frozen, selected FFPE (lipid-forward and defined metabolite classes), organoids, and complex matrices enable consistent sectioning, prep, and imaging at study scale.
- Actionable deliverables: Clear ROI effect sizes and pathway panels shorten time from raw images to interpretable insights; assets export cleanly to common analytics environments.
What You Can Accomplish with This Service?
- Map microenvironments with micrometer precision to reveal gradients and borders that guide hypothesis refinement.
- Differentiate molecular phenotypes between ROIs (e.g., core vs. periphery, interface zones, treatment vs. control) with statistics suitable for reports and submissions.
- Prioritize program targets by linking localized metabolite patterns to pathways and phenotypes.
- Reduce project risk by flagging off-region accumulation of small molecules and lipid remodeling early.
- Elevate documentation with reproducible ion images, ROI statistics, and exportable analysis artifacts.
Typical Questions We Answer
 Which metabolites or lipids are enriched at defined ROIs?
Do energy or redox metabolite gradients exist across a boundary?
How does a compound or genetic perturbation remodel the local metabolome?
Which pathways are spatially co-activated or mutually exclusive?
Service Scope and Key Differentiators in Our Spatial Metabolomics Analysis
- Multi-platform MSI: MALDI-MSI for broad coverage and high throughput; DESI-MSI for minimal prep; nano-DESI for enhanced sensitivity on select targets.
- Dual-polarity acquisition to maximize coverage of lipids, primary metabolites, xenobiotics, and secondary metabolites.
- On-tissue chemistry options (derivatization for carbonyls, amines, and carboxylates; matrix selection tailored to analyte classes).
- Targeted + untargeted pipelines with library and formula-based annotation, isotopolog detection, and adduct deconvolution.
- Quantitative region statistics with multiple normalization strategies (TIC, internal calibrants, ROI-specific).
- Regimented QC: section-to-section alignment, lock-mass correction, batch monitors, and drift control with calibrant arrays.
- Rich deliverables: imzML and vendor files, ion images, ROI maps, annotated feature tables, pathway overlays, and analysis notebooks.
Technology Platforms and Analytical Parameters for Spatial Metabolomics
Mass spectrometry imaging platforms
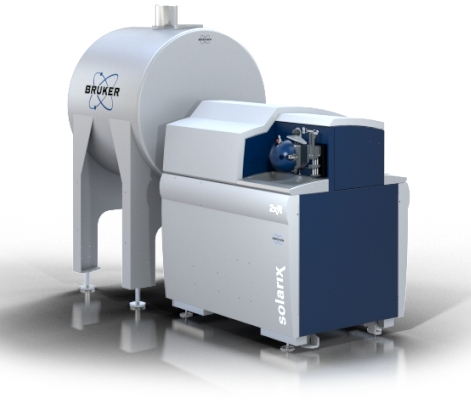
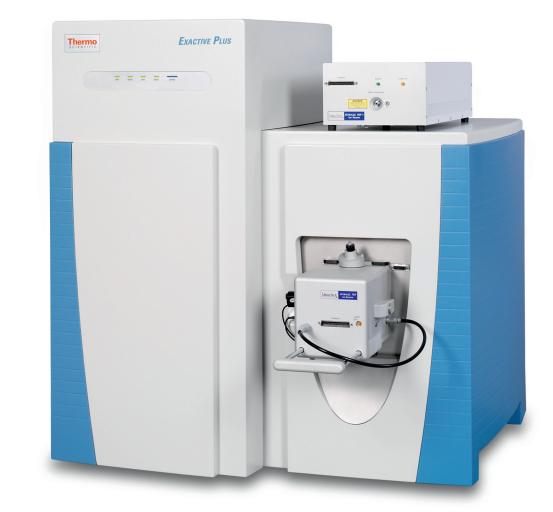
- MALDI-MSI (Orbitrap/FT-ICR/TOF): broad metabolite & lipid coverage, fast scanning.
- DESI-MSI / nano-DESI: ambient ionization; ideal for delicate or limited-prep samples.
Typical operating ranges (customizable by study)
- Spatial resolution (pixel size): ~10–200 µm (study-dependent).
- Section thickness: ~5–20 µm for frozen tissue; FFPE thickness per method.
- Mass range (m/z): ~50–1,500 (expandable with method).
- Mass accuracy: down to low-ppm on high-resolution platforms with internal/lock mass.
- Ionization modes: positive and negative; adduct engineering where relevant.
- Matrices (MALDI examples): CHCA, DHB, 9-AA, DAN, and analyte-specific formulations.
- Normalization: TIC, RMS, internal standards, or histology-guided strategies.
- File formats: imzML + native vendor formats; processed outputs in CSV/Parquet; figures in PNG/TIFF/SVG.
Guidance on Choosing the Right Spatial Metabolomics Method for Your Study
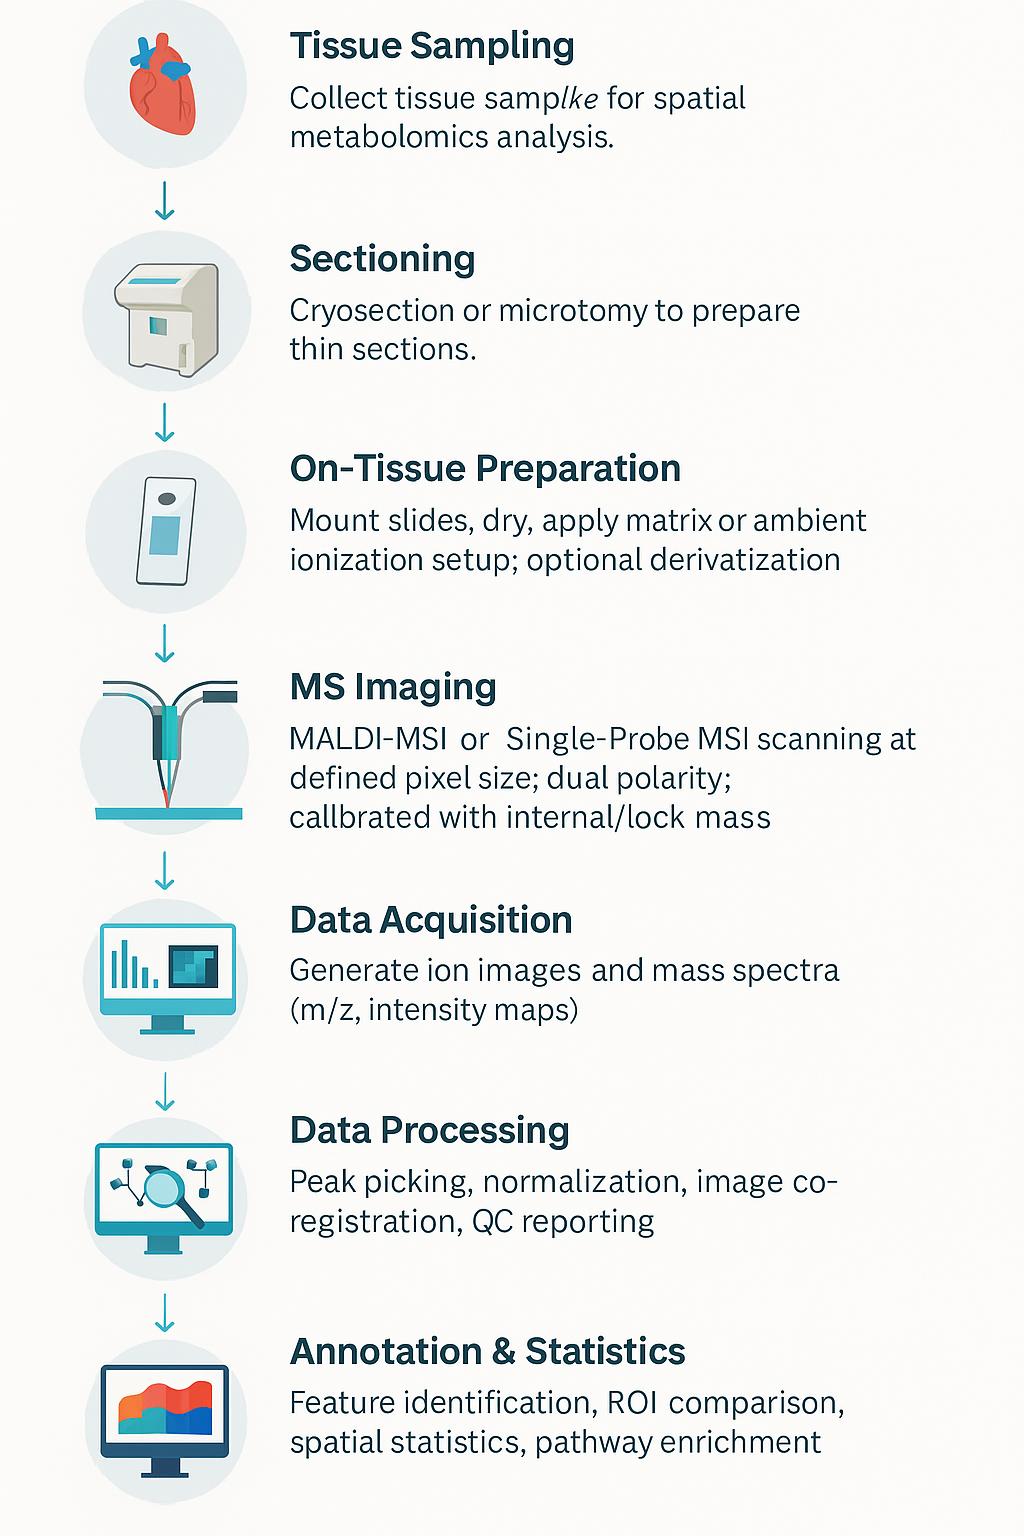
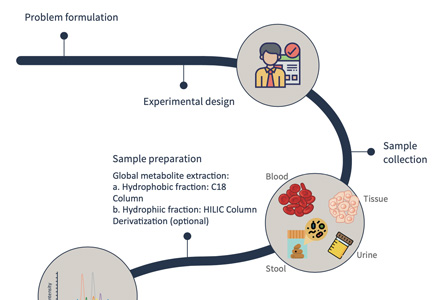
Step-by-Step Workflow of Our Spatial Metabolomics Analysis Service
Sample Types We Support
| Sample Type |
Description / Notes |
| Fresh-frozen tissues |
Mammalian, plant, microbial consortia, xenografts; embedded in OCT or equivalent |
| FFPE sections |
Lipid-focused MSI and select metabolite panels; optimized deparaffinization and antigen retrieval as appropriate |
| Organoids & spheroids |
Includes 3D cultures; prepared for sectioning and MSI imaging |
| Microbial biofilms |
Suitable for spatial metabolomics of microbial communities |
| Tissue microarrays (TMAs) |
Multiplexed ROI analysis possible |
| Materials science samples |
Method permitting; matrix-dependent optimization |
| Food matrices |
Method permitting; compatibility evaluated during project design |
For detailed preparation and shipping guidelines, please contact our team before sending samples.
Quality Assurance You Can Audit
We implement rigorous, transparent QC protocols to ensure data accuracy, reproducibility, and traceability:
- Lock-mass & Internal Calibrants — Applied to every batch and slide set for consistent mass accuracy.
- Replicate Regions & Check Slides — Precision assessment through repeated ROI analysis.
- Background Controls — Blank regions and matrix-only slides to monitor noise and adduct formation.
- Carryover Checks — Inter-tile and inter-slide controls to detect contamination.
- Acceptance Criteria — Defined thresholds for mass accuracy, spatial fidelity, pixel completeness, and S/N ratio.
- Change-Controlled Methods — Any procedural deviations are fully documented in the final report.
Data Analysis, Bioinformatics, and Reporting Deliverables
- Ion images for prioritized features (publication-ready).
- ROI-level tables (mean, median, variance, effect sizes, FDR-controlled p-values).
- Quantitation Approaches
- Relative quantitation with normalization and batch controls
- Absolute/semi-absolute quantitation using stable-isotope standards (feasibility dependent)
- Drift/batch correction via calibrant arrays and pooled slides
- Spatial stats (co-localization matrices, gradient analysis, neighborhood enrichment).
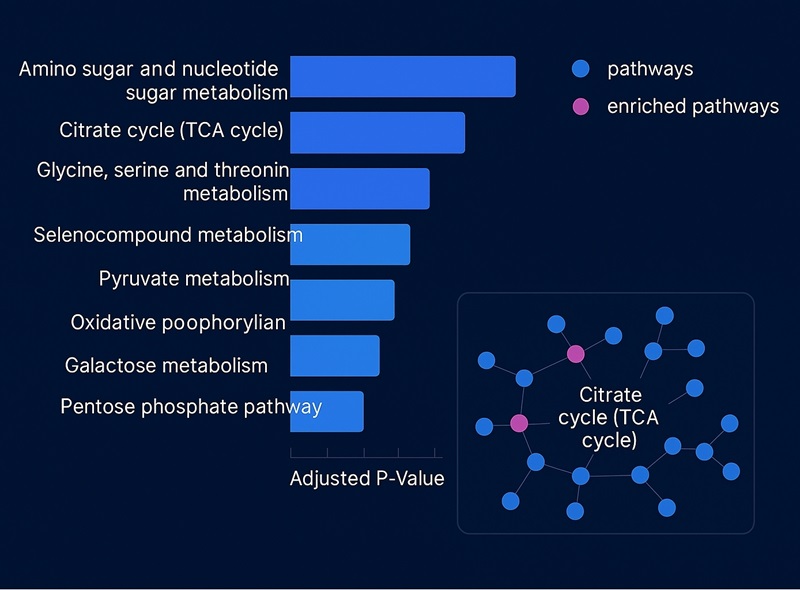
- Pathway panels summarizing localized pathway activity trends.
- Audit-ready methods: instrument settings, calibration details, matrix recipes, derivatization protocols, and QC metrics.
- All raw & processed data (imzML, vendor raw, peak lists, metadata JSON) for downstream re-analysis.
Customizable Specifications for Your Spatial Metabolomics Study
| Dimension |
Option Set (examples) |
| Pixel size |
~10, 25, 50, 100, 200 µm (trade-off vs. sensitivity & coverage) |
| Polarity |
Positive, Negative, Sequential Dual |
| Mass analyzer |
Orbitrap, FT-ICR, TOF (study-dependent) |
| m/z range |
~50–1,500 (custom windows possible) |
| Matrices |
CHCA, DHB, 9-AA, DAN; custom blends |
| Derivatization |
Carbonyl-, amine-, or carboxyl-targeted chemistries |
| Normalization |
TIC, internal standard, ROI-specific |
| Deliverables |
imzML + raw, ion images, ROI stats, pathway summaries, methods dossier |
Getting Started: What We Need from You
- Study objective and hypotheses; target metabolites/classes if known.
- Sample list, matrix, storage conditions, and any prior staining or treatments.
- Preferred pixel size, ROI definitions, and required statistics or comparisons.
- Any constraints on sample consumption or serial-section usage.
We'll propose a fit-for-purpose design with clear acceptance criteria, an instrument/chemistry plan, and data/figure deliverables aligned to your milestones.