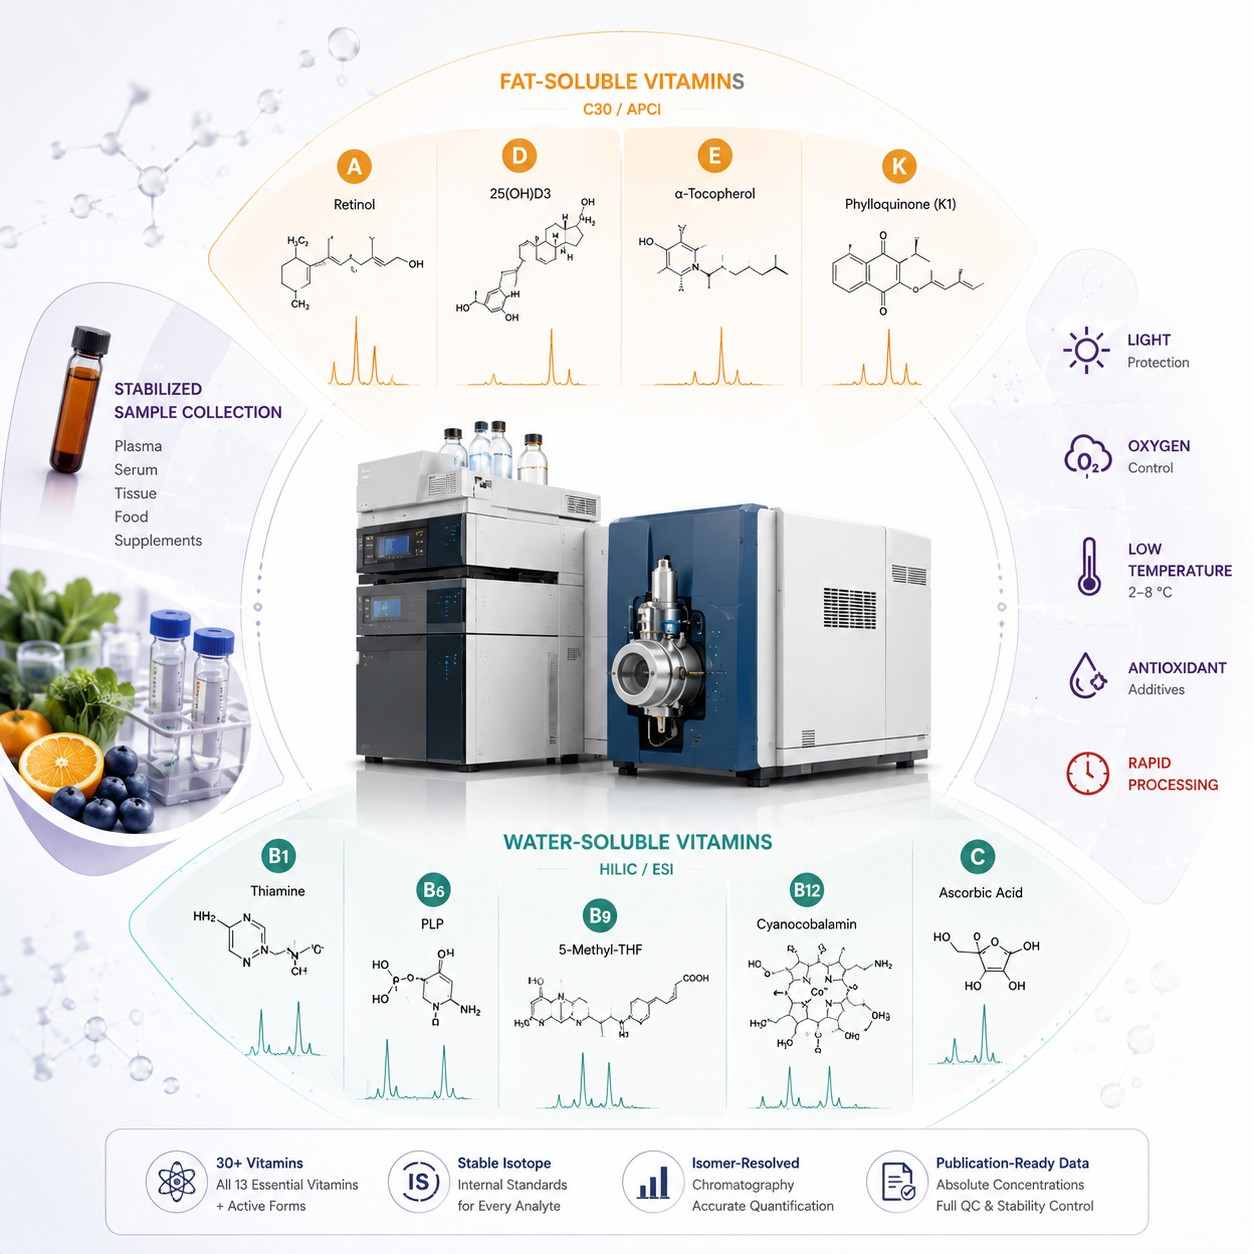
Fat-Soluble Vitamin Panel — A, D, E, K & Active Metabolites
Fat-soluble vitamins require alkaline saponification or LLE extraction to release them from lipid-rich matrices, C30 or C18 chromatography to resolve structural isomers, and APCI ionization for optimal sensitivity on non-polar analytes. Each vitamin below is quantified against its own stable isotope internal standard.
| Vitamin |
Key Forms Quantified |
Biological Significance & Research Context |
| Vitamin A |
Retinol, retinyl palmitate, retinyl acetate, retinal, all-trans-retinoic acid, 13-cis-retinoic acid, beta-carotene (provitamin A) |
Retinol/retinyl ester ratio reflects hepatic stores. Retinoic acid isomers (ATRA) are key tools in developmental biology and oncology research. Beta-carotene is the primary provitamin A source. |
| Vitamin D |
Vitamin D2 (ergocalciferol), D3 (cholecalciferol), 25(OH)D2, 25(OH)D3, 1,25(OH)2D2, 1,25(OH)2D3, 3-epi-25(OH)D3 |
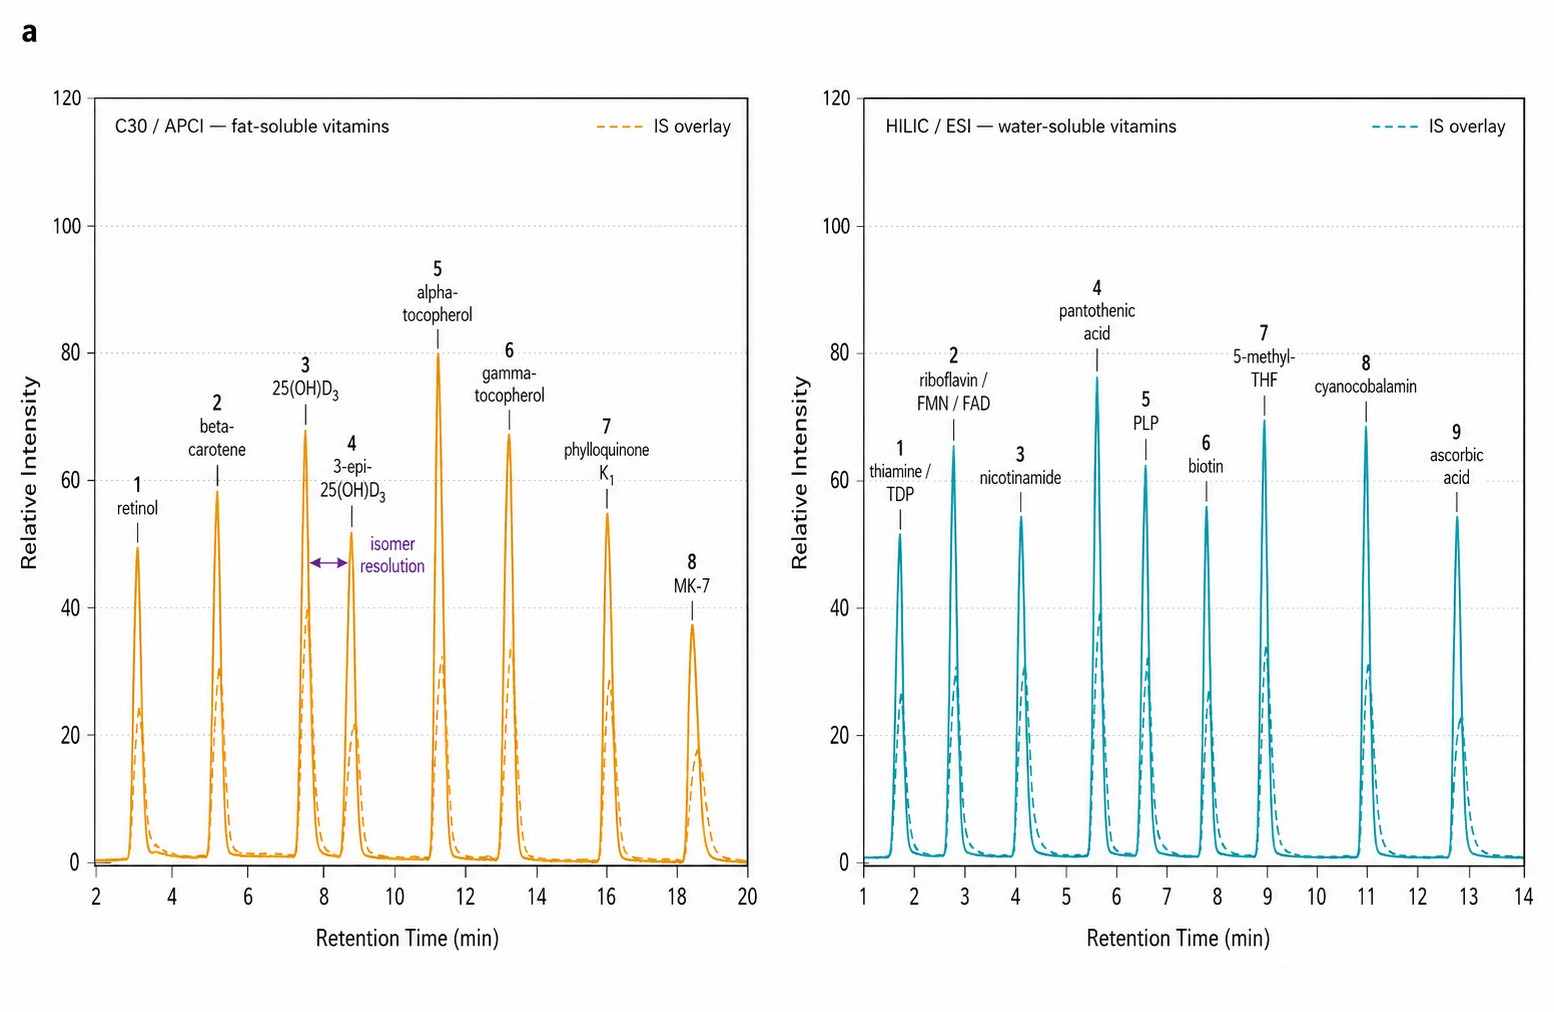
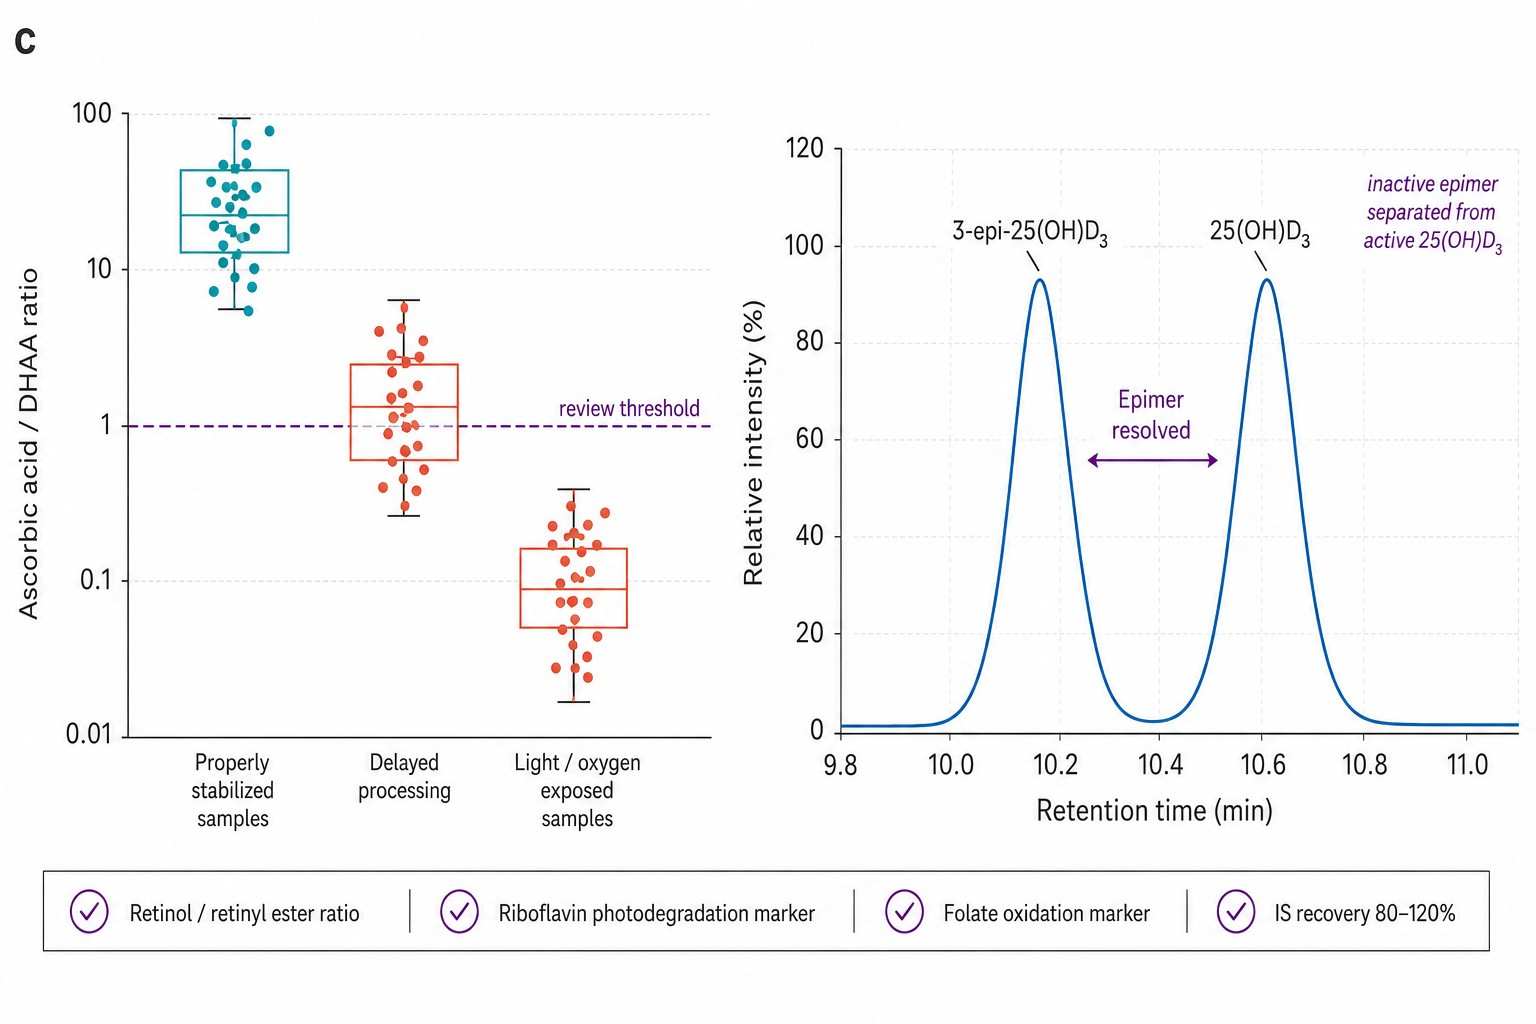
25(OH)D is the primary circulating form; 1,25(OH)2D is the hormonally active metabolite. 3-epi-25(OH)D3 is biologically inactive yet accounts for up to 60% of total 25(OH)D in infants — requires chromatographic resolution. |
| Vitamin E |
alpha-, beta-, gamma-, delta-tocopherols; alpha-, beta-, gamma-, delta-tocotrienols |
alpha-Tocopherol is the biologically preferred form; gamma-tocopherol is the major dietary form with distinct anti-inflammatory activity. Tocotrienols have emerging roles in cholesterol and neuroprotection research. |
| Vitamin K |
Phylloquinone (K1), menaquinone-4 through menaquinone-13 (K2, MK-4 to MK-13) |
K1 (plant-derived) supports coagulation factor carboxylation. K2/MK-4 to MK-13 (microbial origin) regulates osteocalcin and matrix Gla protein. MK-7 is the most bioavailable menaquinone. |
Water-Soluble Vitamin Panel — B-Complex (B1-B12) & Vitamin C
Water-soluble vitamins require protein precipitation or acidic extraction, HILIC or ion-pairing chromatography for polar retention, and ESI ionization. Several B vitamins are light- and heat-sensitive, requiring protected handling. Each vitamin is quantified against its own stable isotope IS.
| Vitamin |
Key Forms Quantified |
Biological Significance & Research Context |
| B1 (Thiamine) |
Thiamine, thiamine monophosphate (TMP), thiamine diphosphate (TDP) |
TDP is the active coenzyme (transketolase, PDH, alpha-KGDH). TDP/TMP ratio tracks cellular thiamine phosphorylation. |
| B2 (Riboflavin) |
Riboflavin, flavin mononucleotide (FMN), flavin adenine dinucleotide (FAD) |
Precursor for FMN and FAD — cofactors for over 150 flavoprotein enzymes. Intensely light-sensitive; all handling under amber light |
| B3 (Niacin) |
Nicotinic acid, nicotinamide, nicotinuric acid, N1-methylnicotinamide |
NAD+/NADP+ precursor. Nicotinamide is the predominant dietary form. Urinary N1-methylnicotinamide is a quantitative readout of whole-body niacin turnover |
| B5 (Pantothenic Acid) |
Pantothenic acid, pantetheine, 4'-phosphopantetheine |
Coenzyme A and acyl carrier protein precursor — essential for fatty acid metabolism and TCA cycle |
| B6 (Pyridoxine) |
Pyridoxal (PL), pyridoxamine (PM), pyridoxine (PN), pyridoxal-5'-phosphate (PLP), pyridoxamine-5'-phosphate (PMP), 4-pyridoxic acid (PA) |
PLP is the active coenzyme (over 90% of plasma B6). PLP/PL ratio tracks B6 phosphorylation; 4-pyridoxic acid is the urinary excretion form. |
| B7 (Biotin) |
Biotin, bisnorbiotin, biotin sulfoxide, biotin-d-sulfoxide |
Carboxylase cofactor. Biotin-streptavidin binding (Kd ~10^-15 M) requires dissociation steps in sample preparation. Urinary bisnorbiotin tracks catabolism. |
| B9 (Folate) |
Folic acid (FA), dihydrofolate (DHF), tetrahydrofolate (THF), 5-methyl-THF, 5-formyl-THF (folinic acid), 5,10-methenyl-THF, 5,10-methylene-THF, 10-formyl-THF, homocysteine (functional marker) |
Multiple interconvertible forms at trace levels — the most analytically challenging B vitamin. 5-methyl-THF dominates in plasma. Unmetabolized folic acid tracks synthetic folate exposure. RBC folate reflects longer-term pool size. |
| B12 (Cobalamin) |
Cyanocobalamin, methylcobalamin, adenosylcobalamin, hydroxocobalamin, holotranscobalamin (active B12) |
Methylcobalamin and adenosylcobalamin are the active coenzyme forms. Holotranscobalamin is the metabolically active fraction; MMA and homocysteine track B12-dependent enzyme function. |
| Vitamin C |
Ascorbic acid, dehydroascorbic acid (DHAA) |
Antioxidant and collagen synthesis cofactor. Rapidly oxidizes in air; requires metaphosphoric acid + EDTA stabilization at collection. Total = ascorbic acid + DHAA. |
Stability & Sample Handling — How We Protect Your Vitamins from Degradation
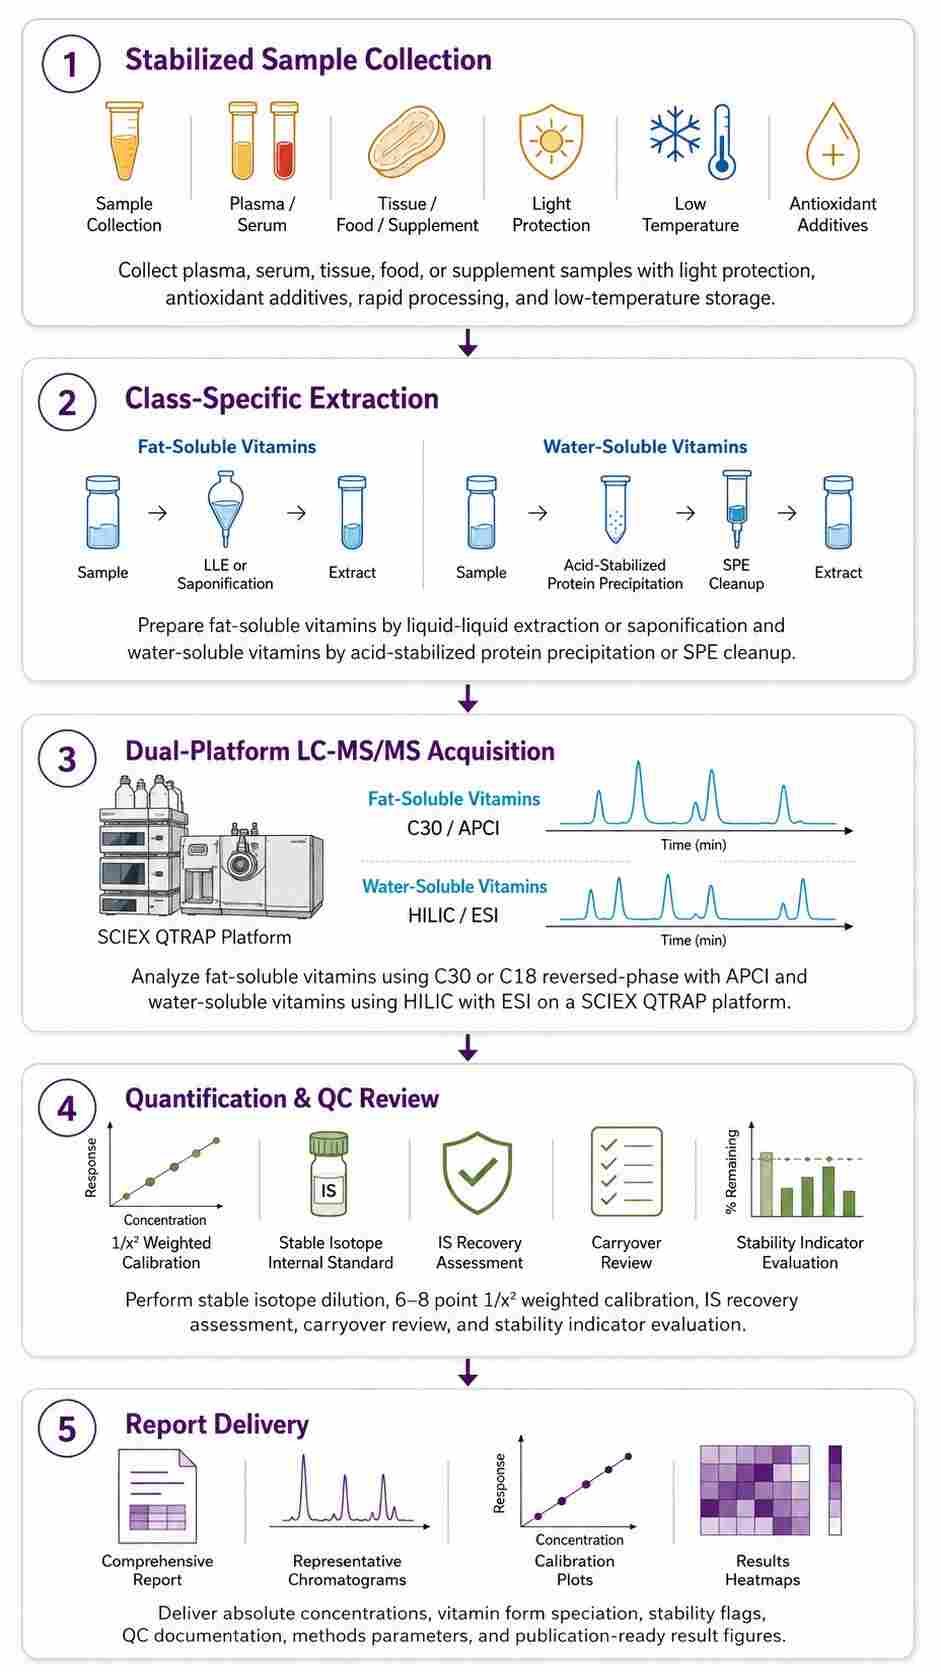
Vitamin degradation is the single largest source of error in vitamin analysis — not the LC-MS/MS instrument, not the calibration, but what happens between sample collection and extraction. Our protocols address all four degradation pathways with matrix-specific countermeasures developed from our internal stability studies.
- Light Protection — Riboflavin (B2), retinol (A), phylloquinone (K), and folate (B9) degrade under ambient fluorescent light within hours. All sample handling performed under amber safelight or in darkness. Samples collected into amber tubes or foil-wrapped. Autosampler uses amber vials at 4 degree C.
- Oxygen Protection — Ascorbic acid (C), alpha-tocopherol (E), and folate (B9) undergo rapid air oxidation. Blood samples: plasma separated within 30 min, ascorbic acid stabilized with metaphosphoric acid (1% w/v) + EDTA (0.1% w/v). Tissue: homogenized under nitrogen atmosphere in degassed extraction solvent containing antioxidant cocktail (BHT + ascorbic acid).
- Temperature Control — All samples processed on ice (0-4 degree C) or at 4 degree C. Flash-freezing in liquid N2 immediately after collection. Long-term storage at -80 degree C. Water-soluble vitamins lose >20% after 4 h at room temperature; freezing at -80 degree C extends stability to 7+ days. Fat-soluble vitamins are more stable but 25(OH)D and alpha-tocopherol show declining trends at refrigerated temperatures beyond 24 h.
- Enzymatic Degradation Prevention — Plasma/serum separated within 30 min of collection (continued cellular metabolism alters vitamin levels). Folate conjugase inhibitors (EDTA) added for RBC folate assays. Microbial growth prevented by sodium azide (0.02%) for 24 h urine collections. Heat-labile vitamins (folate, B12) extracted without acid hydrolysis — enzymatic deconjugation instead.
Analytical Platforms — Two Dedicated Workflows for Fat-Soluble and Water-Soluble Vitamins
Fat-Soluble Vitamin Platform
Extraction: Alkaline saponification (ethanolic KOH, 60 degree C, 30 min) for esterified forms in food/tissue; LLE (hexane:ethyl acetate) for plasma/serum; SPE (C18 or HLB) for low-concentration metabolites.
Chromatography: C30 or C18 reversed-phase column with isocratic or gradient methanol:acetonitrile:water. C30 columns essential for resolving structural isomers — beta-carotene from alpha-carotene, gamma-tocopherol from beta-tocopherol, and phylloquinone (K1) from menaquinones (K2).
Ionization: APCI (atmospheric pressure chemical ionization) — preferred for non-polar vitamins (D, E, K). ESI used for more polar species (retinol, retinoic acid). Chemical derivatization (Amplifex, DMEQ-TAD) for vitamin D metabolites to enhance signal 3-295 fold and enable 3-epi-25(OH)D3 separation.
Platform: SCIEX QTRAP 6500+ with APCI/ESI dual source. Agilent 1260 Infinity II HPLC.
Water-Soluble Vitamin Platform
Extraction: Protein precipitation with acetonitrile:methanol:water (with 0.1% formic acid for pH control). Acidic extraction (perchloric acid + metaphosphoric acid) for vitamin C stabilization. Enzymatic deconjugation (rat serum conjugase) for folate polyglutamate hydrolysis. SPE cleanup (HLB or WCX) for complex food/feed matrices.
Chromatography: HILIC (Waters XBridge BEH Amide or equivalent) for polar B vitamins and vitamin C. Ion-pairing reversed-phase (heptafluorobutyric acid) as alternative for B vitamin profiling. Simultaneous quantification of 12 water-soluble vitamins within 20 min gradient.
Ionization: ESI positive mode for B vitamins; ESI negative mode for ascorbic acid. MRM acquisition with 2-3 transitions per analyte. Isotope-labeled IS for every B vitamin (d3-B1, 13C4-B2, d4-B3, 13C3-B5, d3-B6, d4-B7, 13C5-B9, d4-B12, 13C6-C).
Platform: SCIEX QTRAP 6500+ with ESI source. Waters ACQUITY UPLC with HILIC column.
Vitamins Analysis Workflow — From Collection to Quantification
Applications of Vitamin Analysis
Vitamins Analysis Deliverables — What You Receive
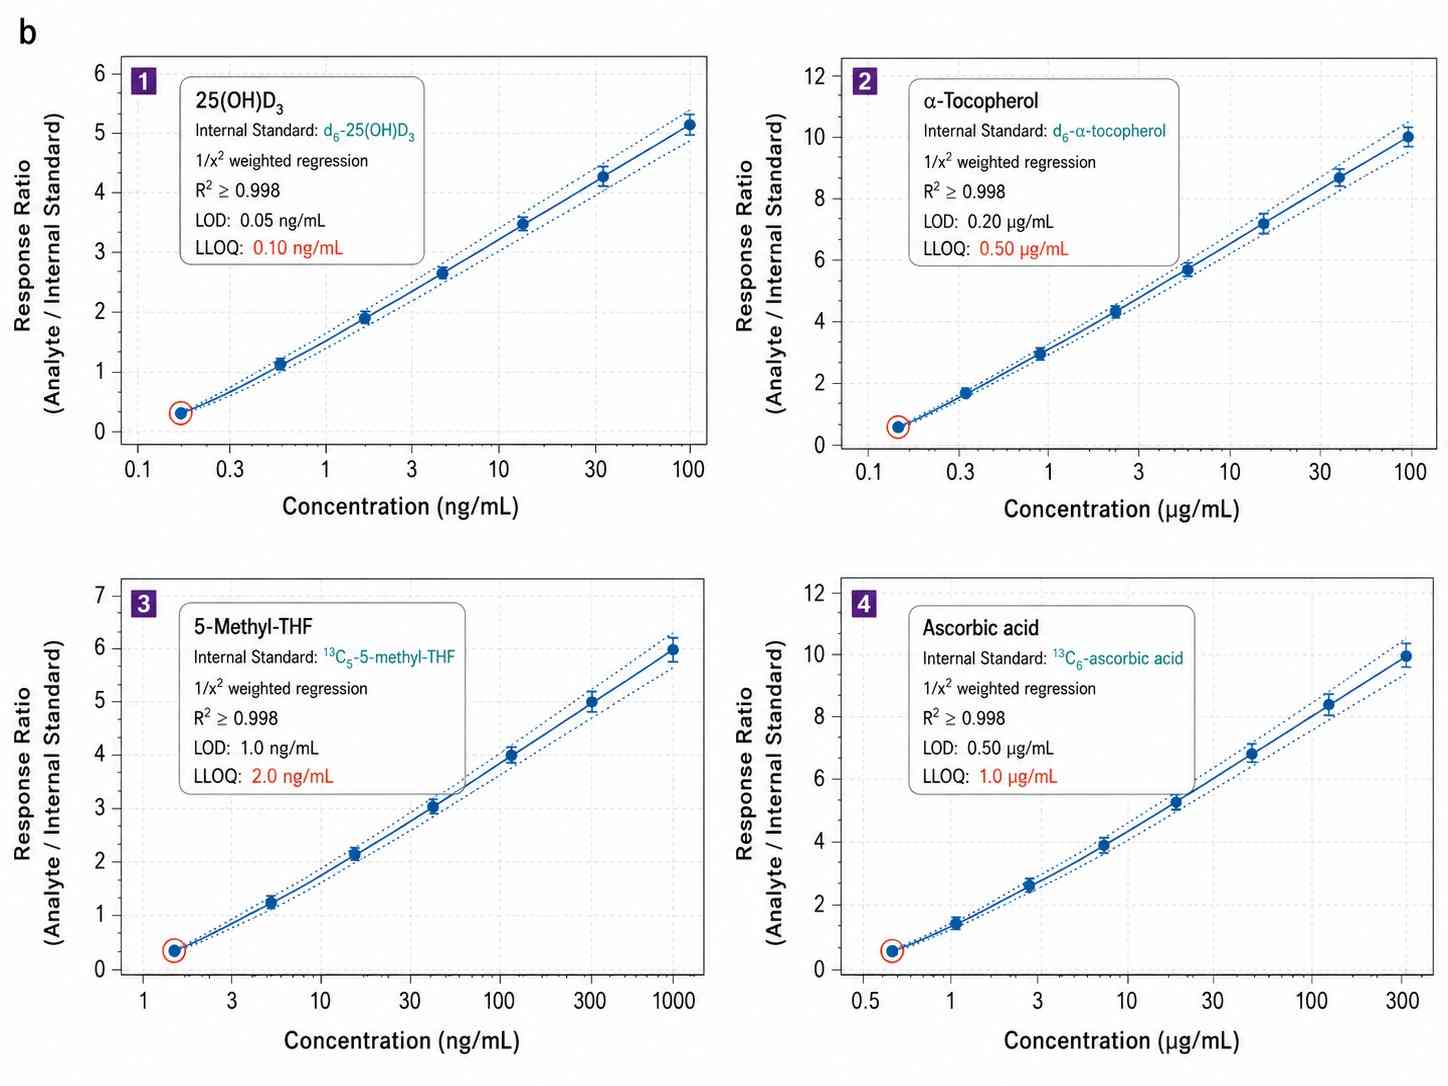
- Quantitative Concentration Table — Absolute concentrations (ng/mL for plasma, ug/g for tissue/food) for every vitamin form per sample. Excel and CSV. LOD/LLOQ flags. Stability degradation indicators per sample (ascorbic acid/DHAA ratio, retinol/retinyl ester ratio). IS recovery per sample.
- QC Report — Calibration curves (6-8 points, 1/x2 weighted, R2 and back-calculated accuracy per analyte). Pooled QC RSD. IS recovery (80-120%). Blank carryover. Spike recovery at 3 levels. Inter-batch bridging QC.
- Chromatograms & Spectral Data — MRM traces for each vitamin form with IS overlay. C30 isomer separation chromatograms (vitamin E tocopherols, vitamin D epimers, carotenoids). Raw data files on request.
- Methods Documentation — Complete extraction protocol per vitamin class, LC-MS/MS parameters (column, gradient, MRM transitions, ion source), derivatization details if applicable. Formatted for manuscript methods section.
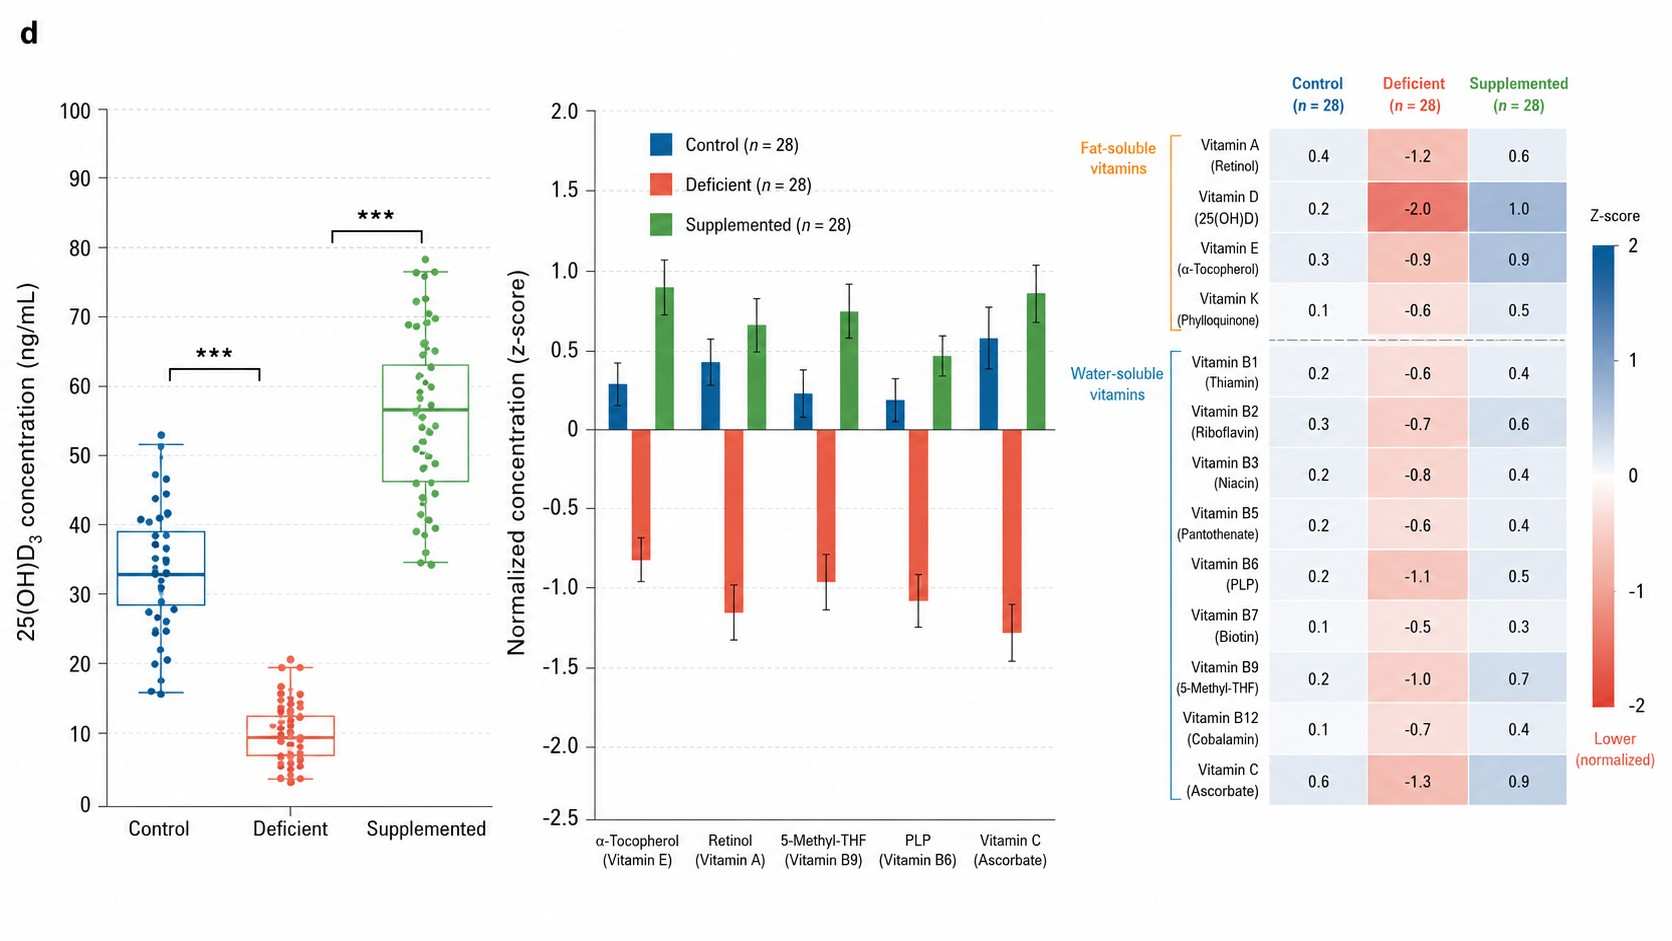
- Optional Statistical Analysis — Group comparisons (t-test/ANOVA, FDR, volcano/box plots), PCA/PLS-DA, pathway mapping, publication-ready figures (300 DPI TIFF + vector PDF/AI).
Vitamins Analysis Data — Chromatograms, Calibration & Stability Reports
Case Study — How LC-MS/MS Vitamin D Metabolite Profiling Revealed Epimer-Specific Clinical Associations
3-epi-25-hydroxyvitamin D₃ is a significant, biologically inactive fraction of total 25(OH)D in infants and adults
Singh, R.J., Taylor, R.L., Reddy, G.S., & Grebe, S.K. | Journal of Clinical Endocrinology & Metabolism, 2006, 91, 3055-3061 | IF: 5.8
DOI: 10.1210/jc.2006-0088
The Challenge
For decades, total 25(OH)D was measured by immunoassay — a single number, assumed to represent the biologically active fraction. But LC-MS/MS revealed a hidden variable: 3-epi-25(OH)D3, a stereoisomer that co-elutes with 25(OH)D3 on standard chromatography and is indistinguishable by immunoassay. Nobody knew how much of "total 25(OH)D" was actually the inactive epimer — and whether this fraction varied by age, disease state, or assay method. The question could only be answered by an LC-MS/MS method capable of baseline-resolving the epimer from the active form.
The Results
Singh et al. developed an LC-MS/MS method using a chiral derivatization approach that achieved baseline separation of 3-epi-25(OH)D3 from 25(OH)D3. Applied to 200+ clinical samples, the findings were striking:
| Population |
3-epi-25(OH)D3 as % of Total 25(OH)D |
Clinical Implication |
| Infants (< 1 year) |
Up to 60% of total 25(OH)D |
Immunoassay-based "vitamin D deficiency" in infants may be artifact — the epimer is inactive but counted as total |
| Adults |
2-25% of total 25(OH)D |
Significant inter-individual variation — some adults have 1/4 of their "total vitamin D" as inactive epimer |
| Pregnancy (3rd trimester) |
Elevated vs. non-pregnant |
Placental epimerase activity produces 3-epi-25(OH)D3 — maternal total 25(OH)D overestimates fetal vitamin D exposure |
Why It Matters
This study transformed vitamin D testing. Immunoassays and non-resolving LC-MS methods were systematically overestimating biologically active vitamin D — especially in the populations (infants, pregnant women) where accurate assessment matters most. Today, any credible vitamin D assay must report the epimer separately. This is why our panel includes chromatographic resolution of 3-epi-25(OH)D3 — not as an optional add-on, but as a standard component of vitamin D quantification.
What This Means for You
If your study measures vitamin D status — whether in a nutritional intervention, a pregnancy cohort, a pediatric population, or a pharmacodynamic trial — the epimer question matters. Without chromatographic resolution, your "total 25(OH)D" may include 5-60% inactive epimer. Our panel quantifies the epimer separately, giving you the biologically active fraction — the number that actually correlates with calcium homeostasis, immune function, and clinical outcomes.
How We Deliver the Same
- Chiral resolution of 3-epi-25(OH)D3 from 25(OH)D3 on every sample — not a separate add-on
- d6-25(OH)D3 internal standard for absolute quantification of both epimer and active form
- 1,25(OH)2D included in the panel for those needing the active hormone alongside the storage form
- Same SCIEX QTRAP 6500+ platform used in the reference laboratory that first validated clinical LC-MS/MS vitamin D testing
Reference
- Singh, R.J., Taylor, R.L., Reddy, G.S., & Grebe, S.K. 3-epi-25-hydroxyvitamin D3 is a significant, biologically inactive fraction of total 25(OH)D in infants and adults. Journal of Clinical Endocrinology & Metabolism 91, 3055-3061 (2006).
Selected Publications in Vitamin Analysis
3-epi-25-hydroxyvitamin D3 is a significant, biologically inactive fraction of total 25(OH)D in infants and adults
Singh, R.J., Taylor, R.L., Reddy, G.S., & Grebe, S.K.
Journal: Journal of Clinical Endocrinology & Metabolism
Year: 2006
DOI: https://doi.org/10.1210/jc.2006-0088
Vitamin D assays: past and present debates, difficulties, and developments
Fraser, W.D., Tang, J.C., Dutton, J.J., & Schoenmakers, I.
Journal: Calcified Tissue International
Year: 2013
DOI: https://doi.org/10.1007/s00223-012-9694-2
Challenges of folate species analysis in food and biological matrices by LC-MS/MS
Strandler, H.S., Patring, J., Jagerstad, M., & Jastrebova, J.
Journal: Bioanalysis
Year: 2015
DOI: https://doi.org/10.4155/bio.15.69
Plasma acylcarnitine profiling indicates mitochondrial dysfunction in diabetes
Adams, S.H., Hoppel, C.L., Lok, K.H., et al.
Journal: Journal of Nutrition
Year: 2009
DOI: https://doi.org/10.3945/jn.108.103895
Quantification of 25-hydroxyvitamin D2 and D3 in serum using LC-MS/MS
van den Ouweland, J.M., Vogeser, M., & Bacher, S.
Journal: Clinical Chemistry and Laboratory Medicine
Year: 2013
DOI: https://doi.org/10.1515/cclm-2013-0026
Identification and quantitation of carotenoids and tocopherols in human plasma by LC-MS
Fang, L., Pajkovic, N., Wang, Y., Gu, C., & van Breemen, R.B.
Journal: Analytical Chemistry
Year: 2013
DOI: https://doi.org/10.1021/ac301288h
Advances and challenges in sample preparation for water-soluble vitamins: Application in food, clinical, pharmaceutical samples
Zhang, Y., et al.
Journal: Journal of Pharmaceutical and Biomedical Analysis
Year: 2025
DOI: https://doi.org/10.1016/j.jpba.2025.116750
Vitamin B12 deficiency: clinical, biochemical, and analytical perspectives
Herrmann, W. & Obeid, R.
Journal: Nature Reviews Endocrinology
Year: 2013
DOI: https://doi.org/10.1038/nrendo.2013.46