Why Measure Glycan Metabolism?
Glycosylation is tightly regulated by metabolic input—not just enzyme activity. Key pathways like the Hexosamine Biosynthesis Pathway (HBP) integrate glucose, glutamine, acetyl-CoA, and UTP to produce UDP-GlcNAc, the essential donor for O-GlcNAcylation and N-glycan branching. Elevated HBP activity is a hallmark of metabolic reprogramming in cancer and immune activation.
Likewise, levels of CMP-Sialic Acid directly control the cell's capacity for sialylation, a key modification in immune evasion and metastasis. These and other nucleotide sugars function as metabolic checkpoints that link nutrient availability to glycan output.
Quantifying these intermediates provides a sensitive, upstream, and mechanistic view of glycosylation changes, often revealing biological shifts earlier than structural glycan profiling.
What We Quantify: High-Coverage, Targeted Panels for Glycan Metabolism
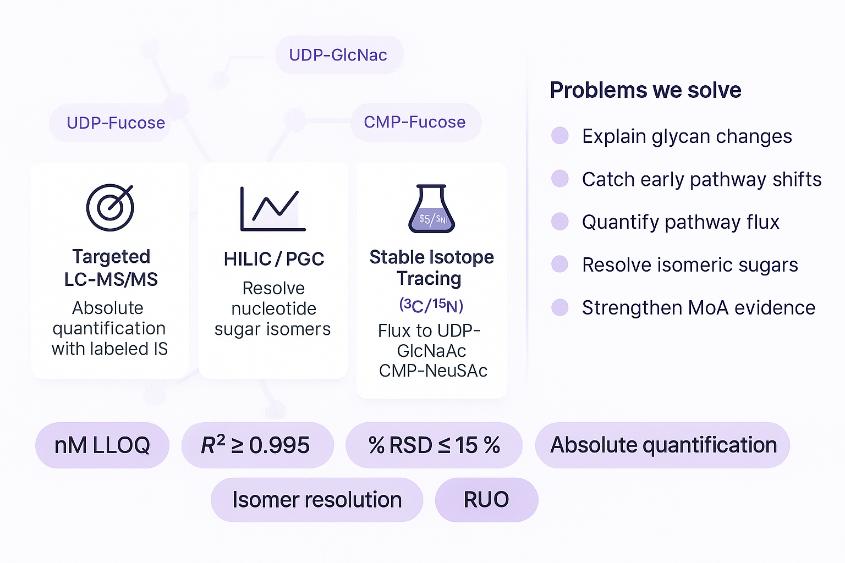
Creative Proteomics offers curated, LC-MS/MS–based panels targeting key metabolites across glycan biosynthesis and nucleotide sugar metabolism. These panels are designed to quantify metabolic inputs relevant to N- and O-glycosylation, sialylation, fucosylation, and glycosaminoglycan (GAG) biosynthesis.
Our platform targets nucleotide sugars, pathway intermediates, and metabolic cofactors—ensuring decision-ready data for mechanistic studies, disease models, and drug development.
Representative Metabolites in Glycan Biosynthesis Pathways
| Pathway |
Representative Metabolites |
| Hexosamine Biosynthesis & Core Precursors |
Glucose-6-phosphate, Fructose-6-phosphate, Glucosamine-6-phosphate, GlcNAc-6-phosphate, GlcNAc-1-phosphate, UDP-GlcNAc, UDP-GalNAc, UDP-Glucose, UDP-Galactose |
| Sialic Acid Pathway |
ManNAc, ManNAc-6-phosphate, Neu5Ac (Sialic Acid), CMP-Neu5Ac (CMP-Sialic Acid) |
| Fucosylation Pathway |
GDP-Mannose, GDP-Fucose |
| GAG / GSL Precursors |
UDP-Glucuronic Acid (UDP-GlcA), UDP-Xylose; upstream indicators for Glycosaminoglycan Biosynthesis (including Chondroitin Sulfate / Dermatan Sulfate, Heparan Sulfate / Heparin, Keratan Sulfate) and Glycosphingolipid Biosynthesis (including Lacto and Neolacto Series, Globo and Isoglobo Series, Ganglio Series). |
| Nucleotide Cofactors |
ATP, UTP, CTP, GTP, Acetyl-CoA |
Custom panels are available. Please inquire if your project requires specific pathway branches or rare intermediates.
Pathway Flux Analysis: Measuring Metabolic Activity Through Isotope Tracing
To investigate not just metabolite abundance but how actively pathways are functioning, we support Stable Isotope Tracing (SIT) using 13C- or 15N-labeled substrates. This approach enables quantitative analysis of flux through glycan-related pathways by tracking label incorporation into downstream metabolites.
By analyzing the isotopic distribution of compounds such as UDP-GlcNAc, CMP-Neu5Ac, or other nucleotide sugars, researchers can assess de novo synthesis rates, substrate utilization, and pathway dynamics under different biological or experimental conditions.
What the Service Includes
- Experimental Setup Support
We assist in tracer selection, labeling duration, and sampling timing based on the turnover characteristics of your target pathway.
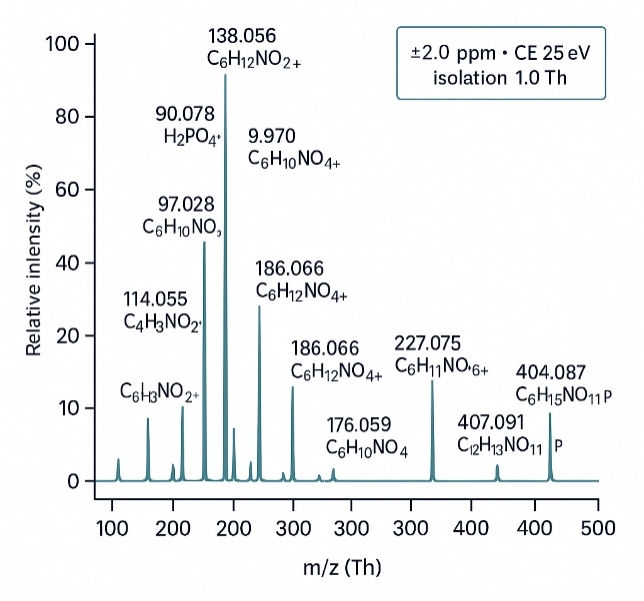
- Isotopologue Analysis via High-Resolution LC-MS/MS
Orbitrap instrumentation allows precise quantification of labeled isotopologues across multiple metabolic intermediates.
- Data Interpretation and Reporting
Results include isotopologue distributions, labeling patterns, and fractional enrichment, which can be used to infer relative pathway activity or response to perturbation.
Why Choose Our Glycan Metabolism & Pathway Flux Analysis?
- Ultra-sensitive quantification — Detect nucleotide sugars and intermediates down to 0.5–10 nM.
- High linearity and recovery — Calibration R² ≥ 0.995, recovery 85–115%, ensuring true absolute values.
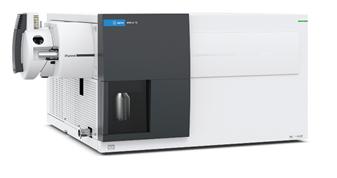
- Dual-instrument precision — Agilent 6495C QQQ for quantitation + Orbitrap HF-X for isotopologue flux analysis.
- Reproducible performance — Inter- and intra-batch CV ≤ 15% for confident multi-sample comparison.
- Flux-ready analytics — Quantify ¹³C/¹⁵N label incorporation to reveal real-time pathway activity.
- Matrix-validated methods — Optimized extraction and calibration for cells, tissues, and biofluids.
- Integrated interpretation — Deliverables include isotopologue distribution + KEGG-mapped pathway insights.
- Actionable biological insight— Translate metabolic data into clear evidence of glycosylation regulation.
Technology & Validation for Glycan Metabolite Quantification
Our glycan metabolism and flux analysis services are built on validated LC-MS/MS platforms with stringent quality control procedures. We apply a dual-instrument strategy optimized for both absolute quantification and isotopologue resolution:
- Agilent 6495C Triple Quadrupole (QQQ) in dynamic MRM mode is used for targeted quantification, offering excellent sensitivity and linearity across wide dynamic ranges.
- Thermo Q Exactive™ HF-X Hybrid Orbitrap is employed for high-resolution isotopologue detection and discovery-based analysis in flux studies.
- Specialized Chromatography: HILIC (amide-based) and Porous Graphitic Carbon (PGC) methods are selected based on analyte polarity and structural similarity, particularly for isomeric nucleotide sugars.
Method Performance and Quality Specifications
| Parameter |
Specification |
Notes |
| Sensitivity |
LLOQ as low as 0.5–10 nM (matrix-dependent) |
Enables measurement from low-input samples (e.g., primary cells, micro-dissected tissues) |
| Precision |
%RSD ≤ 15% (intra- and inter-batch) |
Supports reproducibility across large cohorts |
| Linearity |
R² ≥ 0.995 across 3–4 orders of magnitude |
Maintains accuracy from trace to abundant metabolites |
| Accuracy |
QC recovery within 85–115% |
Ensures reliability of reported concentrations |
Workflow for Quantitative Glycan Metabolism Analysis
Sample Requirements for Glycan Metabolism LC-MS/MS Analysis
| Sample Type |
Collection & Quench (Timing) |
Pre-Analytical Handling |
Minimum Amount |
Storage & Shipping |
| Cell Pellets |
Quench immediately (≤ 30 s) |
80% cold methanol quench or cold PBS wash → liquid-N₂ snap-freeze |
≥ 1×10⁶ cells |
Store –80 °C; ship on dry ice |
| Tissues |
Excise and snap-freeze < 10 s post-harvest |
Avoid thawing; trim excess blood; aliquot if large |
≥ 20 mg |
Store –80 °C; ship on dry ice |
| Plasma / Serum |
Separate from whole blood < 30 min |
Avoid hemolysis; aliquot to prevent repeat freeze–thaw |
≥ 100 µL |
Store –80 °C; ship on dry ice |
| Cell Culture Media |
Collect and clarify immediately |
Spin at 4 °C to remove debris; snap-freeze supernatant |
≥ 200 µL |
Store –80 °C; ship on dry ice |
Notes: Use low-bind tubes; keep materials pre-chilled; record time-to-quench; label with Project/Sample ID & date; provide normalization data (preferred: protein by BCA; alternatives: cell count or tissue weight). For SIT, include tracer type, enrichment, and labeling duration.
What You Receive: Deliverables from Our Glycan Metabolism Analysis
- Quantitative concentration table: All analytes, sample IDs, final units (μM or nmol/mg protein).
- Full QC report: L/M/H QCs, calibration (R²), %RSD, accuracy, retention time windows, and acceptance criteria.
- Flux analysis report (if applicable): Isotopologue distributions, fractional enrichment, and pathway-specific flux visuals.
- Methodology summary: A "Materials & Methods" section ready for manuscripts and regulatory documentation.
- Raw data on request: .raw or .mzML files for archival and independent review.
Research Applications of Glycan Metabolism Quantification
UDP-Glucose/P2Y14 Receptor Signaling Exacerbates Neuronal Apoptosis After Subarachnoid Hemorrhage in Rats
Kanamaru, H., Zhu, S., Dong, S., Takemoto, Y., Huang, L., Sherchan, P., … & Zhang, J. H.
Stroke
Year: 2024
Alternative glycosylation controls endoplasmic reticulum dynamics and tubular extension in mammalian cells
Kerselidou, D., Dohai, B. S., Nelson, D. R., Daakour, S., De Cock, N., Hassoun, Z. A. O., … & Twizere, J. C.
Science Advances
Year: 2021
Identification of the O-Glycan Epitope Targeted by the Anti-Human Carcinoma Monoclonal Antibody (mAb) NEO-201
Tsang, K. Y., Fantini, M., Zaki, A., Mavroukakis, S. A., Morelli, M. P., Annunziata, C. M., & Arlen, P. M.
Cancers
Year: 2022
Modulation of the Endomembrane System by the Anticancer Natural Product Superstolide/ZJ-101
Sanchez, P. R., Head, S. A., Qian, S., Qiu, H., Roy, A., Jin, Z., … & Liu, J. O.
International Journal of Molecular Sciences
Year: 2023
Glucosylceramide is essential for Heartland and Dabie bandavirus glycoprotein-induced membrane fusion
Xia, T., Wu, X., Hong, E., Jung, K., Lai, C. J., Kwak, M. J., … & Jung, J. U.
PLOS Pathogens
Year: 2023
Effects of microbial phytase on mucin synthesis, gastric protein hydrolysis, and degradation of phytate along the gastrointestinal tract of growing pigs
Mesina, V. G., Lagos, L. V., Sulabo, R. C., Walk, C. L., & Stein, H. H.
Journal of Animal Science
Year: 2019