Urea Cycle Metabolite Panel — 10 Analytes with Pathway Ratios
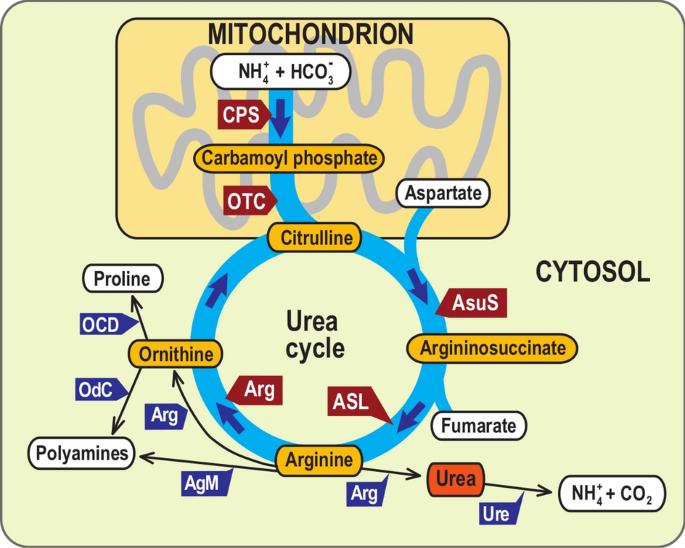
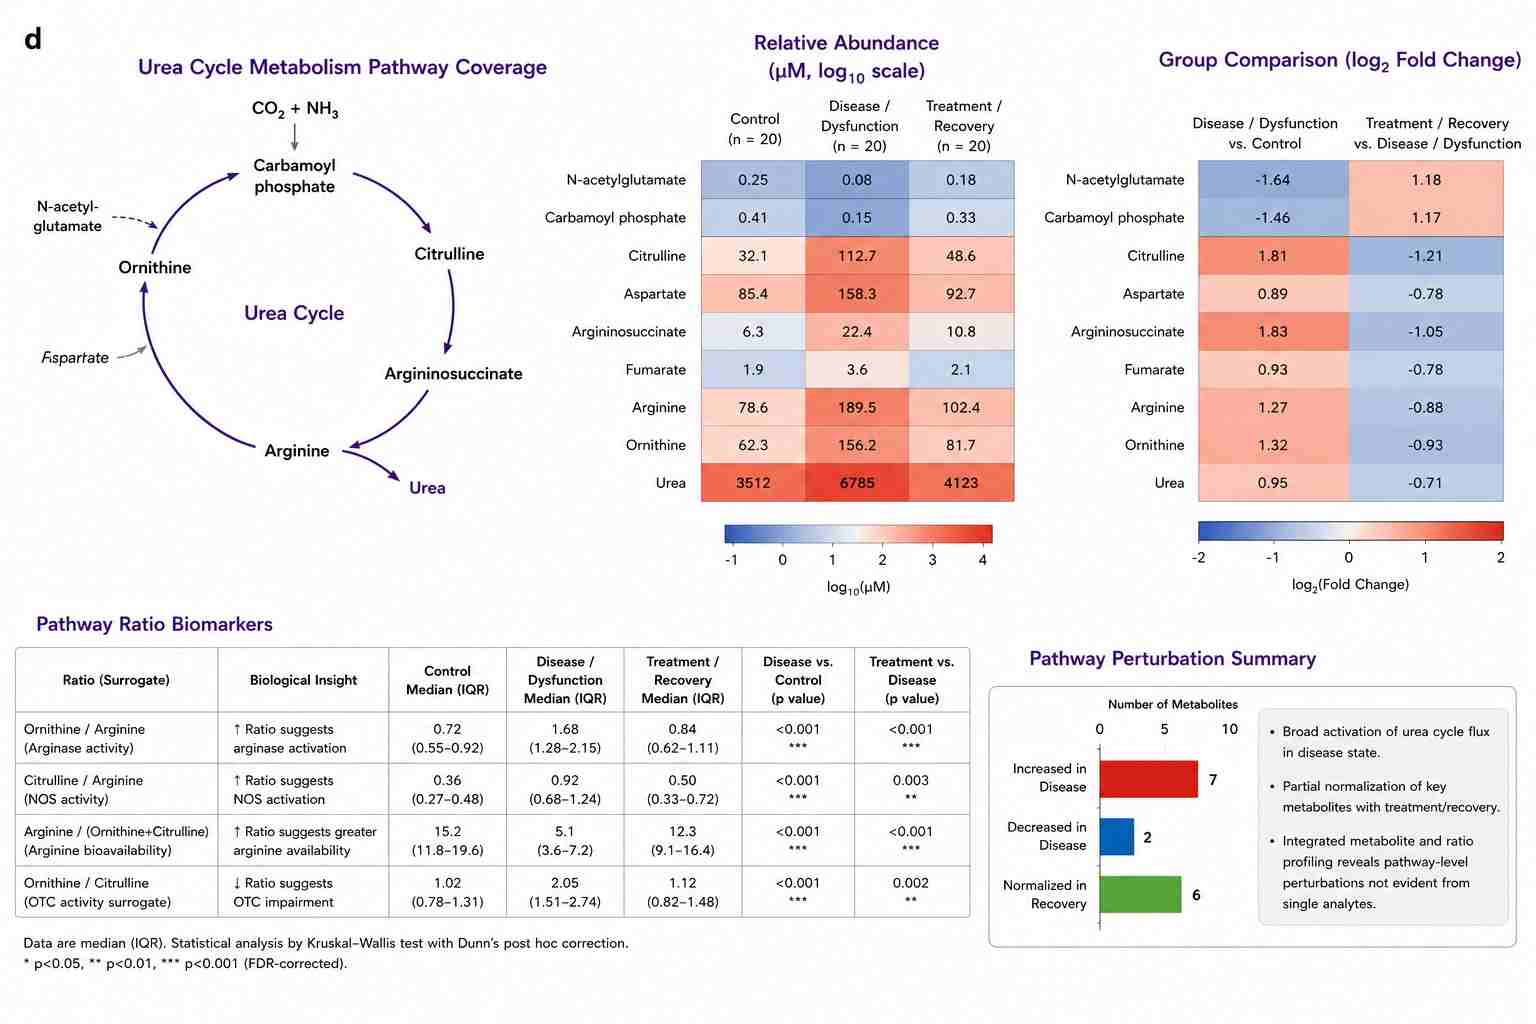
Each metabolite is quantified against its own stable isotope internal standard using HILIC chromatography on a SCIEX QTRAP 6500+. The panel covers the full urea cycle from mitochondrial carbamoyl phosphate synthesis through cytosolic arginine hydrolysis, plus the aspartate-arginosuccinate shunt and N-acetylglutamate allosteric regulator.
| Metabolite |
Location in Pathway |
Key Ratio & Biological Significance |
| Ammonia (NH3/NH4+) |
Substrate (mitochondrial) |
Primary nitrogen source for carbamoyl phosphate synthesis. Elevated plasma ammonia is the hallmark of urea cycle dysfunction. Requires immediate plasma separation and freezing — ammonia rises ex vivo within minutes at room temperature. Reported as ammonium ion concentration. |
| Carbamoyl Phosphate |
Intermediate (mitochondrial) |
Formed by carbamoyl phosphate synthetase I (CPSI) from ammonia + bicarbonate, allosterically activated by N-acetylglutamate. Low carbamoyl phosphate with elevated ammonia suggests reduced CPSI or NAG synthase activity. Highly labile — requires rapid quenching. |
| Citrulline |
Intermediate (mitochondrial → cytosolic) |
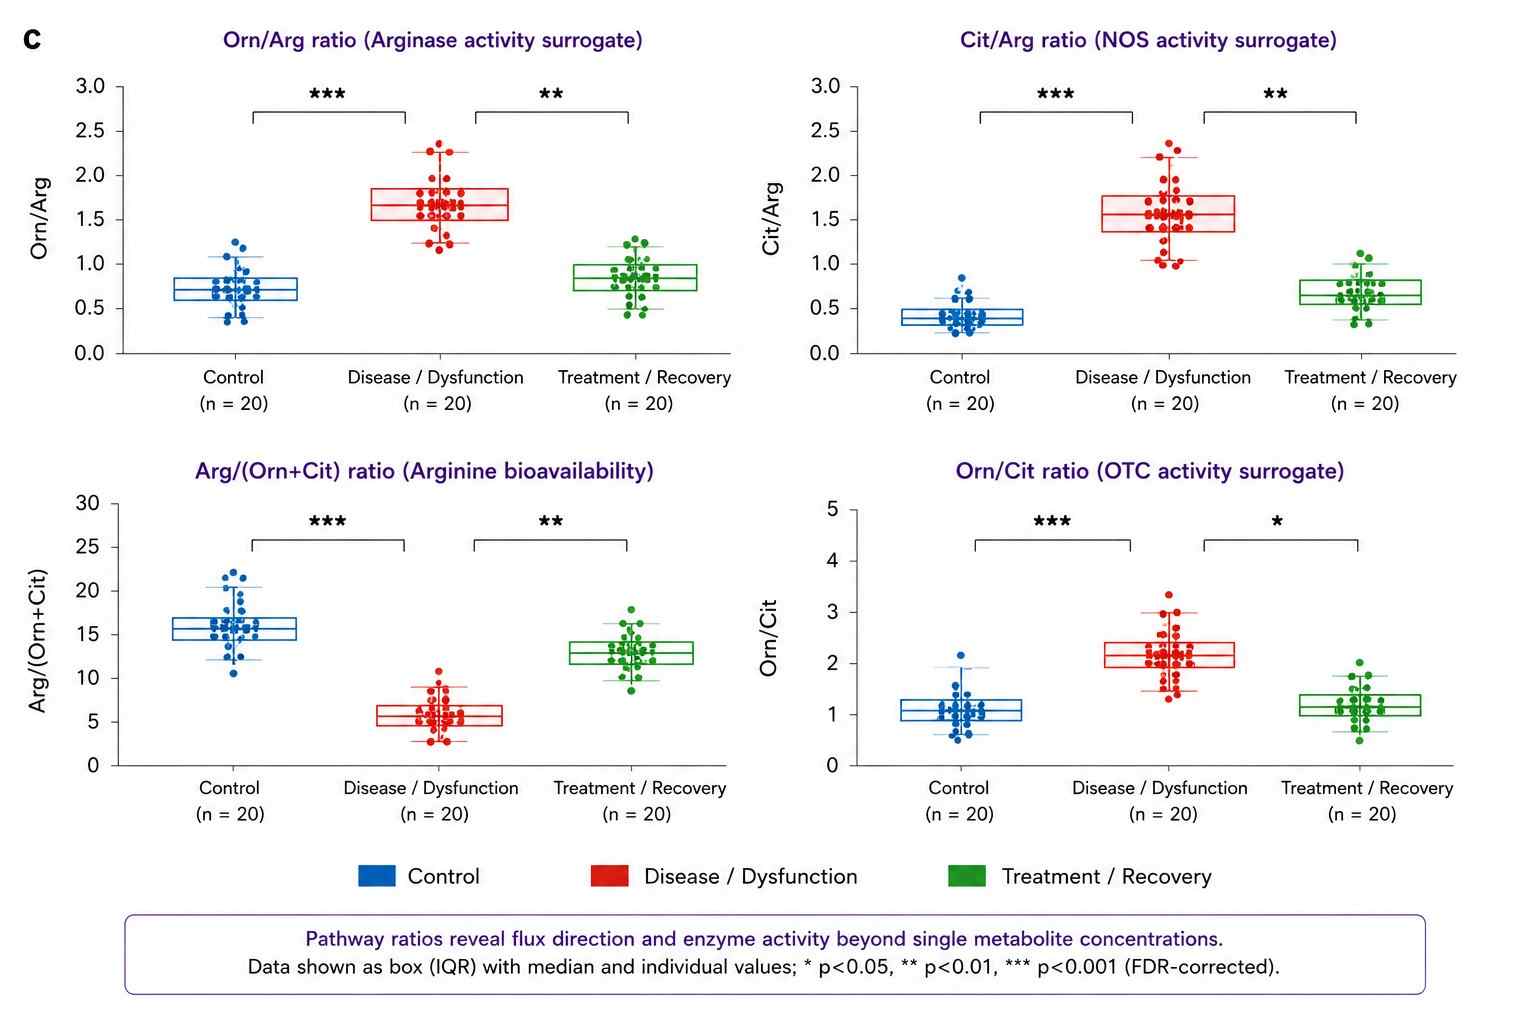
Cit/Arg ratio — surrogates nitric oxide synthase (NOS) activity, as citrulline is co-produced with NO from arginine. Also reflects ornithine transcarbamylase (OTC) activity; elevated citrulline with low arginine suggests reduced argininosuccinate synthetase (ASS) activity. Plasma citrulline concentration reflects enterocyte mass and function. |
| Argininosuccinate |
Intermediate (cytosolic) |
Formed by ASS from citrulline + aspartate. Elevated argininosuccinate in plasma or urine is a specific indicator of reduced argininosuccinate lyase (ASL) activity. Normally present at very low concentrations in plasma (low uM) — requires high-sensitivity LC-MS/MS for reliable quantification. |
| Arginine |
Central metabolite (cytosolic) |
Arg/(Orn+Cit) ratio — global arginine bioavailability index. Low ratio indicates insufficient arginine for NOS and other arginine-utilizing enzymes. Arginine is the substrate for NOS (NO + citrulline), arginase (ornithine + urea), arginine decarboxylase (agmatine), and arginine:glycine amidinotransferase (guanidinoacetate). Arginase continues to consume arginine ex vivo in plasma unless inhibited. |
| Ornithine |
Intermediate (cytosolic → mitochondrial) |
Orn/Arg ratio — surrogates arginase activity. Elevated when arginase activity is increased, redirecting arginine toward ornithine and urea production. Orn/Cit ratio reflects ornithine transcarbamylase (OTC) activity — elevated in reduced OTC activity. Ornithine is also the substrate for polyamine synthesis (ornithine decarboxylase → putrescine). |
| Urea |
End product (cytosolic) |
Terminal product of the urea cycle, produced by arginase from arginine. Plasma urea reflects both urea cycle output and renal clearance. Urea is ubiquitous — environmental contamination from glassware, sweat, and laboratory surfaces requires careful blank subtraction. Reported as BUN-equivalent or molar concentration. |
| Aspartate |
Nitrogen donor (cytosolic) |
Second nitrogen source for the urea cycle — condenses with citrulline via ASS to form argininosuccinate. Aspartate availability can be rate-limiting for urea cycle flux. Links urea cycle to TCA cycle via oxaloacetate transamination. |
| N-Acetylglutamate (NAG) |
Allosteric activator (mitochondrial) |
Essential allosteric activator of CPSI. Without NAG, CPSI is inactive regardless of ammonia concentration. reduced NAG synthase activity produces functional CPSI impairment with normal CPSI gene. NAG supplementation (carglumic acid) restores ureagenesis when NAGS activity is reduced. |
| Fumarate |
Byproduct (cytosolic) |
Produced by ASL from argininosuccinate, linking the urea cycle to the TCA cycle. Fumarate feeds into the TCA cycle as a carbon source. Elevated fumarate with elevated argininosuccinate indicates reduced ASL activity. |
HILIC LC-MS/MS Platform & Method for Urea Cycle Metabolite Quantification
LC-MS/MS Platform
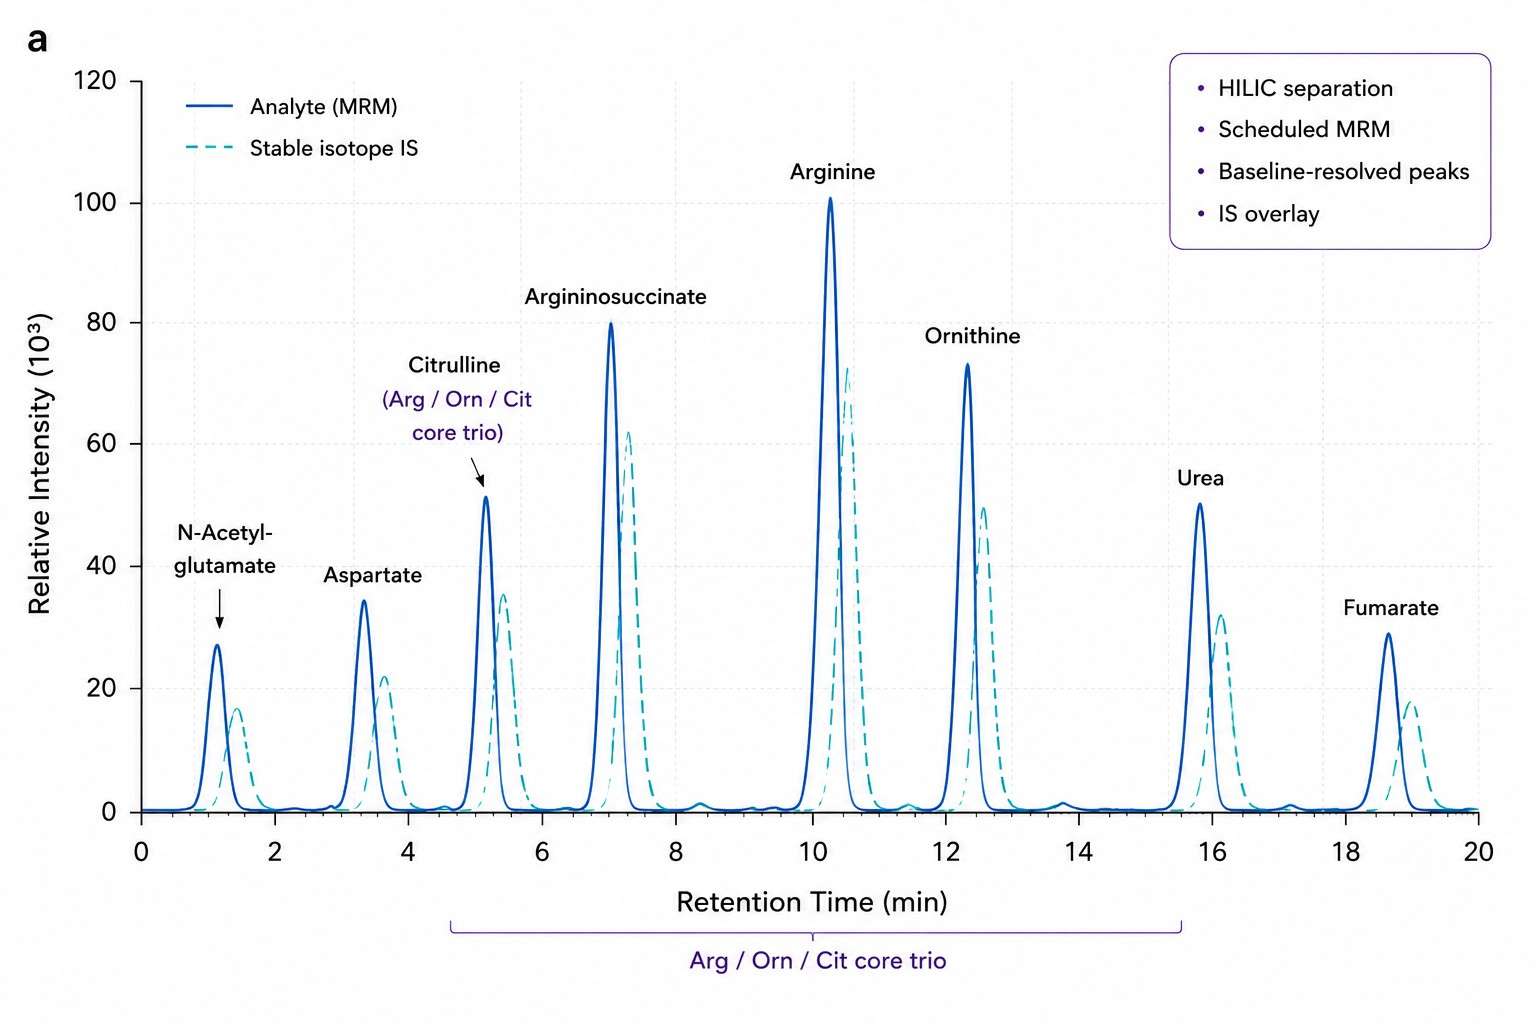
SCIEX QTRAP 6500+ with scheduled MRM acquisition. HILIC chromatography (Waters XBridge BEH Amide, 2.1 × 100 mm, 3.5 um) for retention of polar urea cycle intermediates. Stable isotope internal standards for 7 analytes: d4-citrulline, d7-arginine, d6-ornithine, 13C4-15N2-argininosuccinate, 13C-15N-urea, d3-aspartate, d4-fumarate. Quantification by stable isotope dilution with 6-8 point calibration.
Ammonia measured by a separate enzymatic assay (glutamate dehydrogenase) on the same plasma sample due to its volatility and ubiquitous environmental contamination. Carbamoyl phosphate is chemically unstable — detected as its degradation product (cyanate → carbamate) with rapid quenching protocol.
Method Performance
| Parameter |
Specification |
| LOD |
0.01-0.5 uM (analyte-dependent); Arg: 0.05 uM, Cit: 0.05 uM, ASA: 0.01 uM, Orn: 0.1 uM |
| Linear Range |
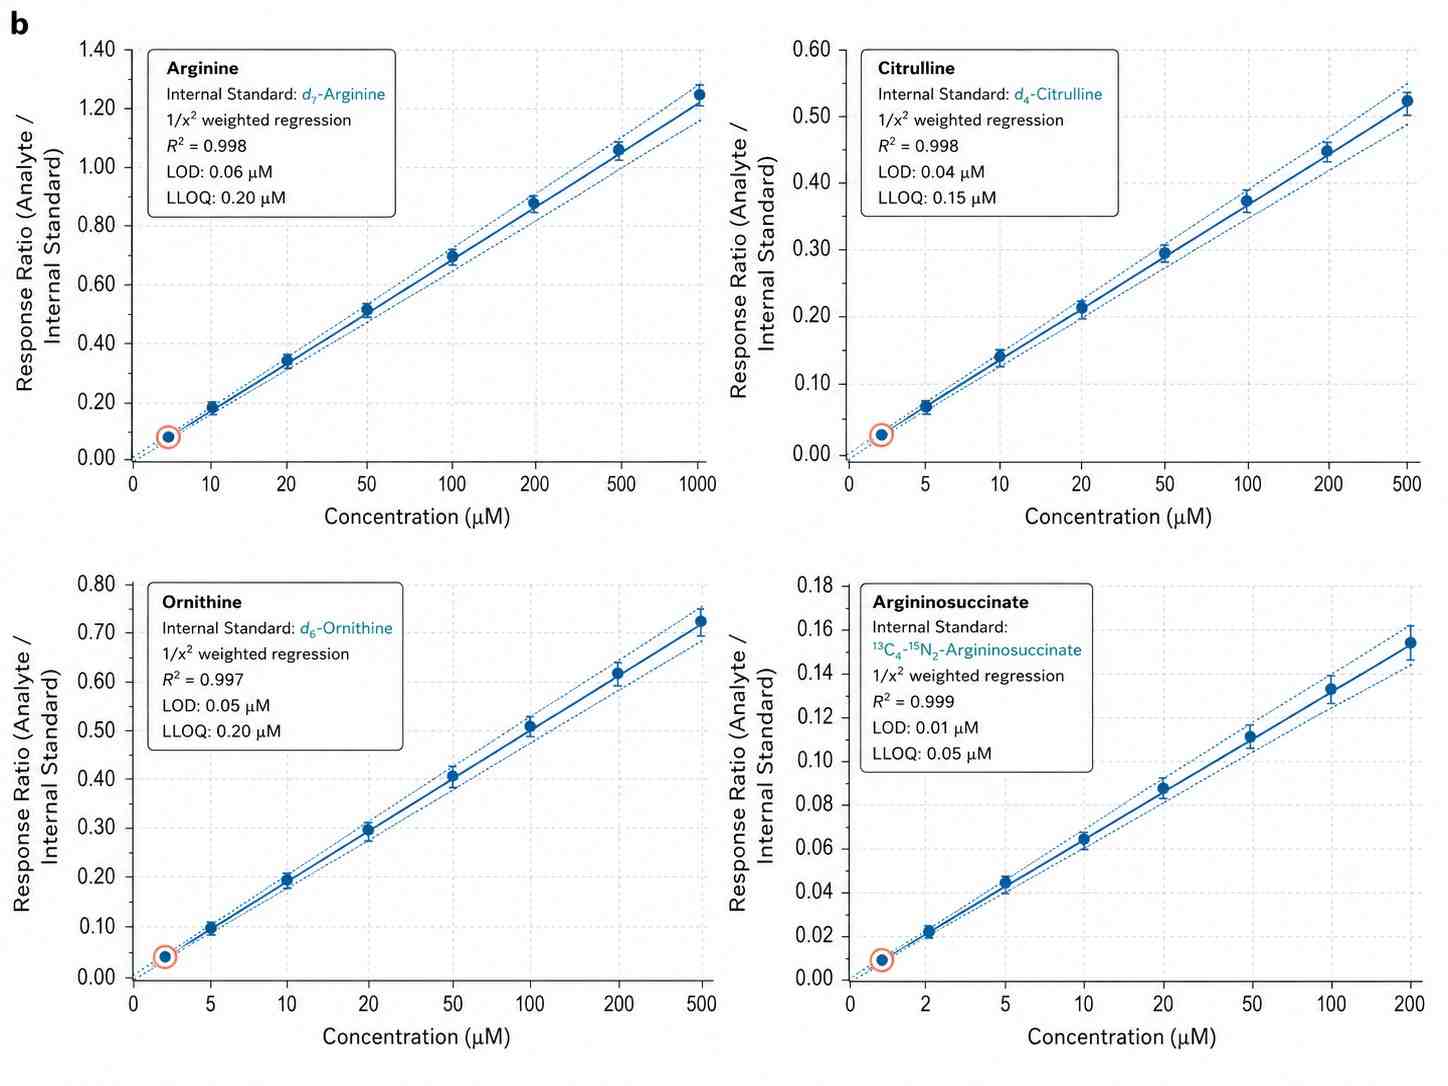
0.05-500 uM (4 orders of magnitude); R2 above or equal to 0.995 per analyte |
| Quantification |
Absolute — stable isotope dilution with 6-8 point calibration, 1/x2 weighted regression |
| Precision (CV) |
Intra-batch: below 5% (Arg, Orn, Cit), below 10% (ASA, NAG). Inter-batch: below 15% |
| Spike Recovery |
85-115% at low/mid/high QC levels |
Urea Cycle Metabolite Analysis Workflow — From Stabilized Collection to Pathway Ratios
Sample Types & Collection for Urea Cycle Analysis
| Sample Type |
Minimum Amount |
Critical Handling |
Storage & Shipping |
| Plasma (EDTA) |
100-200 uL |
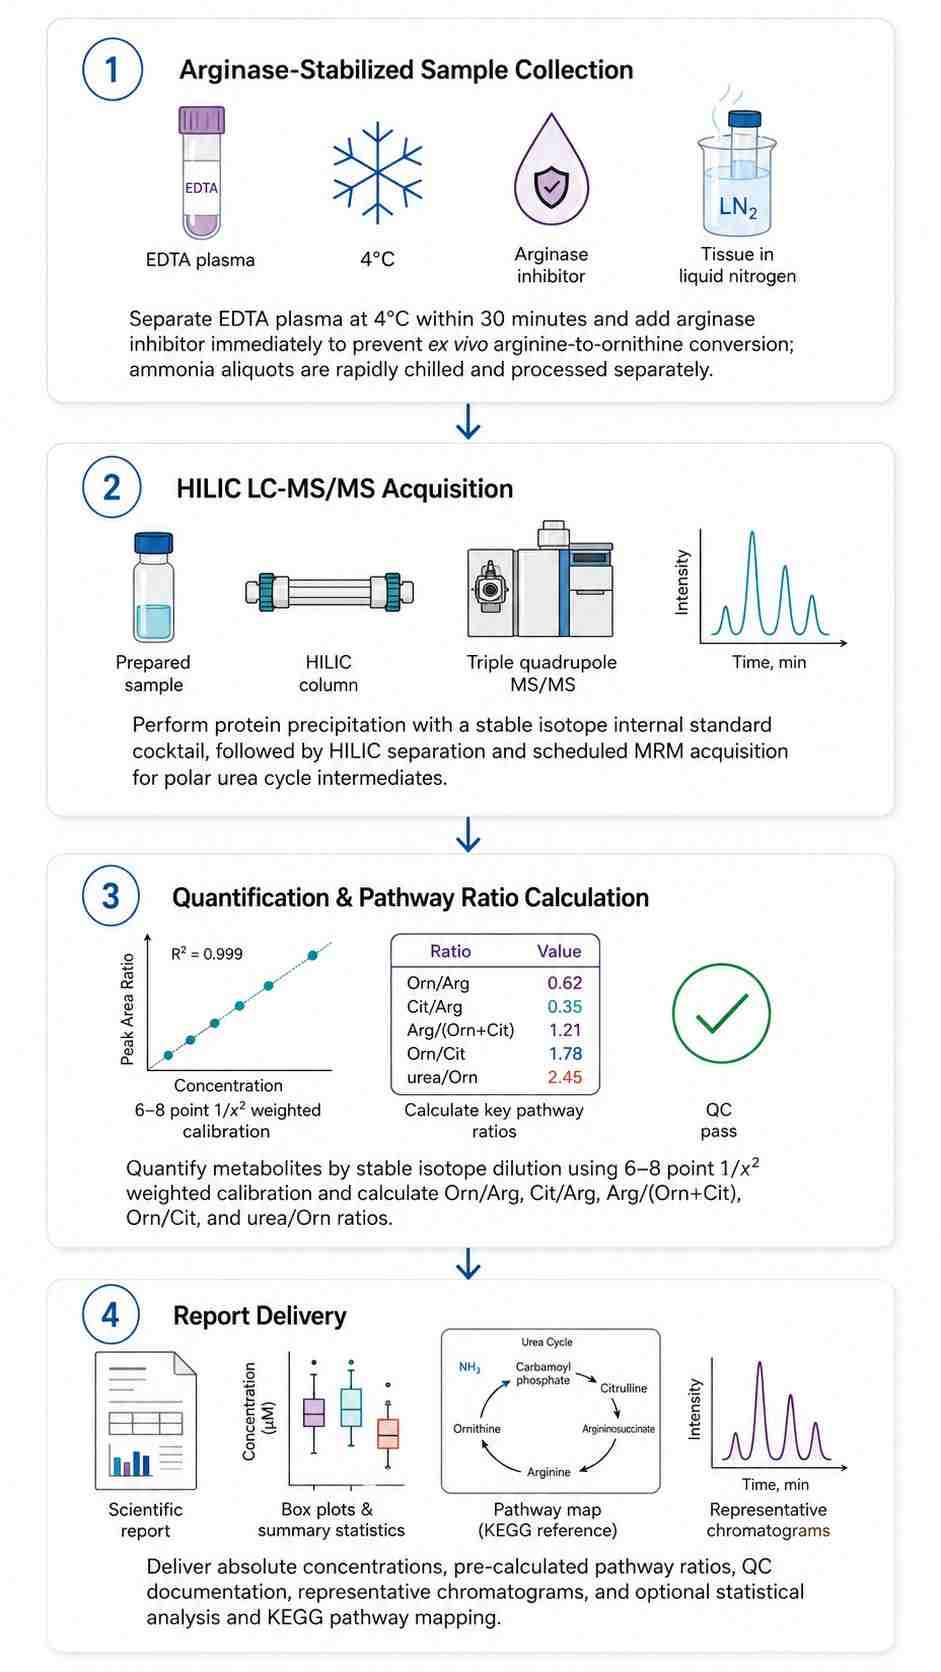
EDTA only — no heparin (interferes with arginase inhibitor). Centrifuge within 30 min at 1,500 x g, 4 degree C. Add arginase inhibitor immediately after separation. Record time from collection to freezing. |
-80 degree C; dry ice |
| Plasma (Ammonia) |
100-200 uL (separate aliquot) |
Pre-chilled EDTA tube on ice. Separate plasma within 15 min at 4 degree C. Assay or flash-freeze immediately. Ammonia rises 0.5-1 uM/min at room temperature ex vivo. |
-80 degree C or assay within 1 h |
| Serum |
200-300 uL |
Clot at room temp 30 min. Centrifuge at 1,500 x g, 4 degree C. Serum arginine is 10-20% lower than plasma due to platelet arginase release during clotting — plasma is preferred for urea cycle studies. |
-80 degree C; dry ice |
| Urine |
0.5-1 mL |
Spot or 24 h collection. Record total volume. Urine amino acid profiles normalized to creatinine. Urine orotic acid (reduced OTC activity marker) and argininosuccinate (ASL activity indicator) track urea cycle enzyme activity. |
-80 degree C; dry ice |
| Tissue (Liver) |
30-50 mg |
Snap-freeze in liquid N2 within 30 s of dissection. Liver is the primary urea cycle organ — perfuse with ice-cold PBS before freezing to remove blood metabolites. |
-80 degree C; dry ice |
Applications of Urea Cycle Metabolite Analysis
Urea Cycle Analysis Deliverables
- Quantitative Concentration Table — Absolute concentrations (uM for plasma, nmol/g for tissue) for all 10 metabolites per sample. Excel and CSV. LOD/LLOQ flags and IS recovery per sample.
- Pre-Calculated Pathway Ratios — Orn/Arg, Cit/Arg, Arg/(Orn+Cit), Orn/Cit, urea/Orn per sample. Ratio reference ranges from literature provided for context.
- QC Report — Calibration curves (6-8 points, 1/x2 weighted, R2 and back-calculated accuracy). Pooled QC RSD. IS recovery (80-120%). Blank carryover. Ammonia stability documentation.
- Methods Documentation — Complete LC-MS/MS parameters, arginase inhibitor protocol, data processing settings. Formatted for manuscript methods section.
- Optional Statistical Analysis — Group comparisons (t-test/ANOVA, FDR, volcano/box plots), PCA/PLS-DA, KEGG urea cycle pathway maps with metabolite fold-change coloring, publication-ready figures.
Urea Cycle Analysis Data — Chromatograms, Pathway Maps & Ratio Reports
Case Study — Urea Cycle Metabolite Profiling Links SLC7A2 Expression to Neuroinflammation in Huntington's Disease
Elevated SLC7A2 expression is associated with an abnormal neuroinflammatory response and nitrosative stress in Huntington's disease
Gaudet, I.D., Xu, H., Gordon, E., Cannestro, G.A., Lu, M.L., & Wei, J. | Journal of Neuroinflammation, 2024, 21, 59 | IF: 9.3
DOI: 10.1186/s12974-024-03038-2
The Challenge
SLC7A2 encodes the cationic amino acid transporter (CAT2) that imports arginine into cells — the rate-limiting substrate for both nitric oxide synthase (NOS) and arginase. In neuroinflammation, arginine metabolism is rewired: activated microglia upregulate arginase and iNOS, competing for the same arginine pool. The question was whether SLC7A2 overexpression in Huntington's disease drives neuroinflammatory arginine flux toward neurotoxic NO production. Answering this required simultaneous quantification of arginine, ornithine, citrulline, and urea in cell pellets — a urea cycle panel — to track which arm of arginine metabolism was activated.
The Results
Cell pellets from SLC7A2-overexpressing and control cells were analyzed by LC-MRM/MS on a SCIEX QTRAP 6500 Plus — the same platform we use. The urea cycle panel revealed a clear metabolic signature that a single-analyte measurement would have missed:
The urea cycle panel revealed a clear metabolic signature: elevated arginine uptake via SLC7A2 was channeled primarily into the NOS pathway — the Cit/Arg ratio increased significantly, while the Orn/Arg ratio remained stable. This pattern — elevated Cit/Arg with stable Orn/Arg — is the biochemical signature of NOS-selective arginine channeling, confirming that SLC7A2-driven arginine influx specifically fuels NO-mediated nitrosative stress rather than urea cycle flux. A single arginine concentration measurement would have only shown "arginine went up" without answering the critical mechanistic question: which downstream pathway consumed it?
Why It Matters
Without the urea cycle panel, the researchers would have seen "arginine levels changed" and stopped there. The ratios — Cit/Arg (NOS activity) vs. Orn/Arg (arginase activity) — revealed which downstream pathway was consuming the arginine, transforming a static concentration change into a mechanistic finding.
What This Means for You
If your experiment involves arginine metabolism — whether studying NOS biology, arginase regulation, polyamine synthesis, or any condition where arginine is a key substrate — a single arginine measurement is insufficient. The ratios tell you where the flux is going. Our panel delivers the same analytical framework used in this study: all urea cycle intermediates quantified in one HILIC LC-MS/MS injection, all ratios pre-calculated, same SCIEX QTRAP 6500+ platform.
How We Deliver the Same
- HILIC LC-MS/MS quantification of arginine, ornithine, citrulline, and urea with stable isotope IS — the same platform and method
- Pre-calculated Orn/Arg, Cit/Arg, and Arg/(Orn+Cit) ratios to distinguish NOS from arginase flux
- Validated for cell pellets, plasma, and tissue — the same matrices used in this study
Reference
- Gaudet, I.D., Xu, H., Gordon, E., Cannestro, G.A., Lu, M.L., & Wei, J. Elevated SLC7A2 expression is associated with an abnormal neuroinflammatory response and nitrosative stress in Huntington's disease. Journal of Neuroinflammation 21, 59 (2024).