What Pharmacometabolomics Measures
Pharmacometabolomics asks a question that pharmacokinetics alone cannot answer: given this individual's
metabolic state before the first dose, how will this individual handle the drug? Two individuals can receive
the same dose, reach similar plasma concentrations, and still diverge sharply in efficacy and toxicity.
Metabolic capacity frequently accounts for the divergence: how much cofactor is available, how active the
relevant enzymes are, how the gut microbiome processes the compound, and what competing substrates already
occupy the same pathways.
Our pharmacometabolomics service profiles both sides of that relationship. Drug-related analytes tell you
what the body did to the compound. Endogenous metabolites tell you what state the body was in when it did
so. Reported together, they allow a study to move from "this subject responded differently" to a testable
explanation grounded in measurable biochemistry — a level of resolution that supports patient stratification
in later development.
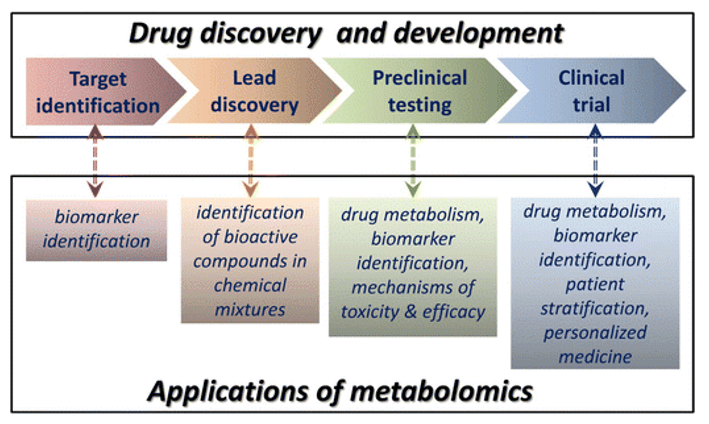
This platform is used at the stage where mechanism matters: candidate profiling before candidate selection,
preclinical safety interpretation, first-in-human study design, and translational work that needs to connect
exposure, metabolic phenotype, and response in the same dataset. Related capabilities across the development
timeline are covered in the metabolomics in drug development program, which follows the same analytes from
candidate profiling through first-in-human study design.
Two Data Layers From One Sample Set
Pharmacometabolomics studies usually fail for a logistical reason rather than a scientific one: the drug
data and the metabolomics data are generated by different laboratories, on different aliquots, with
different internal standards. The two datasets then cannot be aligned at the sample level, and the
correlation the study was designed to test becomes impossible to compute.
We extract once and acquire both layers from the same aliquot series, so every drug measurement and every
endogenous metabolite measurement carry the same sample identifier and the same preparation history. Where
metabolite identification has to go further than quantification, the same extracts feed drug metabolism analysis, which
resolves the structures behind the measured concentrations.
| Data Layer |
What We Quantify |
Analytical Approach |
Typical Output |
| Drug layer |
Parent drug and known metabolites — phase I oxidation and hydrolysis products, phase II
glucuronide, sulfate, glycine, and glutathione conjugates; drug-derived analogs detected from
high-resolution data |
Scheduled MRM on triple quadrupole for absolute quantification of the parent and targeted
metabolites; data-independent acquisition on high-resolution MS for unknown or unexpected
metabolites |
Concentrations per analyte per sample and per time point, with transition-level evidence for each
reported metabolite |
| Endogenous layer |
Metabolic phenotype: amino acids and their derivatives, biogenic amines, acylcarnitines, organic
acids, nucleotides and cofactors, bile acids, and lipids relevant to the drug's mechanism |
Targeted MRM panels for absolute quantification; untargeted high-resolution profiling for
pathway-level coverage and differential analysis |
Absolute concentrations for panel analytes plus relative abundance and fold-change data for the
untargeted set |
| Linked readout |
Baseline-versus-post-dose change, and the association between pre-dose metabolite levels and drug
exposure or response markers |
Per-subject pairing across time points with multivariate modeling and pathway-level enrichment
|
Response-association tables and pathway maps connecting the two layers at the subject level |
Why the Baseline Metabolic Phenotype Predicts Drug Response
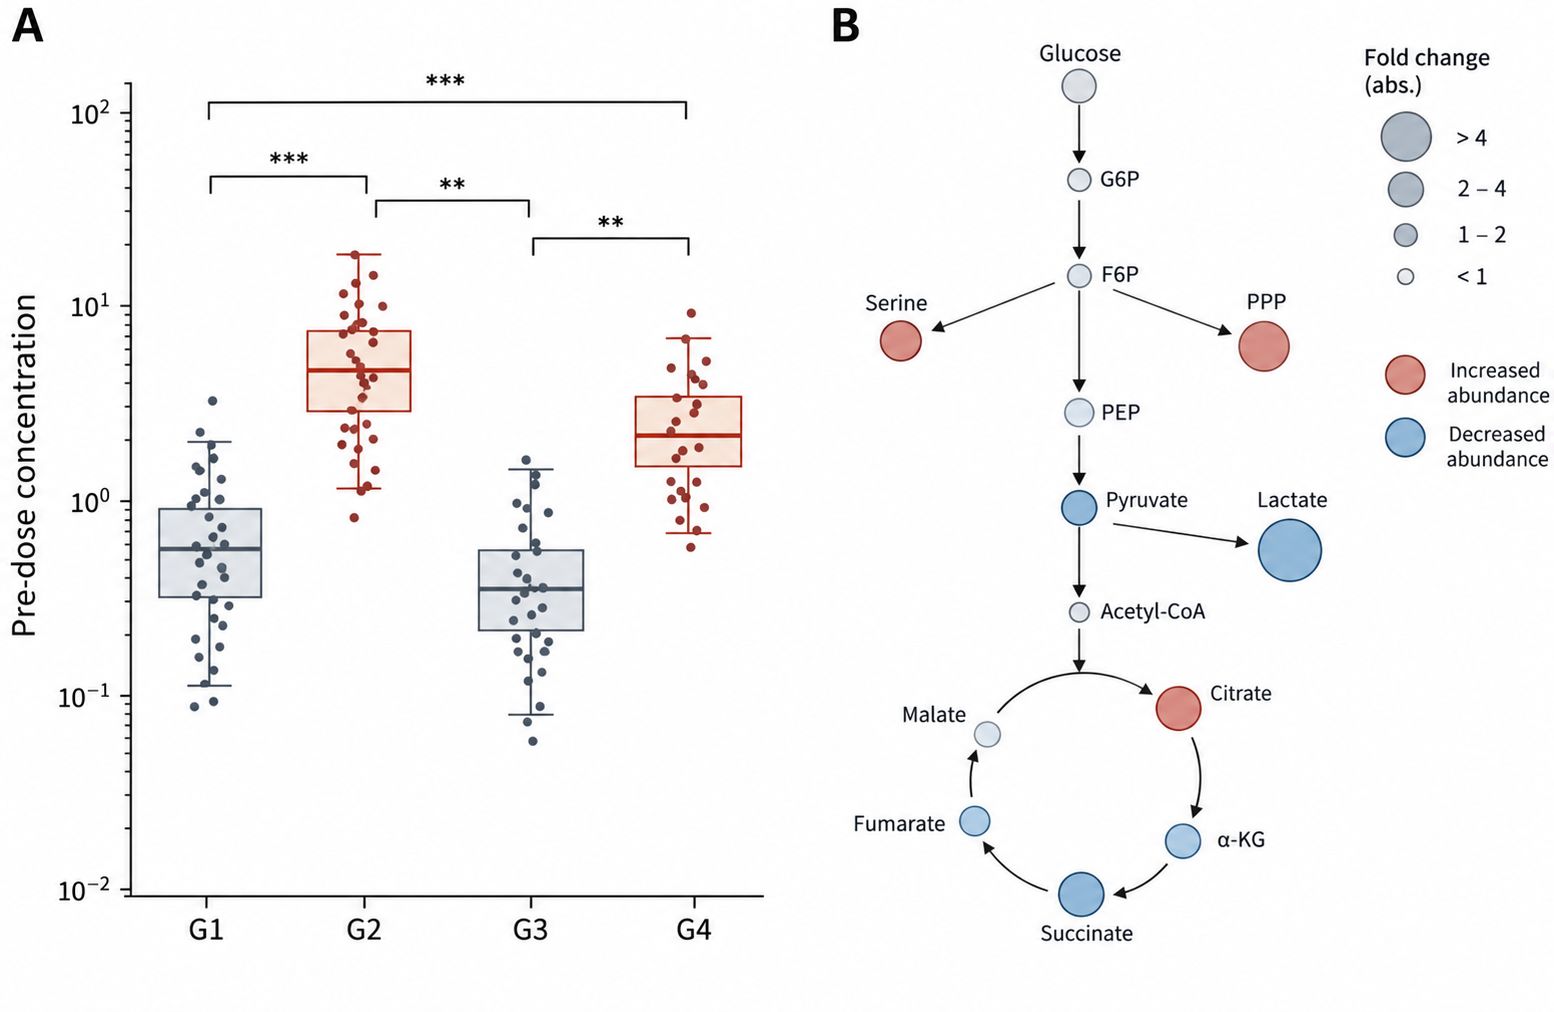
The information used for prediction is collected before the drug is given. A pre-dose sample already
carries measurable signals that determine how a compound will be handled: the abundance of cofactors such as
S-adenosylmethionine, folate species, and nicotinamide cofactors sets the ceiling on methylation, one-carbon
transfer, and redox-dependent activation reactions. Amino acid and acylcarnitine profiles reflect
mitochondrial and enzyme activity. Microbial metabolite patterns reflect a community that will chemically
modify the compound before the host even absorbs it.
Because these signals are quantitative and stable within an individual over short intervals, they can be
modeled against the response that follows. That is what makes the pre-dose sample the analytical center of a
pharmacometabolomics study rather than a convenience control.
- Enzyme and cofactor capacity — Cofactor pools and
pathway intermediates constrain how much of a substrate can be converted, activated, or detoxified,
which is why baseline profiles carry predictive weight that dose alone does not.
- Microbial contribution — Gut bacteria metabolize drugs
and produce metabolites that re-enter circulation. Capturing the microbial metabolite context requires
the endogenous layer, not a drug panel.
- Competing substrate load — Elevated endogenous
substrates competing for the same enzymes change effective clearance. Baseline profiling exposes this
competition before it appears as an unexplained outlier.
- Nutritional and physiological state — Fasting status,
diet-derived metabolites, and stress-related markers are all captured in the same acquisition, giving
the modeling step a richer covariate set at no extra sample cost.
Analytical Platform — Scheduled MRM Combined With High-Resolution MS
Dual-Platform Strategy
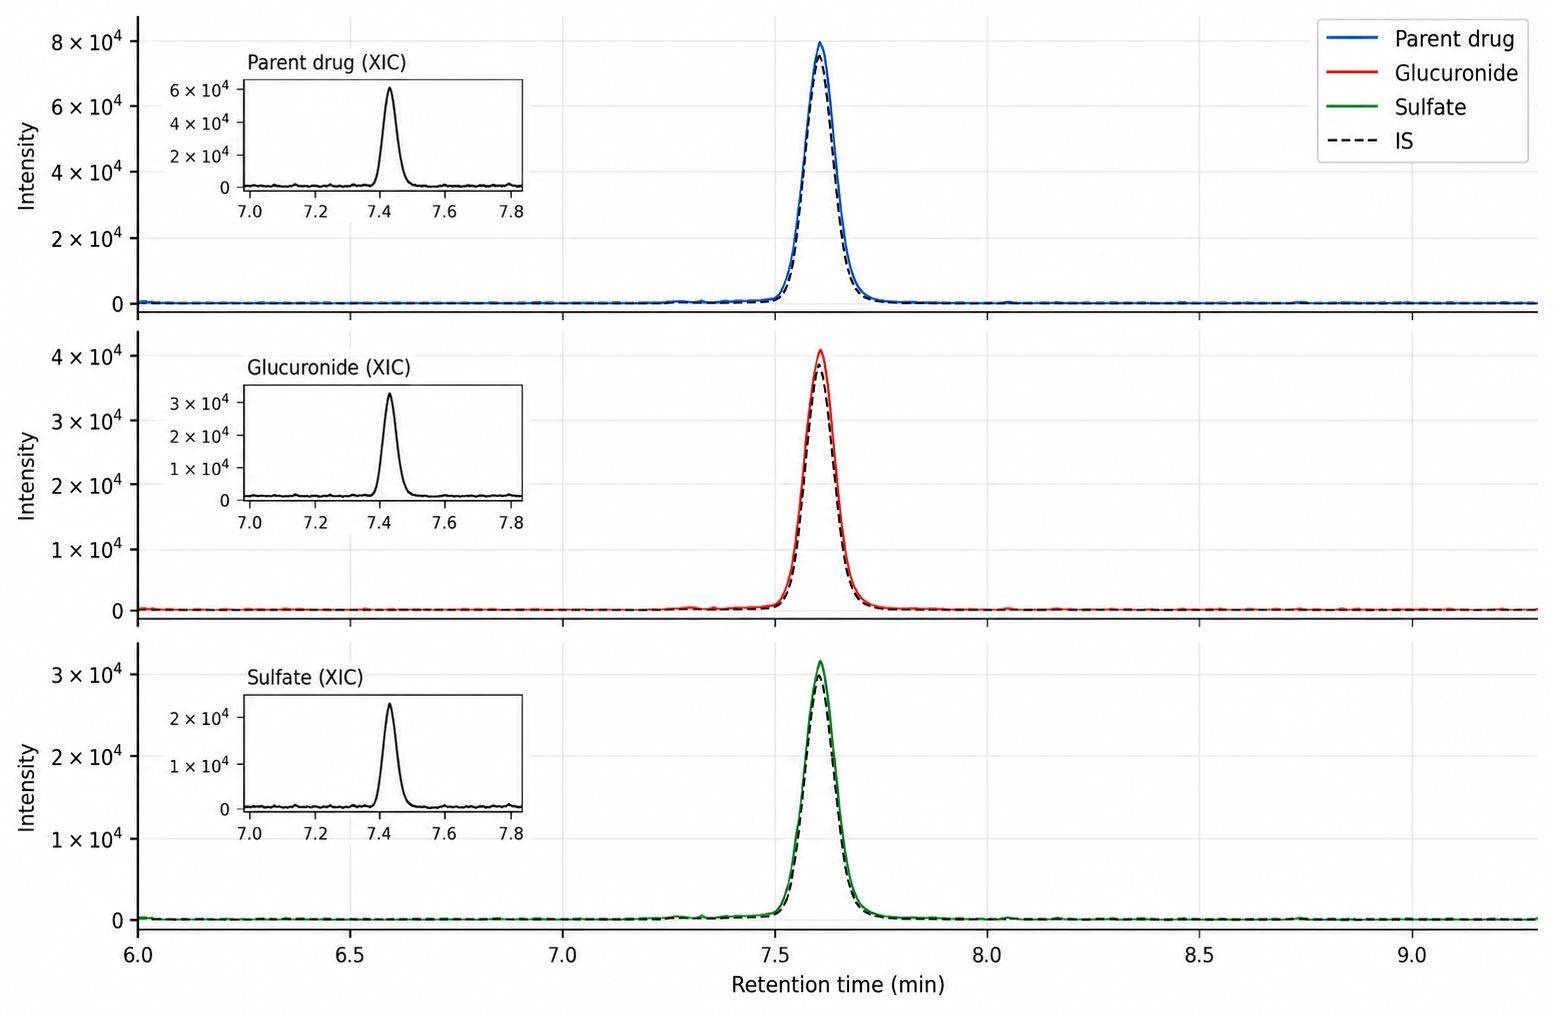
Absolute quantification runs on a SCIEX QTRAP 6500+ triple quadrupole using scheduled
MRM with two to three transitions per analyte and an isotope-labeled internal standard for every
reported compound. Where a stable-isotope standard does not exist, the nearest structurally appropriate
analog is used and the choice is stated in the report.
Unknown and unexpected metabolites are handled on a
Thermo Scientific Q Exactive Orbitrap and an AB SCIEX TripleTOF 5600
using data-independent acquisition and MS/MS fragmentation. High-resolution accurate mass supports
formula assignment, and neutral-loss and fragment-ion patterns support phase II conjugate assignment for
glucuronide, sulfate, and glutathione products. Volatile and thermally stable analytes are covered by
Agilent 7890B-5977A GC-MS, and chromatographic separation is developed on
Waters ACQUITY and Agilent 1290 Infinity II UPLC systems.
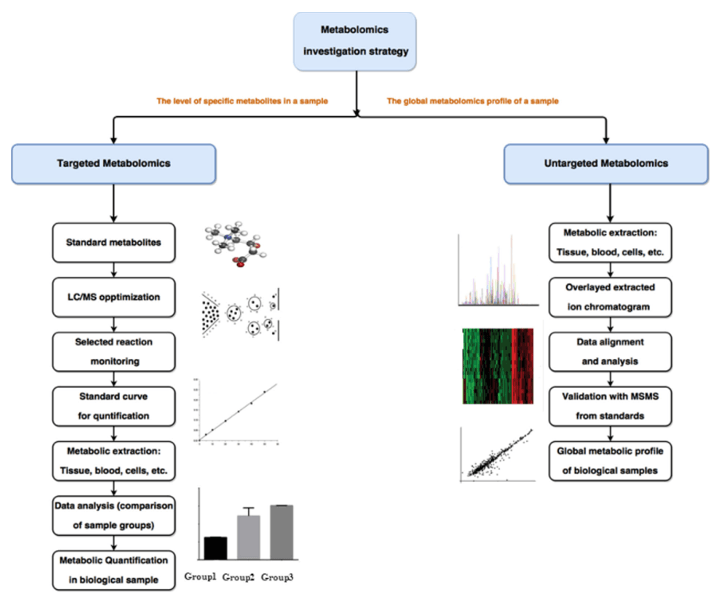
The same extract also supports untargeted metabolomics, and analytes that need a number rather than a
pattern are measured as targeted
metabolomics panels against authentic standards.
Method Performance
| Parameter |
Specification |
| Quantification |
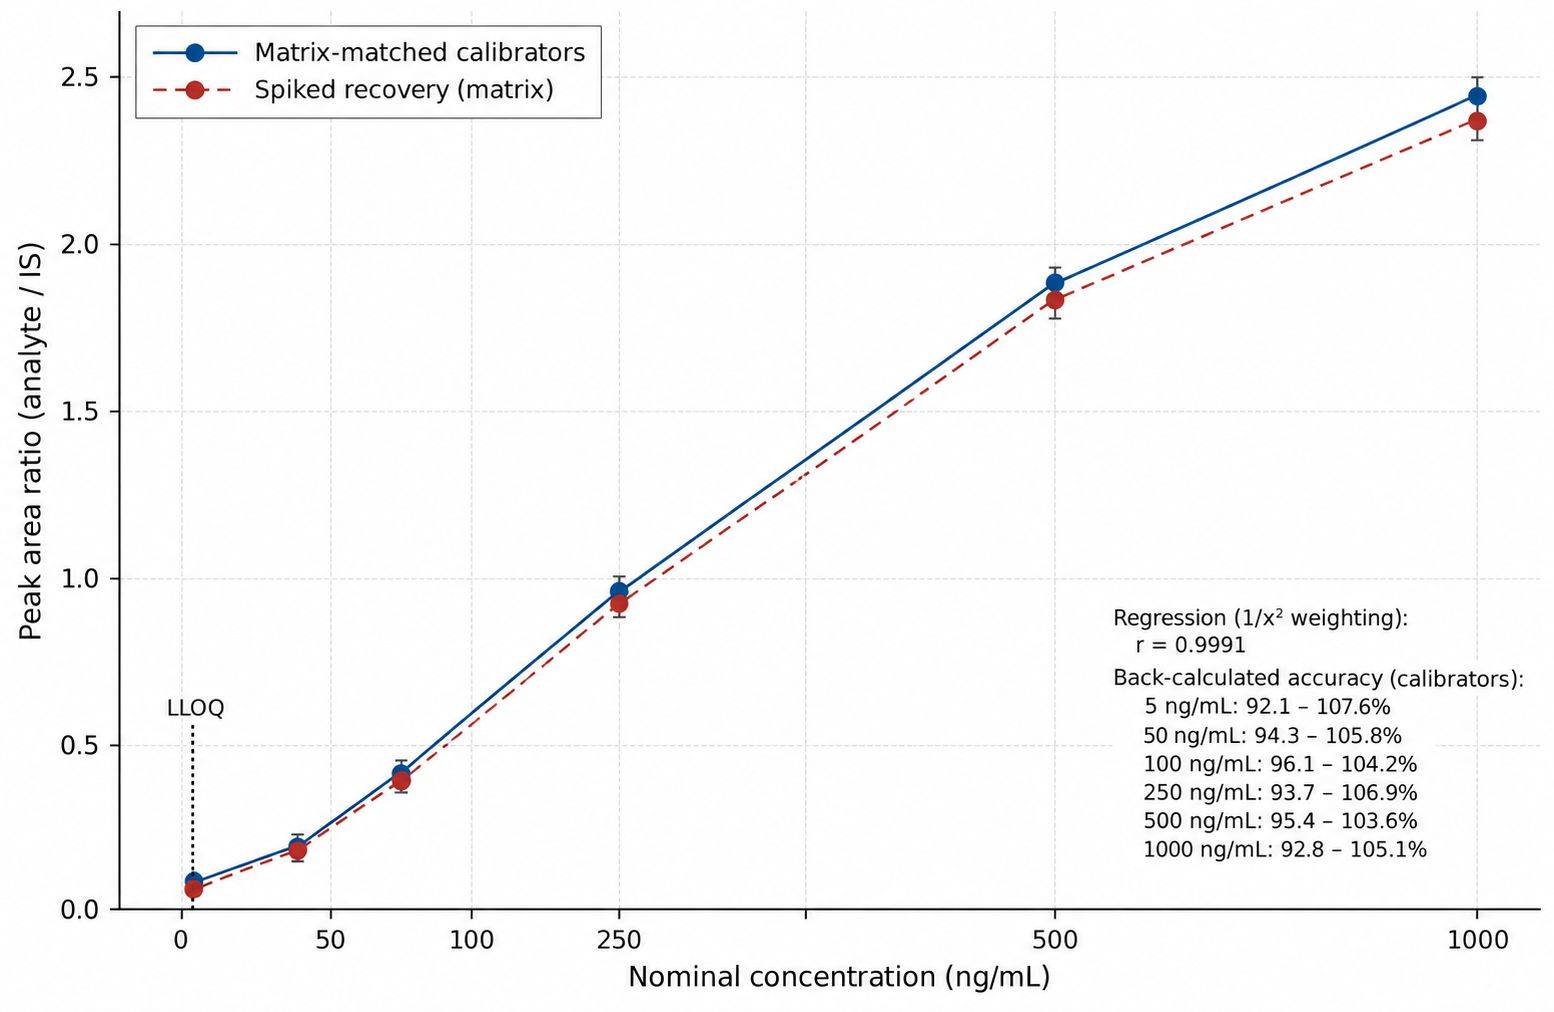
Absolute, against authentic standards; 6- to 8-point calibration per analyte |
| Internal standards |
Isotope-labeled standard spiked at the earliest preparation step for every reported analyte
|
| Calibration |
Matrix-matched where matrix effects are significant; weighted regression to fit the working
range |
| Precision |
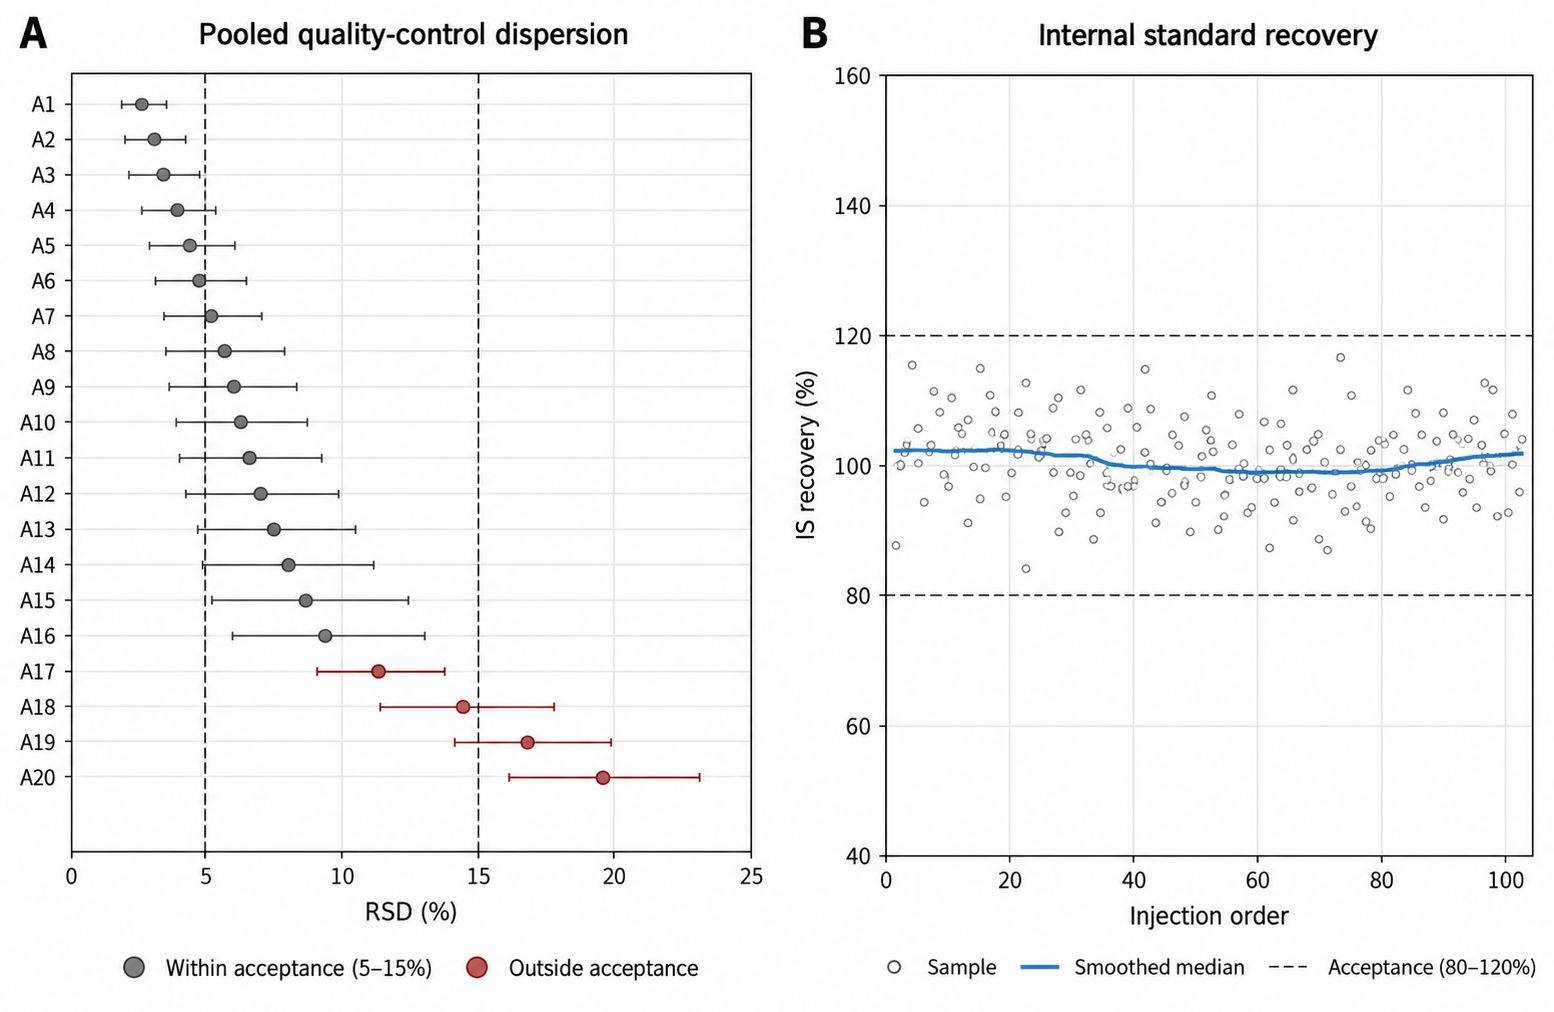
Intra-batch below 10 percent for the majority of analytes; inter-batch within 15 percent |
| Recovery window |
Internal standard recovery monitored per sample, typically within 80 to 120 percent |
| Calibration quality |
R² at or above 0.99 for reported analytes, with back-calculated accuracy documented |
| QC design |
Pooled QC injections bracketing each batch, plus blank and extraction-blank monitoring for
carryover |
Pharmacometabolomics Workflow
Sample Requirements for Clinical and Preclinical Samples
| Sample Type |
Amount Required |
Preparation Instructions |
Storage and Shipping |
| Plasma / Serum |
≥ 50 µL |
Collect in EDTA or heparin tube, centrifuge, aliquot supernatant, avoid hemolysis |
Store at −80°C; ship on dry ice |
| Whole Blood / DBS |
≥ 20 µL |
Dried blood spot cards dried completely before packing, or whole blood aliquoted directly |
Store at −80°C; ship on dry ice |
| Urine |
≥ 50 µL |
Centrifuge to remove debris, record collection interval, aliquot |
Store at −80°C; ship on dry ice |
| Tissue (liver, kidney, brain) |
10–50 mg |
Snap freeze in liquid nitrogen immediately after collection; record wet weight before freezing
where possible |
Store at −80°C; ship on dry ice |
| Feces |
≥ 20 mg |
Aliquot promptly, avoid repeated thawing; relevant where microbial drug metabolism is part of the
question |
Store at −80°C; ship on dry ice |
| Bile |
≥ 50 µL |
Collect on ice, centrifuge, aliquot supernatant |
Store at −80°C; ship on dry ice |
| Cell Pellets |
≥ 1 × 10⁶ cells |
Wash with cold PBS, centrifuge, remove supernatant, freeze the pellet |
Store at −80°C; ship on dry ice |
| Cell Culture Medium |
≥ 100 µL |
Centrifuge, collect supernatant, record time from dosing to collection |
Store at −80°C; ship on dry ice |
Notes
- Pre-dose and post-dose samples from the same subject must be submitted together so they can be extracted
in one batch
- Record the time from dosing to collection for every post-dose sample; the association model depends on
it
- Avoid repeated freeze-thaw cycles; split clinical samples into single-use aliquots before the first
freeze
- Label each tube with subject ID, time point, matrix type, and collection date, and submit a matching
sample list
- Contact us before shipping low-volume pediatric or microdialysis samples so that extraction can be
scaled to the available volume
Deliverables — What You Receive
- Quantitative concentration tables — Absolute concentrations
for every reported analyte, per sample and per time point, in Excel and CSV. Drug-layer and
endogenous-layer analytes are delivered in linked tables sharing one sample identifier.
- QC and calibration report — Calibration curves with
regression parameters and back-calculated accuracy, internal standard recovery per sample, pooled QC
dispersion, blank carryover, and retention-time stability for each analyte.
- Chromatograms and high-resolution data — MRM traces for
quantified analytes, plus MS/MS spectra and accurate mass data supporting the identity of every metabolite
reported from the drug layer.
- Response-association analysis — Paired pre-dose versus
post-dose comparisons at the subject level, and the association between baseline metabolite levels and the
exposure or response endpoints agreed at study design.
- Pathway annotation — Differential metabolites annotated to
KEGG and HMDB identifiers and mapped to pathways, delivered as tables and as publication-ready figures.
- Methods documentation — Sample preparation protocol,
chromatographic and MS parameters, MRM transitions, internal standard assignments, and data-processing
settings, written so that a methods section can be assembled from it directly.
Representative Data
Applications of Pharmacometabolomics
Lipid Remodeling That Accompanies Tyrosine
Kinase Inhibitor Resistance in Chronic Myeloid Leukemia
Background
Chronic myeloid leukemia is treated with tyrosine kinase inhibitors directed at BCR::ABL1, and most
patients reach a durable response. The outstanding clinical problem is resistance, and the usual explanation
is a mutation in the BCR::ABL1 kinase domain. A subset of resistant patients carries no such mutation, which
leaves the resistance phenotype without a molecular cause and without a readout that can be measured
directly from the cells.
The challenge was to determine whether the metabolic state of resistant leukemic cells differs measurably
from that of sensitive cells, and to establish that the difference sits on a lipid route rather than on the
gene's known function in lipid storage. Two clinical settings had to be covered at once: resistance arising
without a kinase domain mutation, and progression from chronic phase to blast phase.
Findings (from the published study)
- G0S2 (G0/G1 switch gene 2) was downregulated in three independent settings of tyrosine kinase inhibitor
resistance: BCR::ABL1 kinase-independent resistance, progression from chronic phase to blast phase, and
chronic myeloid leukemia against normal myeloid progenitors.
- The loss was traced to regulation rather than mutation. MYC/MAX occupancy at the G0S2 promoter together
with promoter CpG methylation repressed transcription of the gene.
- Untargeted LC-MS lipidomics compared K562 cells carrying a non-targeting control, a G0S2 short hairpin
RNA, or ectopic G0S2. The lipidomics acquisition and lipid annotation were performed at Creative
Proteomics.
- G0S2 knockdown reduced very long-chain diacylglycerol and triacylglycerol species, while ectopic G0S2
increased triacylglycerol together with membrane lipids — phosphatidylcholine (PC) and
phosphatidylethanolamine (PE) species accumulated.
- The largest single lipid difference between ectopic G0S2 and G0S2 knockdown was PA(22:6_22:1)-H,
3.2-fold higher in the cells expressing ectopic G0S2.
- KEGG enrichment placed the affected routes in glycerophospholipid metabolism, with autophagy,
glycosylphosphatidylinositol-anchor biosynthesis, ferroptosis, and choline metabolism in cancer also
altered — a set consistent with membrane lipid remodeling rather than with storage alone.
- The lipid phenotype was separable from the established function of G0S2 as an inhibitor of adipose
triglyceride lipase: G0S2 knockdown and ATGL knockdown gave different transcriptional profiles, so the
survival effect did not reduce to a change in lipolysis.
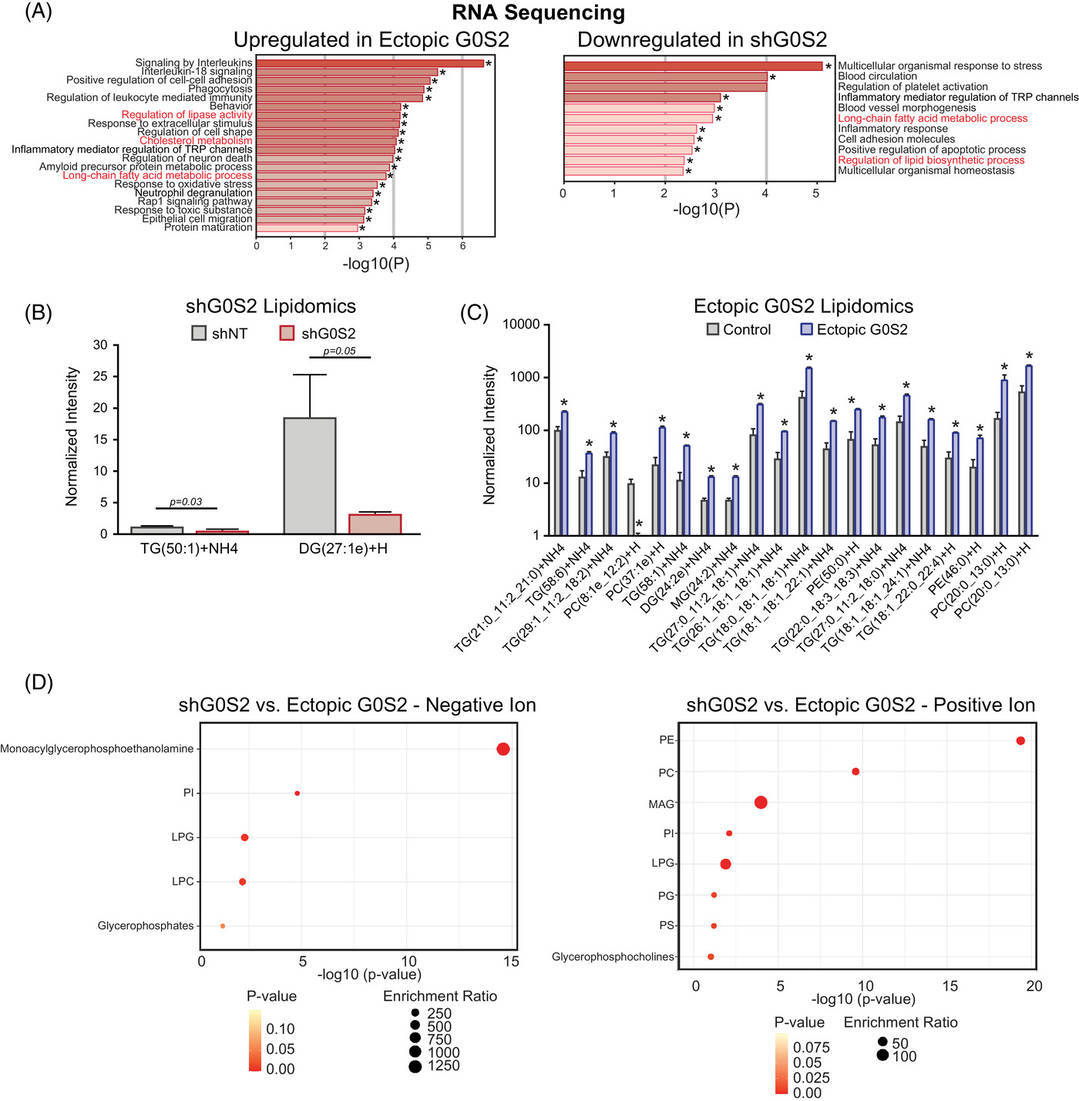 Figure 7. Very long-chain di- and triglycerides fall with G0S2 knockdown, while ectopic G0S2 raises triglycerides and membrane phospholipids.
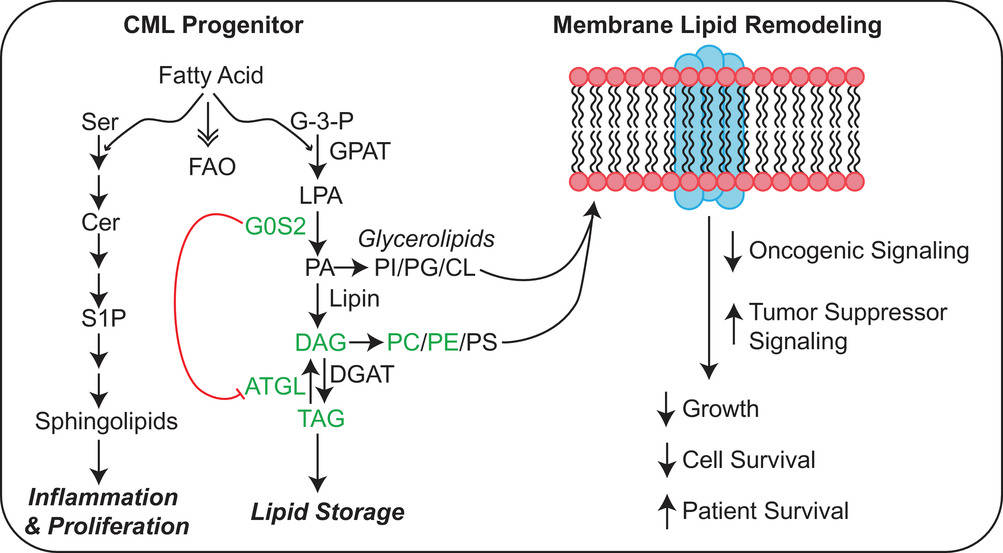 Figure 8. Model linking G0S2 to triglyceride and membrane lipid homeostasis in chronic myeloid leukemia.
Process Insight
The part of this study that matters analytically is the separation between lipid storage and lipid
remodeling. Triacylglycerol increased with ectopic G0S2, which on its own would read as a storage effect,
but phosphatidylcholine and phosphatidylethanolamine species increased with it and phosphatidic acid was the
largest single change. Storage pools and membrane pools move for different reasons, and telling them apart
requires species-level resolution: chain length, degree of unsaturation, and head group each have to be
reported separately rather than collapsed into a total lipid content value. The parallel ATGL knockdown arm
is what made that distinction testable.
Where Our Pharmacometabolomics Service Fits
Creative Proteomics performed the lipidomics acquisition in this study, and the same principles apply to
our pharmacometabolomics programs:
- Species-level lipid resolution — chain length, unsaturation, and head group are
reported per lipid species, which is what distinguishes a storage pool change from a membrane remodeling
change instead of reporting both as one lipid content value.
- Drug-response arms extracted and acquired together — control, knockdown, and
overexpression arms are processed in the same batch with internal standards, so a difference between arms
reflects the perturbation rather than the extraction order.
- Interpretation delivered at pathway level — differential lipid species are annotated
and mapped to pathways such as glycerophospholipid metabolism, so the phenotype is handed back in a form
that can be tested against a pharmacological question.
- Primary data retained for re-analysis — the acquired spectra stay searchable after the
first report, which matters when the same samples later need to be re-queried for a different lipid class.
Reference
- Gonzalez, M.A., Olivas, I.M., Bencomo-Alvarez, A.E. et al.
Loss of G0/G1 switch gene 2
(G0S2) promotes disease progression and drug resistance in chronic myeloid leukemia (CML) by disrupting
glycerophospholipid metabolism. Clinical and Translational Medicine 12(12), e1146 (2022).


 Contact Us


