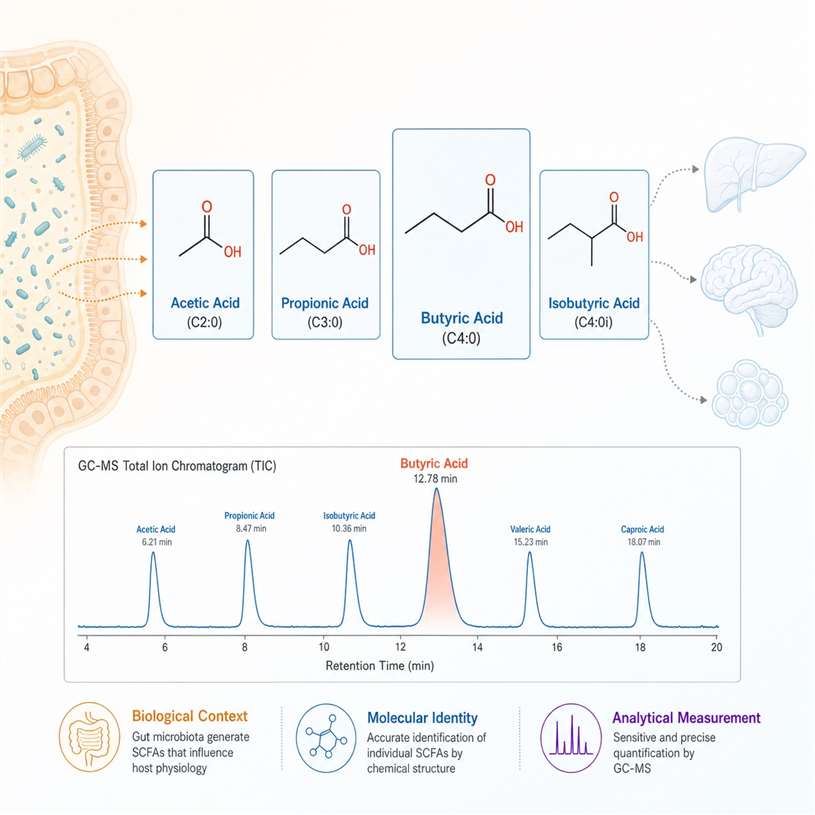
Short-chain fatty acids (SCFAs) — principally acetate (C2:0), propionate (C3:0), and butyrate (C4:0) — are the major end-products of bacterial fermentation of dietary fiber in the colon, functioning as the primary metabolic interface between the gut microbiome and the host. SCFAs signal through dedicated G-protein-coupled receptors (FFAR2, FFAR3, HCAR2) on enteroendocrine, immune, and neuronal cells, while butyrate also acts as a histone deacetylase inhibitor — directly linking microbial metabolism to host gene regulation. Quantifying SCFAs in feces (colonic production), circulation (systemic absorption), and target tissues (functional uptake) is therefore central to microbiome functional studies, nutritional intervention trials, and metabolic disease research. Our targeted service provides absolute quantification of 15+ SCFAs by GC-MS and LC-MS/MS with isotopically labeled internal standards, matrix-specific protocols, and optional microbiome-metabolome integration. Every project is supported by transparent QC metrics and publication-ready reporting — from fecal metabolomics to multi-omics integration for a complete metabolic picture.
SCFA Detection Panel — 15+ Short-Chain Fatty Acids Quantified by GC-MS & LC-MS/MS
Our targeted SCFA panel covers all major straight-chain and branched-chain short-chain fatty acids (C2–C7) plus selected hydroxylated and keto-derivatives. Each analyte is detected with an isotopically labeled analog for absolute quantification. The panel can be ordered as a standalone service or combined with broader panels — see our fatty acids analysis service for medium- and long-chain fatty acid profiling.
| SCFA Compound |
Formula |
Carbon Chain |
Primary Platform |
LOD (µM) |
Biological Significance |
| Acetic Acid |
CH₃COOH |
C2:0 |
GC-MS / LC-MS/MS |
0.05 |
Most abundant SCFA (≥60% of total); substrate for lipogenesis and cholesterol synthesis; crosses blood-brain barrier; regulates hypothalamic appetite signaling |
| Propionic Acid |
C₂H₅COOH |
C3:0 |
GC-MS / LC-MS/MS |
0.05 |
Hepatic gluconeogenic substrate; activates FFAR2/GPR43 on enteroendocrine L cells stimulating GLP-1 and PYY secretion; linked to improved insulin sensitivity |
| Butyric Acid |
C₃H₇COOH |
C4:0 |
GC-MS / LC-MS/MS |
0.02 |
Primary colonocyte energy source (70-80% of oxygen consumption); HDAC inhibitor regulating gene expression; promotes Treg differentiation; maintains gut barrier integrity via tight junction upregulation |
| Isobutyric Acid |
C₃H₇COOH |
C4:0i |
GC-MS |
0.02 |
Branched-chain SCFA derived from valine fermentation; marker of protein fermentation in the distal colon; elevated in high-protein diets and distal colonic disease states |
| Valeric Acid |
C₄H₉COOH |
C5:0 |
GC-MS |
0.02 |
Straight-chain C5 SCFA produced from proline and hydroxyproline fermentation; emerging HDAC inhibitor activity; enriched in specific Clostridium cluster species |
| Isovaleric Acid |
C₄H₉COOH |
C5:0i |
GC-MS |
0.02 |
Branched-chain SCFA from leucine fermentation; elevated in maple syrup urine disease; marker of branched-chain amino acid bacterial metabolism and protein putrefaction |
| Caproic Acid |
C₅H₁₁COOH |
C6:0 |
GC-MS |
0.01 |
Straight-chain C6 SCFA; product of chain elongation from acetate and ethanol by Clostridium kluyveri; emerging role in gut-liver axis and medium-chain fatty acid receptor activation |
| Heptanoic Acid |
C₆H₁₃COOH |
C7:0 |
GC-MS |
0.01 |
Odd-chain C7 SCFA; minor fermentation product detectable in fecal and plasma samples; used as internal standard in comprehensive SCFA profiling methods |
| 2-Methylbutyric Acid |
CH₃CH₂CH(CH₃)COOH |
C5:0br |
GC-MS |
0.02 |
Branched-chain SCFA from isoleucine fermentation; serves as a protein fermentation biomarker alongside isobutyrate and isovalerate; relevant in distal colonic and IBD research |
| 3-Methylbutyric Acid |
(CH₃)₂CHCH₂COOH |
C5:0i |
GC-MS |
0.02 |
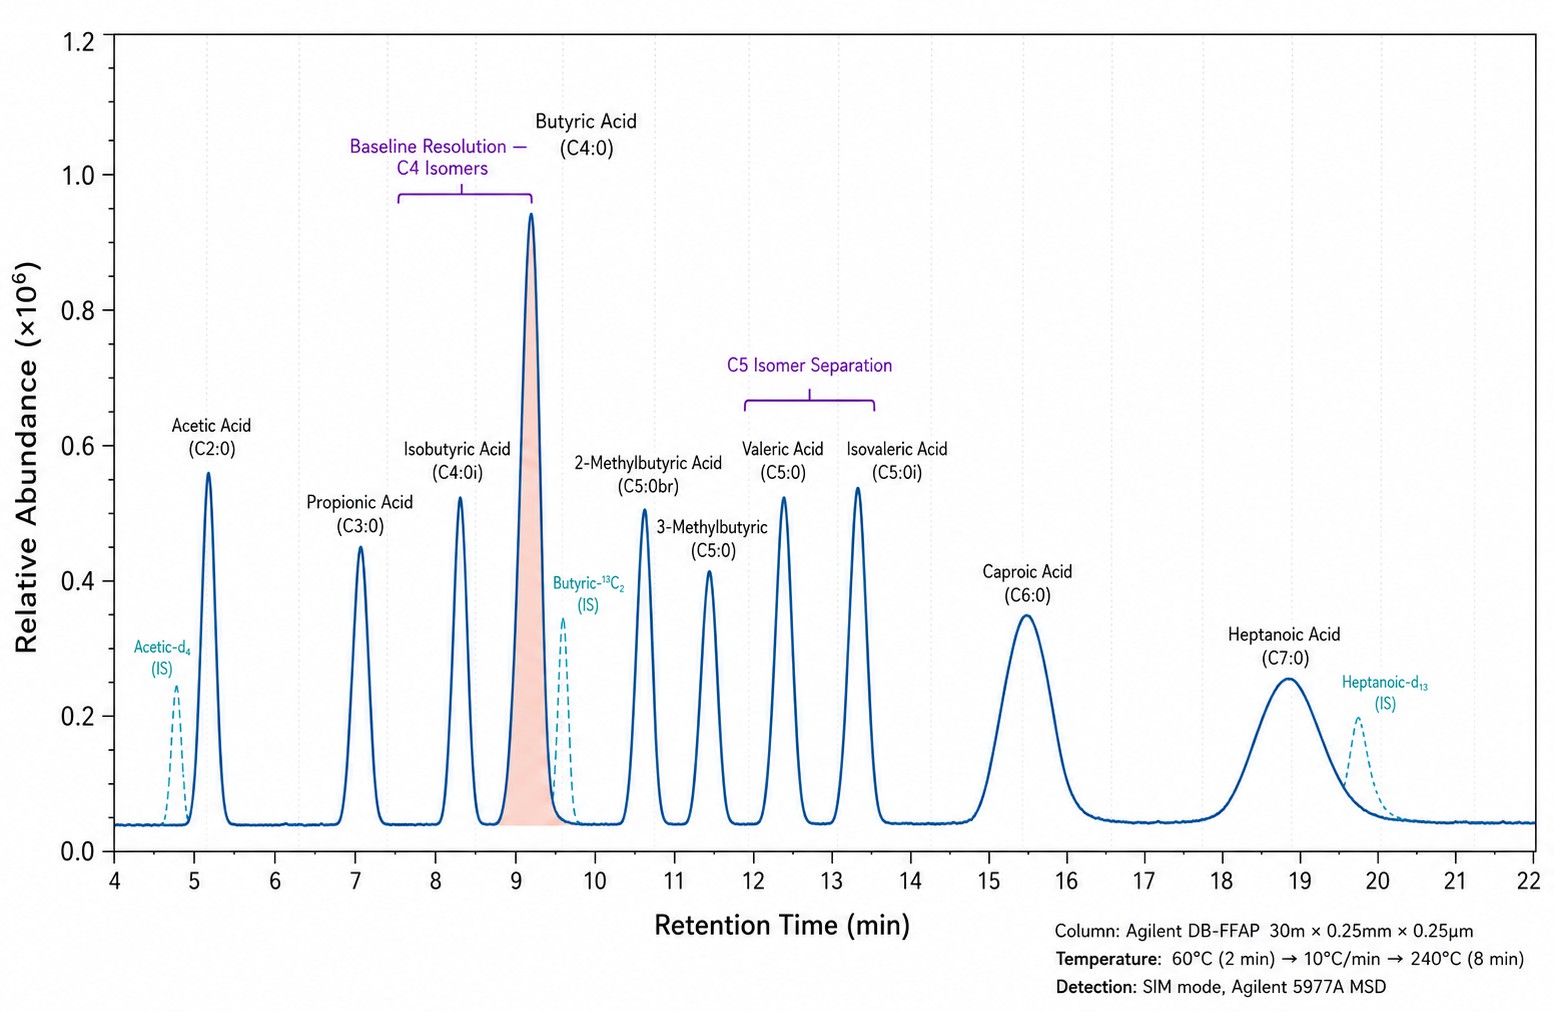
Isomeric branched-chain SCFA co-eluting with 2-methylbutyrate under some GC conditions; baseline-resolved on our DB-FFAP column with optimized temperature gradient |
| Lactic Acid |
CH₃CH(OH)COOH |
C3:0 OH |
LC-MS/MS |
0.05 |
Major bacterial fermentation intermediate; converted to butyrate and propionate by cross-feeding bacteria (e.g., Eubacterium hallii, Anaerostipes caccae); elevated in small intestinal bacterial overgrowth (SIBO) |
| Succinic Acid |
HOOCCH₂CH₂COOH |
C4:0 di |
LC-MS/MS |
0.05 |
Key bacterial fermentation intermediate in the succinate pathway for propionate production; accumulates in dysbiosis and intestinal inflammation; activates SUCNR1 on immune and epithelial cells |
| Formic Acid |
HCOOH |
C1:0 |
GC-MS / LC-MS/MS |
0.10 |
Simplest SCFA; product of bacterial mixed-acid fermentation; marker of methanogenic archaeal activity (converted to methane by Methanobrevibacter); relevant in hydrogenotrophic microbiome studies |
| β-Hydroxybutyric Acid |
CH₃CH(OH)CH₂COOH |
C4:0 OH |
LC-MS/MS |
0.05 |
Ketone body also produced by gut bacteria; dual source from host hepatic ketogenesis and microbial butyrate oxidation; relevant in ketogenic diet and fasting microbiome studies |
| α-Ketoisovaleric Acid |
(CH₃)₂CHCOCOOH |
C5:0 keto |
LC-MS/MS |
0.05 |
Branched-chain keto acid from valine degradation; intermediate linking branched-chain amino acid metabolism to branched-chain SCFA production; relevant in maple syrup urine disease and microbial-host co-metabolism |
Analytical Platform & Method Performance for SCFA Quantification
GC-MS Platform (Primary for Volatile SCFAs)
Gas Chromatograph: Agilent 7890B GC system with split/splitless injector and electronic pressure control
Mass Spectrometer: Agilent 5977A Mass Selective Detector (MSD) with inert EI ion source; selected ion monitoring (SIM) mode for maximum sensitivity
Column: Agilent J&W DB-FFAP capillary column (30 m × 0.25 mm × 0.25 µm) — nitroterephthalic acid-modified polyethylene glycol stationary phase optimized for free fatty acid separation with baseline resolution of isobutyric/butyric and isovaleric/valeric isomer pairs
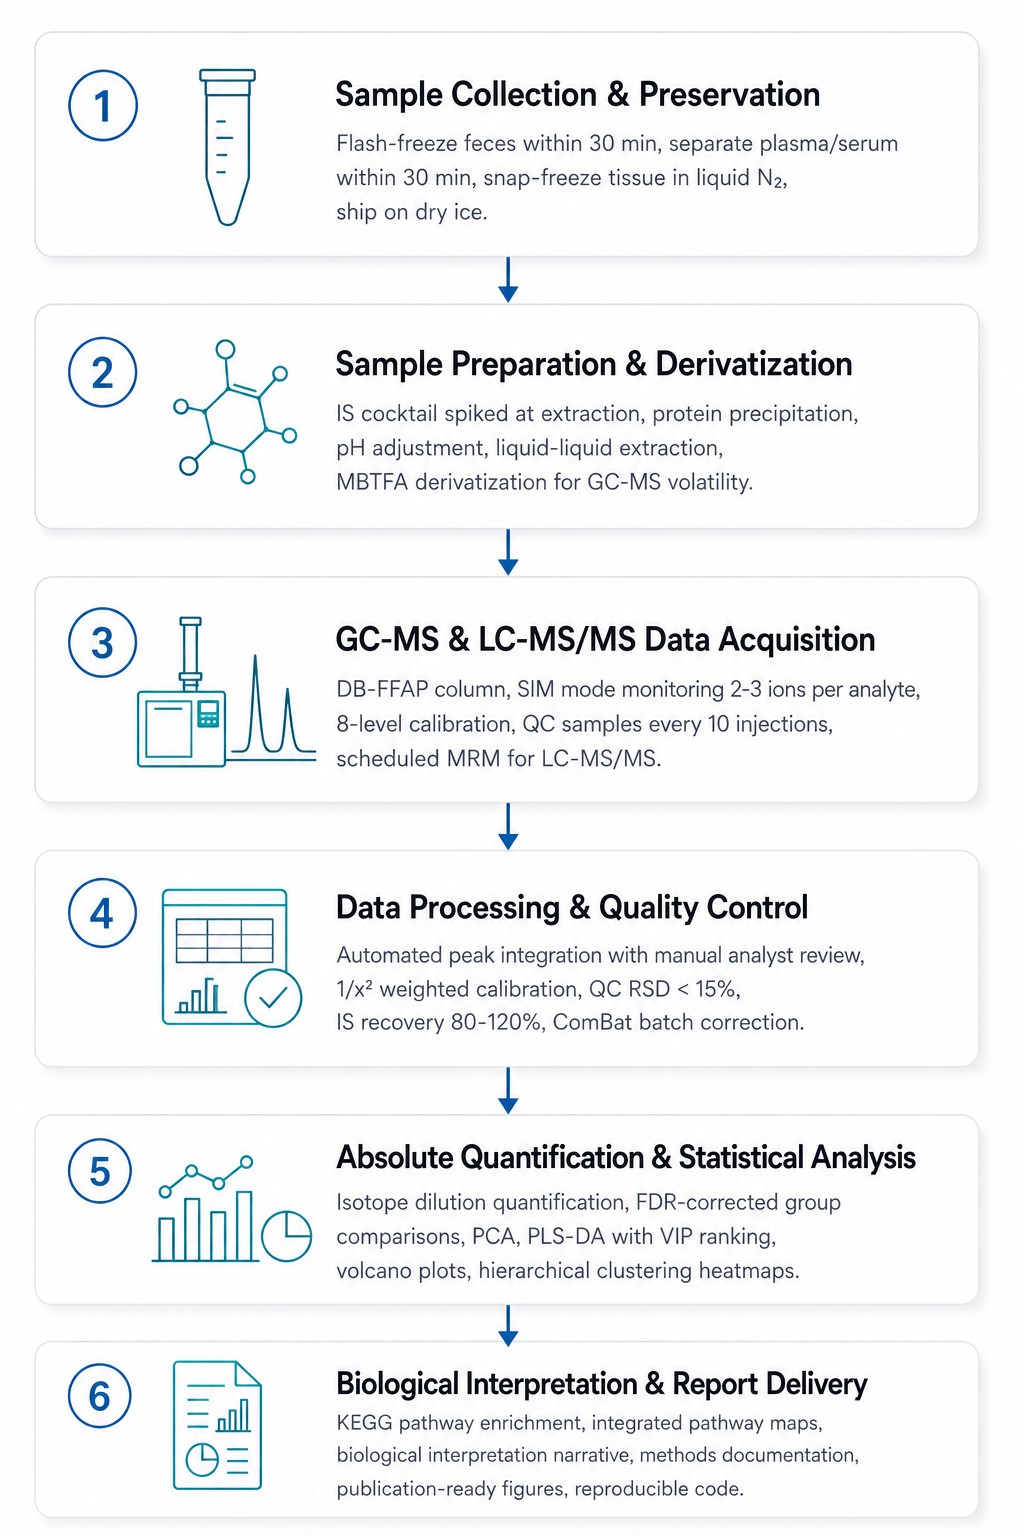
Derivatization: MBTFA (N-methyl-bis(trifluoroacetamide)) derivatization — converts SCFAs to volatile trifluoroacetyl derivatives for improved peak shape, sensitivity, and chromatographic resolution of branched-chain isomers
Acquisition: SIM mode monitoring 2-3 qualifying ions per analyte plus internal standard; dwell time optimized per compound for ≥12 data points across each chromatographic peak
LC-MS/MS Platform (Complementary — Non-Volatile & Polyfunctional SCFAs)
High-Resolution MS: Thermo Fisher Q Exactive Orbitrap for untargeted screening and metabolite discovery
Triple Quadrupole: Waters Acquity UPLC coupled to Xevo TQ-S micro MS with ESI source — scheduled MRM in negative ion mode for hydroxy acids, keto acids, and dicarboxylic acids
GC-FID: Thermo TRACE 1310 GC-FID for routine SCFA profiling and high-throughput applications (see our GC-FID protocol for SCFA analysis)
IC-MS: Dionex ICS-5000+ Ion Chromatography coupled to Thermo Orbitrap MS for organic acid profiling in complex matrices without derivatization
Method Performance
| Parameter |
Typical Performance |
| Limit of Detection (LOD) |
0.01–0.10 µM (compound-dependent); 0.02 µM for butyrate and branched-chain SCFAs in fecal extract |
| Linear Range |
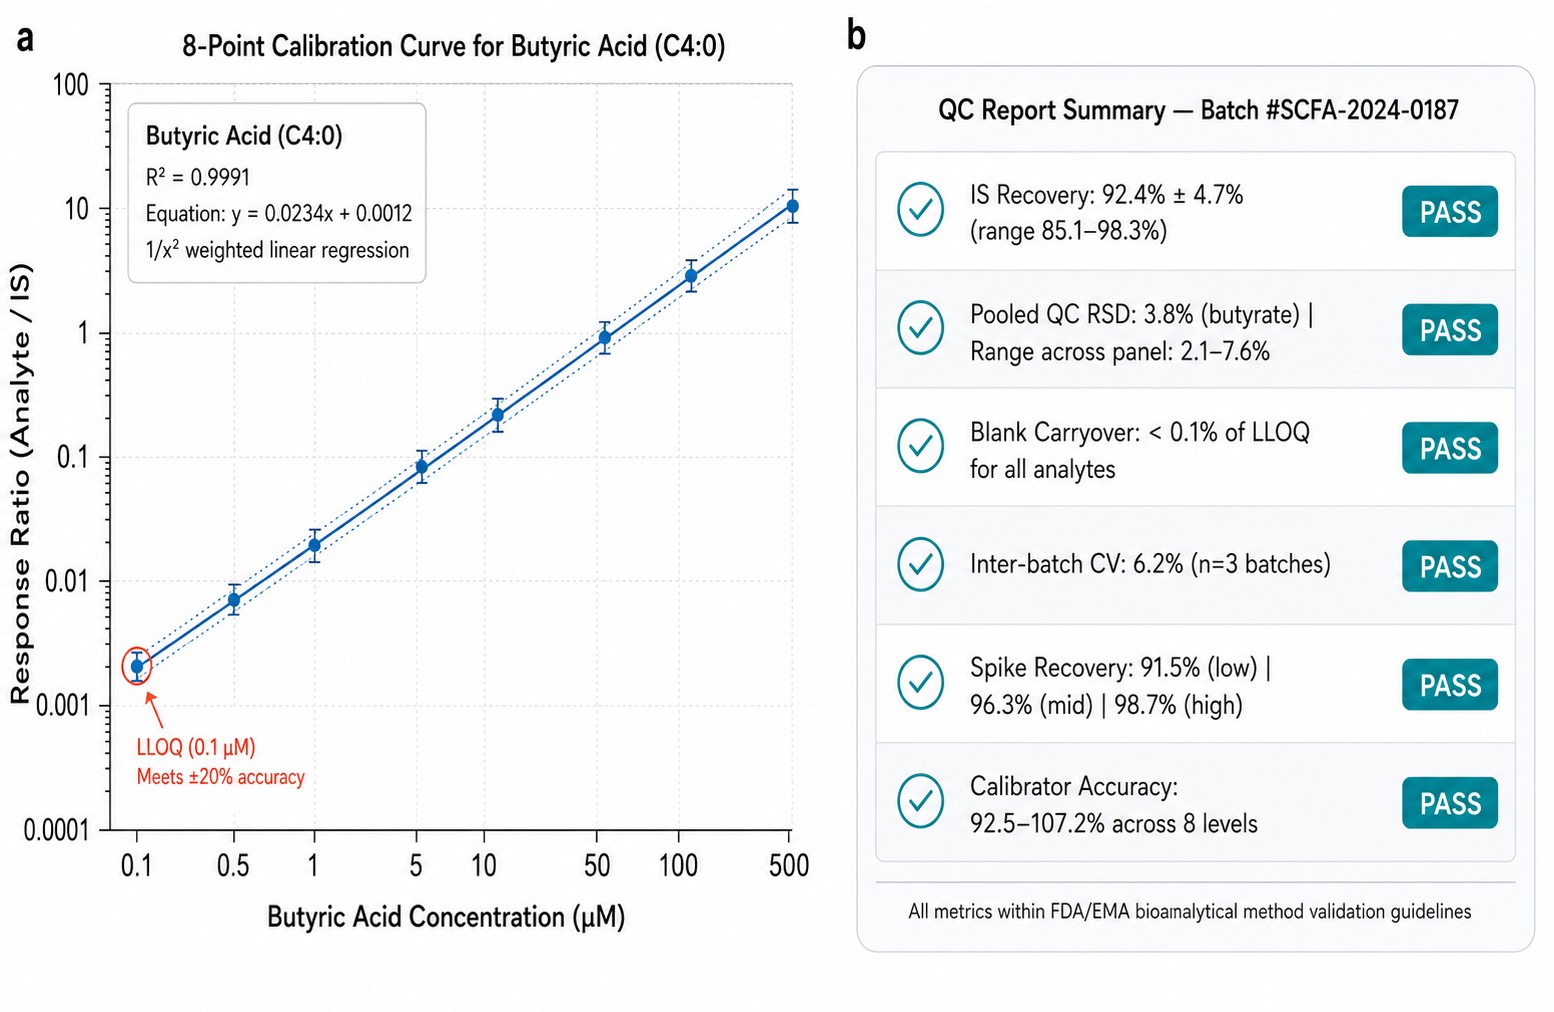
0.1–500 µM (3-4 orders of magnitude per analyte); 1/x² weighted least-squares regression |
| Calibration Linearity |
R² ≥ 0.99 for all analytes; back-calculated calibrator accuracy 90–110% at LLOQ, 95–105% at mid-range and high calibrators |
| Intra-Batch Precision |
CV < 5% for major SCFAs (acetate, propionate, butyrate); CV < 8% for branched-chain and minor SCFAs — determined from 6 replicate QC sample preparations |
| Inter-Batch Precision |
CV < 10% across 3 independent analytical batches; pooled QC samples prepared fresh per batch |
| Recovery (Accuracy) |
Spike recovery 85–115% in fecal, plasma, and tissue homogenate matrices at low, medium, and high spike levels |
| Internal Standards |
Isotopically labeled analogs per compound class: acetic acid-d₄, propionic acid-d₆, butyric acid-¹³C₂, isobutyric acid-d₇, valeric acid-d₉, isovaleric acid-d₉, caproic acid-d₃, heptanoic acid-d₃ — spiked at extraction |
SCFA Analysis Workflow — From Sample Collection to Biological Interpretation
Why Choose Our SCFA Analysis Service for Your Microbiome & Metabolism Research
- 15+ SCFA Panel — Broader Coverage Than Standard Academic Core Panels
Most core facilities quantify 6-9 SCFAs. Our panel covers 15+ compounds including branched-chain isomers (isobutyrate, isovalerate, 2-methylbutyrate, 3-methylbutyrate), hydroxylated derivatives (lactate, β-hydroxybutyrate), and keto acids — giving you a complete picture of microbial saccharolytic and proteolytic fermentation, not just the major three. This is the same panel breadth used in high-impact Nature and Cell metabolism studies.
- Published Sensitivity & Linearity — No Black Box Performance
LOD 0.01–0.10 µM. Linear range 0.1–500 µM. R² ≥ 0.99. Intra-batch CV < 5% for major SCFAs. Spike recovery 85–115% across matrices. Every metric is published upfront and documented per batch in your QC report — because if you cannot cite the performance, the data is not reproducible. Only one competitor (Metabolon) publishes comparable LLOQ data.
- Isotopically Labeled Internal Standards — Gold Standard Absolute Quantification
Every SCFA in our panel has a matched deuterated or ¹³C-labeled internal standard spiked at the extraction step — before any processing losses occur. This corrects for derivatization efficiency, extraction recovery, matrix effects, and injection variability in a single step. Non-labeled surrogate standards cannot achieve the same accuracy in complex fecal and plasma matrices. This is the difference between "detected" and "quantified."
- Dual-Platform Coverage — GC-MS for Volatile SCFAs + LC-MS/MS for Non-Volatile & Polyfunctional Analytes
GC-MS on a DB-FFAP column with MBTFA derivatization is the reference method for volatile C2–C7 SCFAs — no other technique matches its isomer resolution. But lactate, succinate, β-hydroxybutyrate, and α-keto acids require LC-MS/MS for optimal sensitivity without derivatization artifacts. We run both platforms so your panel is not compromised by forcing every analyte through one method.
- Matrix-Specific Protocols — Feces, Plasma, Tissue, and More
Fecal SCFA extraction differs fundamentally from plasma SCFA extraction: fecal concentrations are mM range (requiring dilution), plasma concentrations are µM range (requiring concentration and matrix-matched calibration). Tissue SCFAs face additional challenges from post-mortem metabolism. We maintain optimized, matrix-specific SOPs for every sample type — validated with spike-recovery experiments in each matrix.
- 500+ SCFA Projects Completed, 200+ Publications Supported, 10+ Years of Targeted Metabolomics Expertise
Our bioinformatics team has processed SCFA data from dietary intervention RCTs, IBD cohort studies, cancer immunotherapy trials, neuro-gastroenterology models, and agricultural microbiome research. We understand the biology behind the numbers — not just the chromatography.
Applications of Short-Chain Fatty Acid Analysis in Biomedical & Nutritional Research
Sample Submission Requirements for SCFA Analysis
| Sample Type |
Minimum Amount |
Collection & Preservation |
Shipping Conditions |
| Fresh Feces |
≥ 50 mg |
Collect into sterile, DNase/RNase-free cryovial (no preservatives). Flash-freeze in liquid N₂ within 30 min of defecation. Record time from collection to freezing. Avoid repeated freeze-thaw cycles |
Dry ice (−78°C), overnight courier with temperature logger |
| Freeze-Dried Feces |
≥ 5 mg |
Lyophilize fresh fecal sample to constant weight. Record wet weight before drying and dry weight after for water content correction. Store in airtight container with desiccant at −80°C |
Dry ice or cold packs (stable at room temperature when fully desiccated; −80°C preferred for long-term storage) |
| Serum |
≥ 100 µL |
Collect into EDTA (preferred) or heparin tubes. NO serum separator/gel tubes — SCFAs adsorb to gel matrices. Centrifuge at 1,500 × g, 10 min, 4°C within 30 min of collection. Aliquot into cryovials. Flash-freeze and store at −80°C |
Dry ice, overnight courier |
| Plasma |
≥ 100 µL |
EDTA or lithium heparin plasma preferred. Avoid sodium fluoride tubes — fluoride inhibits derivatization. Process as for serum. Note anticoagulant type on submission form |
Dry ice, overnight courier |
| Tissue (Colon, Liver, Brain, Adipose) |
≥ 50 mg |
Snap-freeze in liquid N₂ or liquid N₂-cooled isopentane immediately after dissection. Record warm ischemia time (time from tissue devascularization to freezing — ideally < 60 s). Wrap in pre-labeled aluminum foil. Store at −80°C |
Dry ice, overnight courier |
| Urine |
≥ 500 µL |
Midstream or 24 h collection. Centrifuge to remove particulates. Add sodium azide (0.02% final) if 24 h collection. Aliquot and freeze at −80°C. Record collection time and total volume for normalization |
Dry ice, overnight courier |
| Saliva |
≥ 200 µL |
Collect by passive drool or Salivette (centrifuge to recover sample). No food/drink for 30 min prior. Centrifuge at 10,000 × g, 5 min, 4°C to remove debris. Aliquot supernatant, flash-freeze, −80°C |
Dry ice, overnight courier |
| Intestinal Contents / Digesta |
≥ 100 mg |
Collect from specific intestinal segment (duodenum, jejunum, ileum, cecum, colon). Flash-freeze in liquid N₂ within 30 s of collection. For rodent studies: pool content from a defined segment length for consistency |
Dry ice, overnight courier |
| Cell Culture Supernatant |
≥ 200 µL |
Centrifuge at 300 × g, 5 min to remove cells → 2,000 × g, 10 min to remove debris. Collect supernatant. Include media-only blanks (incubated without cells) for subtraction of background SCFAs from FBS. Flash-freeze, −80°C |
Dry ice, overnight courier |
To begin: Submit your sample metadata sheet (Sample ID, Group/Treatment, Sample Type, Collection Date/Time, Freezing Method, Anticoagulant if applicable) with your experimental design description. Large sample batches: contact us for secure FTP upload for metadata files. Sample integrity confirmed within 1 business day of receipt.
SCFA Analysis Deliverables — What You Receive
Absolute Quantification Data Table — SCFA concentrations (µmol/g, µM, or nmol/10⁶ cells) with per-sample QC flags. Excel (.xlsx) + CSV formats for direct import into statistical software or multi-omics pipelines.
GC-MS Chromatograms & Calibration Curves — Extracted ion chromatograms for every analyte plus 8-point calibration curves with R² and accuracy annotations. Reviewer-ready for supplementary figures.
Quality Control Report — IS recovery, pooled QC RSD, inter/intra-batch CV, blank assessment, carryover check, and system suitability. Every QC metric transparently documented.
Methods Documentation — Complete sample preparation, derivatization, acquisition, and data processing description. Drop directly into your manuscript methods section — software versions and parameter values included.
Statistical Analysis Report — Group comparison tables (fold-change, FDR), volcano plots, PCA scores plot with QC clustering, hierarchical clustering heatmap, and box/violin plots for top differential SCFAs.
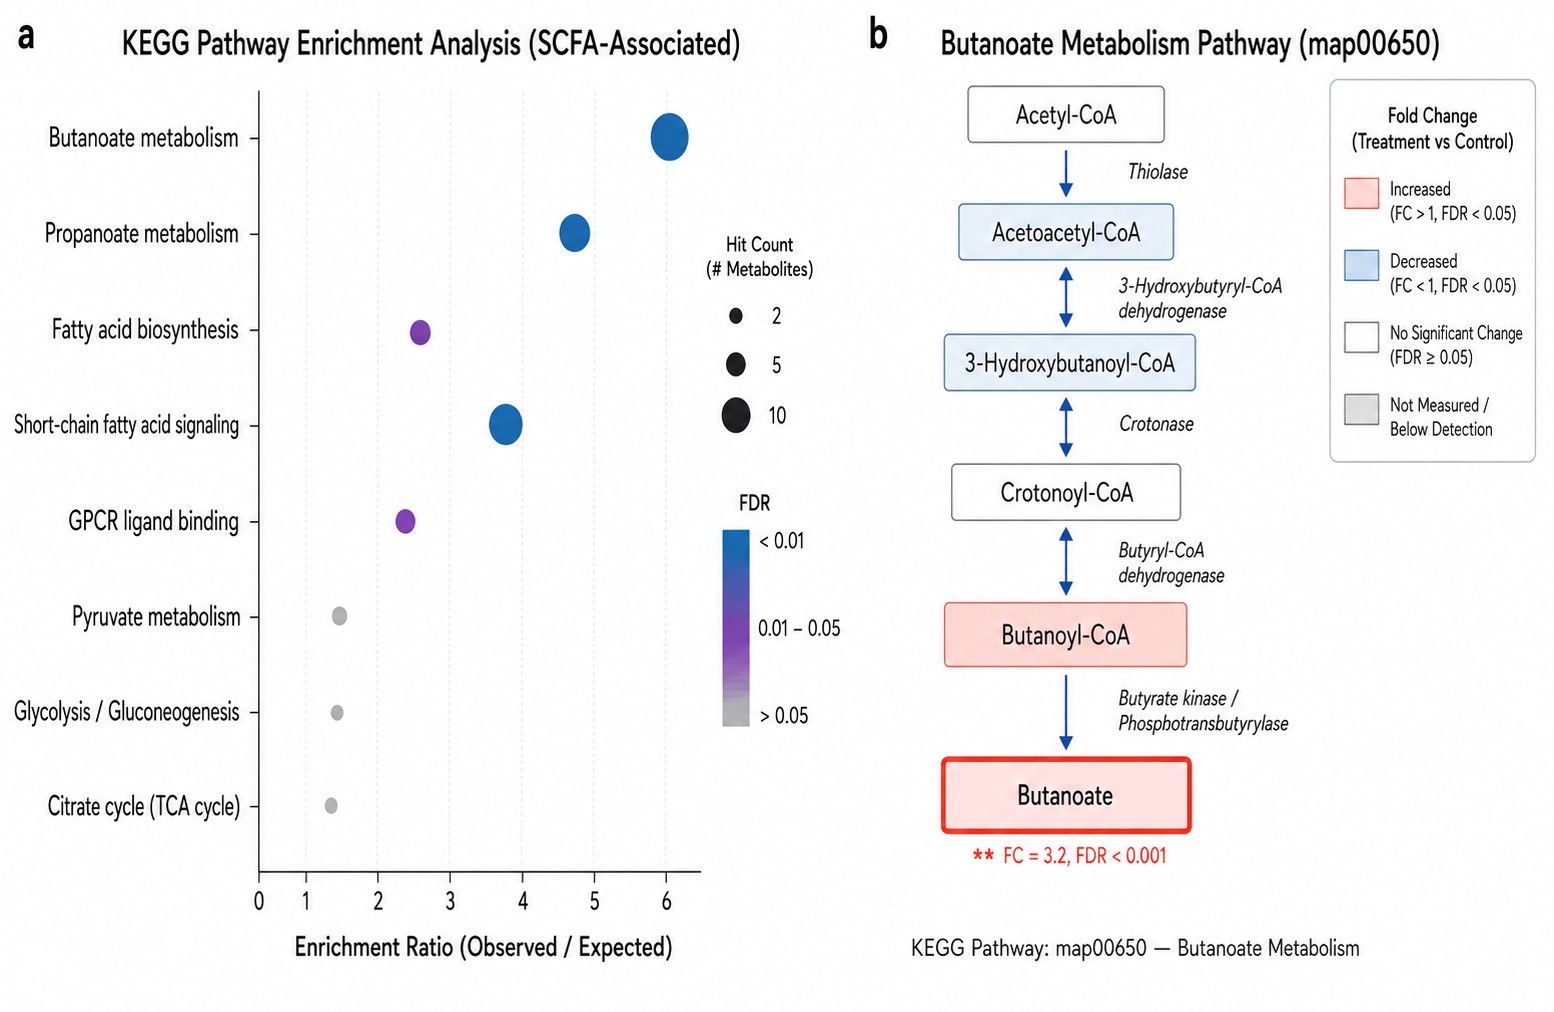
Pathway & Functional Interpretation — KEGG pathway enrichment (butanoate/propanoate metabolism, SCFA signaling) with integrated pathway maps colored by fold-change. Biological interpretation narrative contextualized to your experimental model.
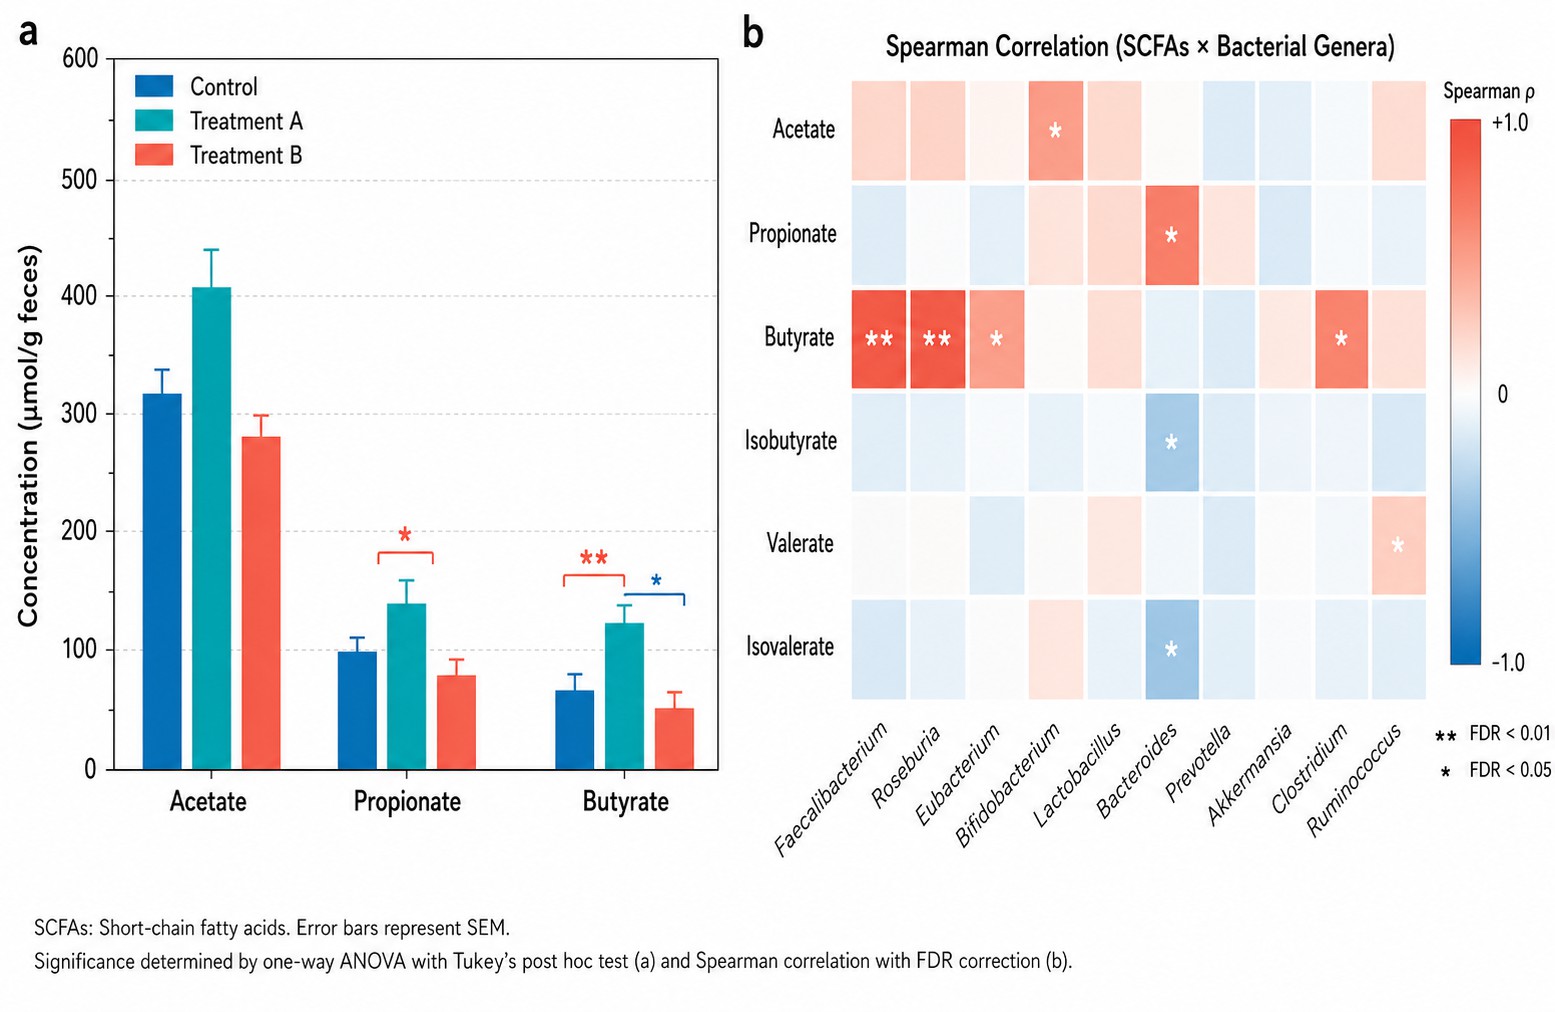
Microbiome-SCFA Correlation Analysis (Optional) — Spearman correlation matrix linking SCFAs to bacterial taxa (genus/species level). Correlation network diagrams and heatmaps of significant taxon-metabolite associations with FDR correction.
Reproducible Analysis Package — R Markdown or Jupyter notebook with annotated code. Processed data tables (Excel + CSV) plus raw instrument files for independent re-analysis or repository deposition (MetaboLights, Metabolomics Workbench).
Case Study — Dietary Fiber-Derived SCFAs Epigenetically Modulate Antibody Responses via B Cell-Intrinsic Mechanisms
B cell-intrinsic epigenetic modulation of antibody responses by dietary fiber-derived short-chain fatty acids
Sanchez, H.N., Moroney, J.B., Gan, H., et al. | Nature Communications, 2020 | IF: 14.7
DOI: 10.1038/s41467-019-13603-6
The Research Question
Dietary fiber is known to support humoral immunity, but the mechanism was unclear. Do SCFAs — the fermentation products of dietary fiber — directly regulate B cell antibody production? And if so, is the mechanism metabolic (providing acetyl-CoA for histone acetylation) or receptor-mediated (through FFAR2/GPR43 signaling)? Answering this required quantifying SCFA concentrations in multiple anatomical compartments — gut lumen, systemic circulation, and lymphoid tissues — and linking those concentrations to B cell-intrinsic epigenetic and transcriptional changes.
Key Findings Enabled by SCFA Quantification
| Analytical Measurement |
Biological Finding |
| SCFA Quantification by GC-MS in Feces, Serum, Spleen, and Mesenteric Lymph Nodes |
Mice fed a high-fiber diet showed significantly elevated acetate, propionate, and butyrate in all compartments compared to low-fiber diet controls. Fecal butyrate increased >3-fold; serum butyrate increased 2-fold — demonstrating that dietary fiber-driven SCFA production in the colon translates to measurable systemic exposure in lymphoid organs where B cells reside. |
| Tissue-Level SCFA Concentration-Response Analysis |
Butyrate concentrations measured in the spleen (~50-100 µM) matched the concentration range that induced maximal histone H3K27 acetylation and antibody production in isolated B cells in vitro — establishing physiological relevance of in vitro SCFA treatment experiments. Without tissue SCFA quantification, the effective concentration for in vitro experiments would have been arbitrary. |
| Mechanistic Dissection: Acetyl-CoA Metabolism vs. Receptor Signaling |
SCFAs increased acetyl-CoA levels in B cells, providing substrate for histone acetyltransferases. Butyrate-derived acetyl-CoA preferentially labeled H3K27 acetylation at antibody gene loci (Aicda, Prdm1, Xbp1) — confirmed by ¹³C-butyrate tracing. This metabolic-epigenetic mechanism was independent of FFAR2/GPR43 signaling, distinguishing SCFA effects on B cells from their better-known effects on T cells and enteroendocrine cells. |
Analytical Approach — How Our Service Replicates This Rigor
This study exemplifies the gold standard in SCFA analysis: (1) multi-compartment quantification — feces (production), serum (systemic transport), and tissue (functional target) — rather than fecal SCFAs alone; (2) GC-MS with isotopically labeled internal standards for absolute quantification with sufficient sensitivity (sub-µM) to detect circulating SCFAs, which are 100-1,000× lower than fecal concentrations; (3) concentration-response experiments anchored to measured tissue concentrations rather than arbitrary doses. Our SCFA analysis service provides identical analytical rigor: the same GC-MS platform, the same multi-compartment capability, the same isotopically labeled IS quantification, and the same bioinformatics support for connecting SCFA concentrations to downstream biological pathways — whether your focus is B cell immunology, gut-brain axis, metabolic disease, or oncology.
Reference
- Sanchez, H.N., Moroney, J.B., Gan, H., et al. B cell-intrinsic epigenetic modulation of antibody responses by dietary fiber-derived short-chain fatty acids. Nature Communications 11, 60 (2020).