What Are Tannins and Why Analyze Them?
Tannins are plant-derived polyphenols that bind proteins, interact with polysaccharides, and form complexes with metals. In real projects, they mainly:
- Shape color, bitterness, and astringency in wines, teas, juices, and plant-based foods.
- Influence digestibility, protein utilization, and rumen health in animal feeds.
- Contribute to plant defense, stress tolerance, and quality traits in crops.
Because different tannin classes (hydrolyzable vs condensed) and degrees of polymerization behave very differently, a single "total tannin" value is rarely enough. Tannins analysis focuses on resolving individual tannin species and their relative abundance in a given matrix, so you can:
- Link chemical profiles to sensory properties, nutrition, or biological function.
- Compare batches, varieties, treatments, or processing conditions with confidence.
- Generate data that can feed into breeding, formulation, or quality-control decisions.
What Our Tannins Analysis Service Provides
Our Tannins Analysis Service is built around targeted LC–MS/MS profiling. The goal is to give you not just a single "total tannin" value, but a resolved picture of key tannin classes in your specific matrix.
We typically support:
- Targeted quantification of key tannin species in plant tissues, foods, beverages, feeds, and extracts.
- Coverage from hydrolyzable to condensed tannins, with a focus on structurally defined markers.
- Flexible study design for variety comparison, processing optimization, storage trials, stress treatments, or formulation work.
- Data interpretation support, linking tannin patterns to sensory traits, nutritional readouts, or biological hypotheses.
You can submit single matrices (for example, tea leaves, grape skins, forage samples) or multi-matrix projects across treatments, varieties, or time points.
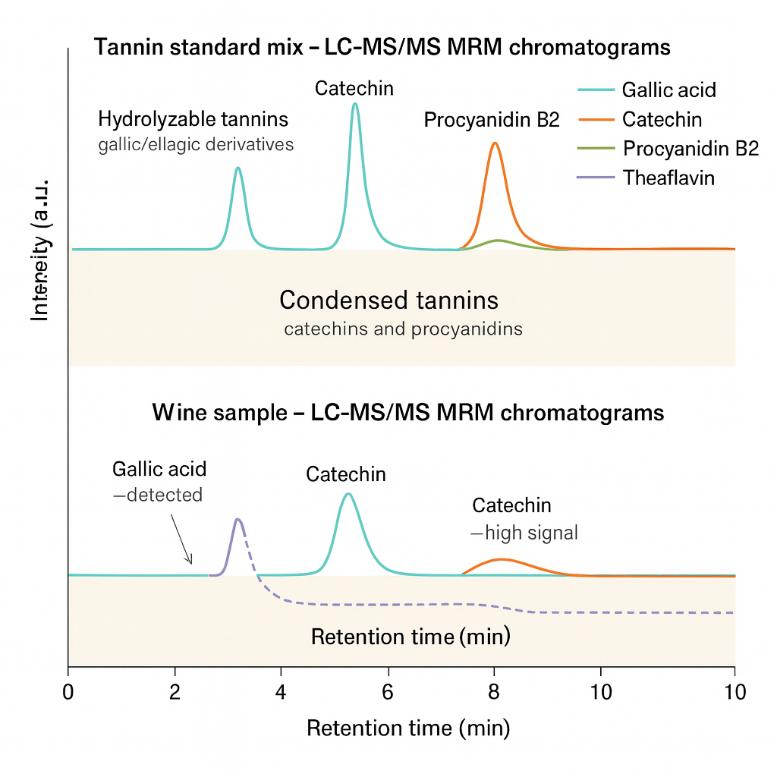
Representative Tannins We Can Analyze
We design targeted panels around your matrix and research question. The table below lists typical tannin classes and markers we can cover; project-specific extensions are available on request.
| Tannin class / group |
Representative analytes* |
Typical matrices / notes |
| Hydrolyzable tannins and related markers |
Gallic acid; methyl gallate; ethyl gallate; tannic acid; galloyl glucose derivatives (mono- and di-galloyl glucose); ellagic acid and derivatives; punicalagin A/B; punicalin |
Plant tissues, fruit juices, pomegranate products, herbal extracts, nutraceutical ingredients |
| Condensed tannins (proanthocyanidins, etc.) |
(+)-Catechin; (–)-epicatechin; gallocatechin; epigallocatechin; procyanidin dimers (B1, B2, B3, B4); higher procyanidin oligomers; theaflavins and theaflavin gallates |
Grape and wine samples, teas, cocoa and chocolate, berry products, forage and feed samples |
| Matrix-specific tannin markers |
Grape/wine color- and mouthfeel-related tannin markers; forage and feed tannins linked to protein binding and rumen health; tannin-rich herbal/nutraceutical markers |
Wine and must, tea and plant infusions, silage/forage, feed formulations, botanical and nutraceuticals |
*Panels can be customized; we can add or remove targets according to your species, matrix, and available reference standards.
Why Choose Creative Proteomics for Tannin Analysis?
- Targeted, not "total" – LC–MS/MS quantification of individual hydrolysable and condensed tannins, avoiding the bias of bulk colorimetric "total tannin" assays.
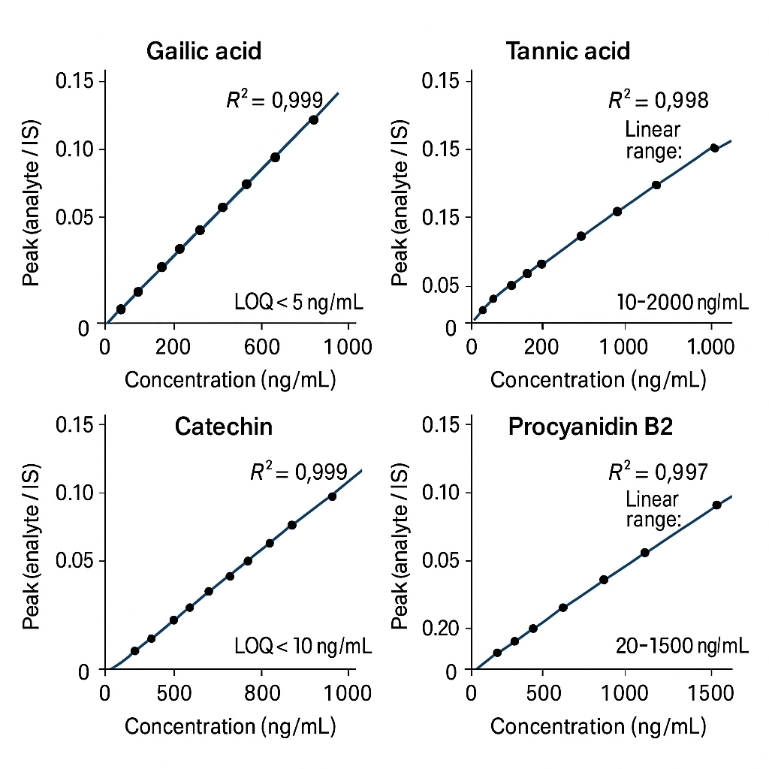
- Quantitative performance you can quote – Typical LOD ~0.1–1 ng/mL, LOQ ~0.3–5 ng/mL, linearity over 3–4 orders of magnitude (R² ≥ 0.99), and CV usually < 10%.
- Transparent quantification strategy – Absolute values where reference standards are available; semi-quantitative results are clearly flagged so interpretation is unambiguous.
- Matrix-optimized methods – Extraction and LC–MS conditions tuned for tea, wine, grape, cocoa, forages/feeds and botanical samples to reduce matrix effects.
- Flexible panel design – Core tannins panel with the option to extend to related phenolic acids, flavan-3-ols and other polyphenols as your project requires.
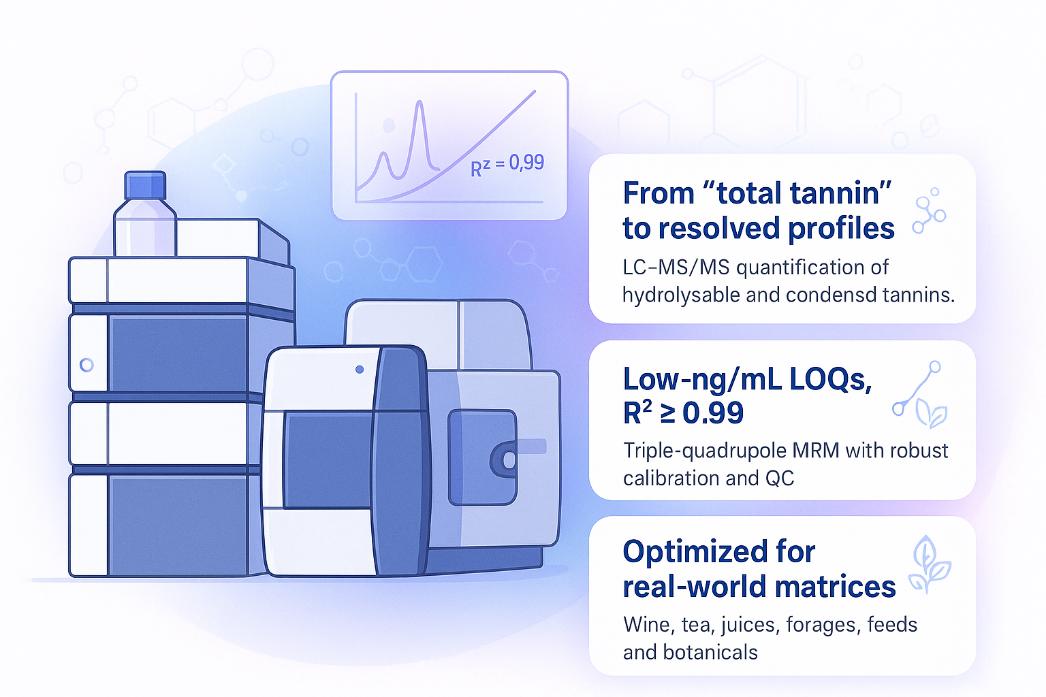
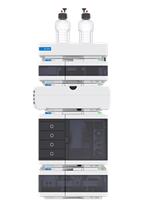
Analytical Platforms for Tannins Quantification
We quantify tannins mainly by UHPLC–ESI–MS/MS on triple-quadrupole instruments, with high-resolution MS used where structural confirmation or extended profiling is needed. Our core platforms are aligned with what is commonly used in recent tannin and proanthocyanidin LC–MS/MS methods.
Core instruments used for tannins analysis
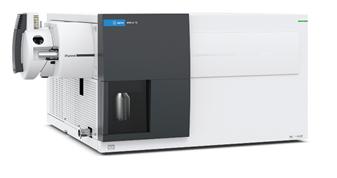
- Agilent 1290 Infinity UHPLC + 6495 Triple Quadrupole LC/MS
High-pressure UHPLC (sub-2 µm columns) coupled to an ESI triple-quad system for routine MRM-based quantification of hydrolysable and condensed tannins in plant matrices.
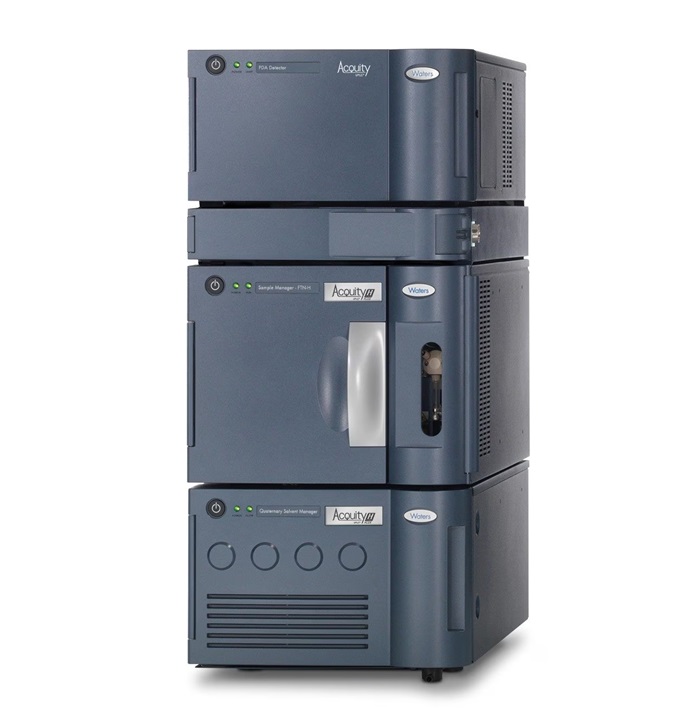
- Waters ACQUITY UPLC + Xevo TQ Triple Quadrupole
UHPLC–ESI–QqQ configuration frequently used in published hydrolysable-tannin workflows; we use a similar setup for fast, selective quantification of marker tannins along biosynthetic pathways.
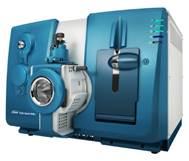
- Thermo Q Exactive Orbitrap (UHPLC–HRMS)
Employed in selected projects for high-resolution confirmation of tannin structures and detailed profiling of proanthocyanidins when needed, following recent literature on PAs and tannins.
These platforms give us a robust balance of high-throughput targeted quantification (triple-quad) and high-confidence identification (Orbitrap HRMS).
Method Performance Parameters
Values below represent typical ranges from our validated tannin / polyphenol workflows and are consistent with recent UHPLC–MS/MS methods for hydrolysable tannins, ellagitannins and proanthocyanidins in the literature. Actual numbers for a given project depend on the specific analyte and matrix.
| Parameter |
Typical value / range |
Notes |
| LC mode |
UHPLC, sub-2 µm C18 columns, up to ~1200 bar |
Allows fast gradients and good resolution of tannins and related polyphenols. |
| Acquisition mode |
ESI, positive/negative switching, MRM (QqQ) |
Targeted transitions for key hydrolysable and condensed tannins. |
| LOD (limit of detection) |
Typically in the low ng/mL range for many tannins (≈0.1–1 ng/mL) |
Comparable to validated UHPLC–MS/MS methods for ellagic acid / ellagitannins and related plant tannins. |
| LOQ (limit of quantification) |
Typically ≈0.3–5 ng/mL |
Sufficient for studying tannins in plant tissues, extracts and many plant-based products. |
| Linearity |
At least 3–4 orders of magnitude, R² ≥ 0.99 |
Multi-point calibration per analyte, in line with small-molecule triple-quad methods. |
| Precision (intra-/inter-day) |
Typically < 10% RSD, often 3–8% |
Based on QC and validation data from tannin and broader phenolic LC–MS/MS assays. |
| Typical run time |
~10–20 min per injection |
Reported UHPLC–QqQ tannin methods resolve key units within ≤10 min; extended gradients used when profiling more complex mixtures. |
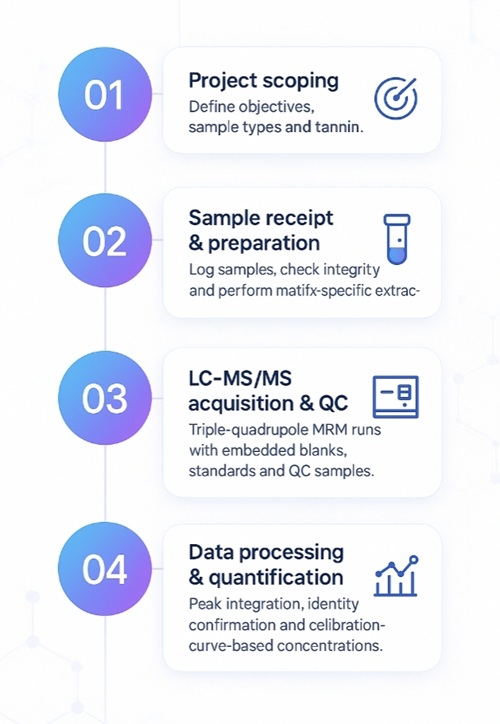
From Sample to Report: Workflow for Tannins Analysis Projects
Sample Requirements for LC–MS/MS Tannins Analysis
| Sample type |
Recommended amount (per sample) |
Container & storage |
Shipping notes |
| Plant tissues (leaf, skin, seed, bark) |
≥ 100 mg fresh or ≥ 30 mg freeze-dried powder |
Pre-labelled cryovials or tubes; freeze immediately and store at −80 °C |
Ship on dry ice; avoid thawing during transit |
| Beverages (wine, tea, juice, plant infusions) |
≥ 5 mL, well mixed |
Amber or light-protected tubes/bottles; store at −20 °C or below |
Ship chilled or on dry ice; protect from light and repeated freeze–thaw |
| Forages and feeds |
≥ 200 mg ground material |
Sealed tubes or bags; keep dry and store at −20 °C or −80 °C |
Ship on dry ice or with sufficient cold packs; prevent moisture uptake |
| Botanical extracts / nutraceutical products |
≥ 50 mg solid or ≥ 1 mL liquid extract |
Tightly sealed vials; store at −20 °C or −80 °C depending on formulation |
Ship on dry ice; ensure caps are well sealed to avoid leakage |
| Other matrices (by consultation) |
To be defined case-by-case |
Agreed in advance according to matrix properties |
Contact us before sampling to confirm requirements |
For publication-oriented studies, we recommend at least three biological replicates per group and clear annotation of treatment, variety, and time point for each sample.
Deliverables: What You Receive from Our Tannins Analysis
Method summary – brief description of sample preparation, LC–MS/MS conditions, monitored transitions, and calibration/QC setup.
Raw data files – LC–MS/MS raw data files (vendor format) for all samples and QC runs.
Processed peak tables – annotated peak lists for each tannin (and related phenolics, if included), with sample IDs and response values.
Quantitative result tables – concentration or semi-quantitative tables per analyte and per sample, with units and flags for values below LOQ or outside calibration range.
QC and calibration report – summary of calibration curves, R² values, QC sample performance, and basic repeatability metrics.
Applications of Tannins Analysis in Foods, Feeds and Plants
Case 1. Tannin Content in Mangrove Plants of Segara Anakan Lagoon, Indonesia
Background:
Mangroves are vegetation found in intertidal zones between marine and terrestrial ecosystems, offering various ecosystem services such as carbon sequestration and pollution reduction. Tannins are important compounds found in mangrove plants and have diverse applications, including protection against pathogens and potential use in various industries.
Samples:
The study was conducted in Segara Anakan Lagoon, Central Java, Indonesia. A total of 342 samples were collected from 19 dominant mangrove species, including stems, barks, and leaves.
Methods:
1. Study Area:
Segara Anakan Lagoon, Cilacap District, Central Java, Indonesia
2. Sample Collection Procedure:
Vegetation Samples: Collected from 37 sampling sites in the lagoon, including mangrove stems, barks, and leaves. Three replicates of each tree part for each species were collected, resulting in 342 samples from 19 dominant mangrove species.
Sample Extraction: Tannin extraction was done using the maceration method. Mangrove powder was mixed with 70% ethanol, left for 24 hours, and then evaporated using a rotary evaporator. Leaves were blended with 70% ethanol, filtered, and further treated with 70% ethanol.
3. Analysis of Tannin Content Procedure:
UV-Visible Spectrophotometry: Used to measure the percent and weight of tannins in the extracted samples. Absorbance method at 280 nm was used for the analysis.
4. Data Analysis:
Clustering Tannin Content: Euclidian distance analysis was used to identify species with similar tannin percentages.
Distribution of Tannin Across Plant Parts: Tannin distribution in mangrove plant parts was analyzed using table stock analysis, determining initial, minimum, maximum, and average stock.
Distribution of Tannin Across Landscape: Tannin distribution across the landscape was constructed based on the percentage and weight of tannins from different mangrove species, helping develop species zonation.
5. Classification of Mangrove Tannin Percentage:
Frequency class analysis was used to classify tannin percentages of different mangrove species, grouping them based on their tannin content potentials.
6. Regression Analysis:
A regression analysis was performed to understand the relationship between potential tannin content (in kg) and the diameter of mangrove trees
Results
The study revealed that tannins were mainly present in barks and stems, contributing to 67% of the total tannin content, while leaves accounted for 33%. Various mangrove species exhibited different tannin percentages, with Xylocarpus moluccensis, Excoecaria agallocha, Nypa fruticans, and Heritiera littoralis having the highest tannin content. Cluster analysis showed specific groupings of mangrove species based on tannin composition and content, indicating distinct characteristics among different clusters. The total tannin content in mangrove plants ranged from 0.59 to 158.96 kg per tree for barks and stems, and from 0.20 to 91.65 kg per tree for leaves. The study highlighted the potential of certain mangrove species as a raw material source for the tannin industry.
 The dendrogram of clustering analysis of mangrove species in Segara Anakan Lagoon, Cilacap, Indonesia based on tannin content
Reference
- Hilmi, Endang, et al. "Tannins in mangrove plants in segara anakan lagoon, central java, indonesia." Biodiversitas Journal of Biological Diversity 22.8 (2021).
Comparative metabolite profiling of salt sensitive Oryza sativa and the halophytic wild rice Oryza coarctata under salt stress
Tamanna, N., Mojumder, A., Azim, T., Iqbal, M. I., Alam, M. N. U., Rahman, A., & Seraj, Z. I.
Journal: Plant‐Environment Interactions
Year: 2024
Physiological, transcriptomic and metabolomic insights of three extremophyte woody species living in the multi-stress environment of the Atacama Desert
Gajardo, H. A., Morales, M., Larama, G., Luengo-Escobar, A., López, D., Machado, M., ... & Bravo, L. A.
Journal: Planta
Year: 2024
Glucocorticoid-induced osteoporosis is prevented by dietary prune in female mice
Chargo, N. J., Neugebauer, K., Guzior, D. V., Quinn, R. A., Parameswaran, N., & McCabe, L. R.
Journal: Frontiers in Cell and Developmental Biology
Year: 2024
Plant Growth Promotion, Phytohormone Production and Genomics of the Rhizosphere-Associated Microalga, Micractinium rhizosphaerae sp
Quintas-Nunes, F., Brandão, P. R., Barreto Crespo, M. T., Glick, B. R., & Nascimento, F. X.
Journal: Plants
Year: 2023