Metabolomics Creative Proteomics
Submit Your Inquiry

Food Metabolomics Services for Quality, Authenticity & R&D

Unclear flavor, unstable quality or questionable origin can stall food launches and damage brands. Creative Proteomics offers food metabolomics services powered by advanced LC–MS/GC–MS foodomics, turning complex food metabolite data into clear insights for product development, quality evaluation and authenticity research.

Key advantages

  • Food-focused LC–MS/GC–MS platform – Untargeted and targeted food metabolomics optimized for real food, beverage and ingredient matrices.
  • Actionable quality & shelf-life markers – Identify metabolite fingerprints linked to flavor, stability and batch consistency.
  • Food authenticity metabolomics – Distinguish genuine vs adulterated samples with data-driven models and key markers.
  • Study design plus data, not just raw files – From experimental design to PCA, volcano plots and biomarker lists, ready for internal R&D decisions.
CONTACT EXPERT
  • Service Details
  • FAQ
  • Publications
  • Submit Your Inquiry

What Is Food Metabolomics?

Food metabolomics (often called foodomics or nutritional metabolomics) is the comprehensive analysis of small molecules (metabolites) in food and food-related matrices.

Using our foodomics LC-MS/MS services, you can:

This approach is ideal for data-driven decision-making in product development, process optimization and food research.

When Do You Need Food Metabolomics?

Typical questions that bring clients to a food metabolomics service include:

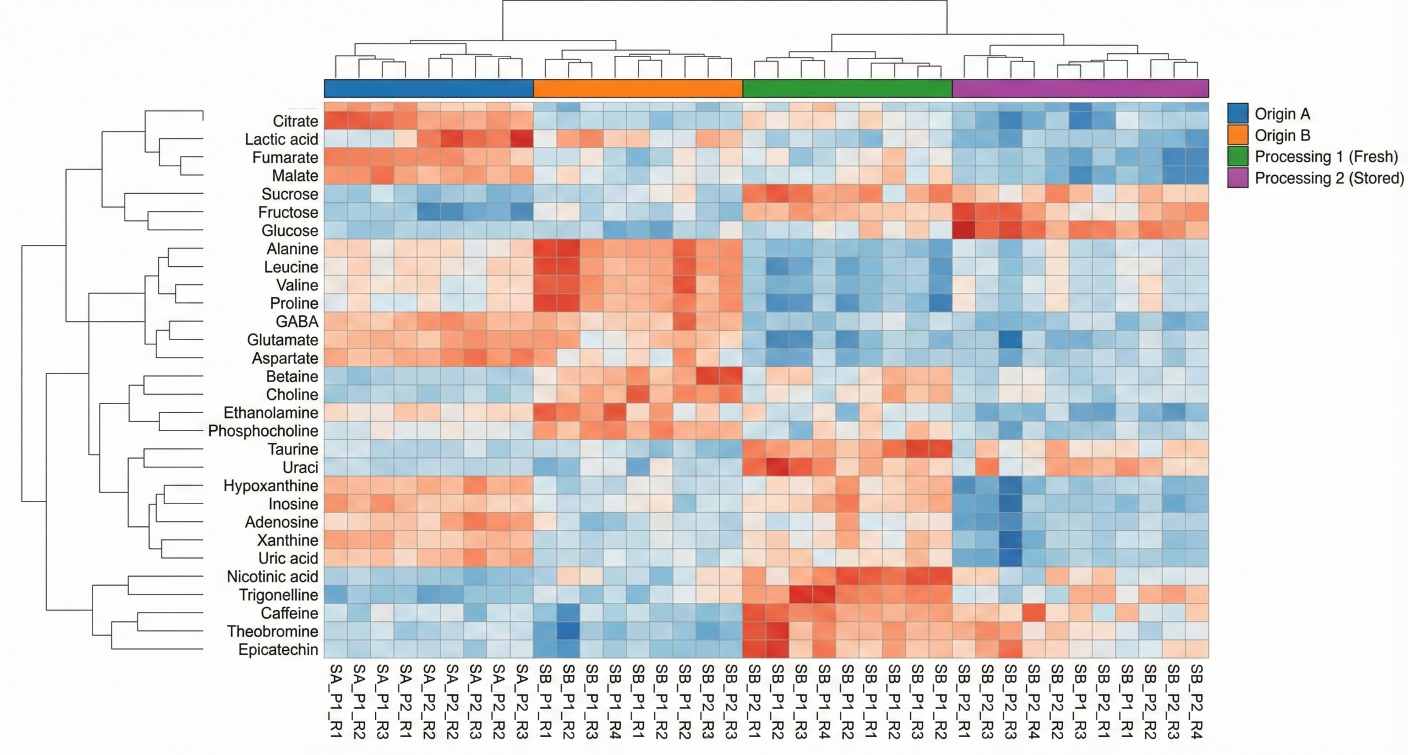
  • How do origin, variety or harvest year change the chemical profile of my product?
  • Can I use food authenticity metabolomics testing to distinguish genuine from adulterated samples?
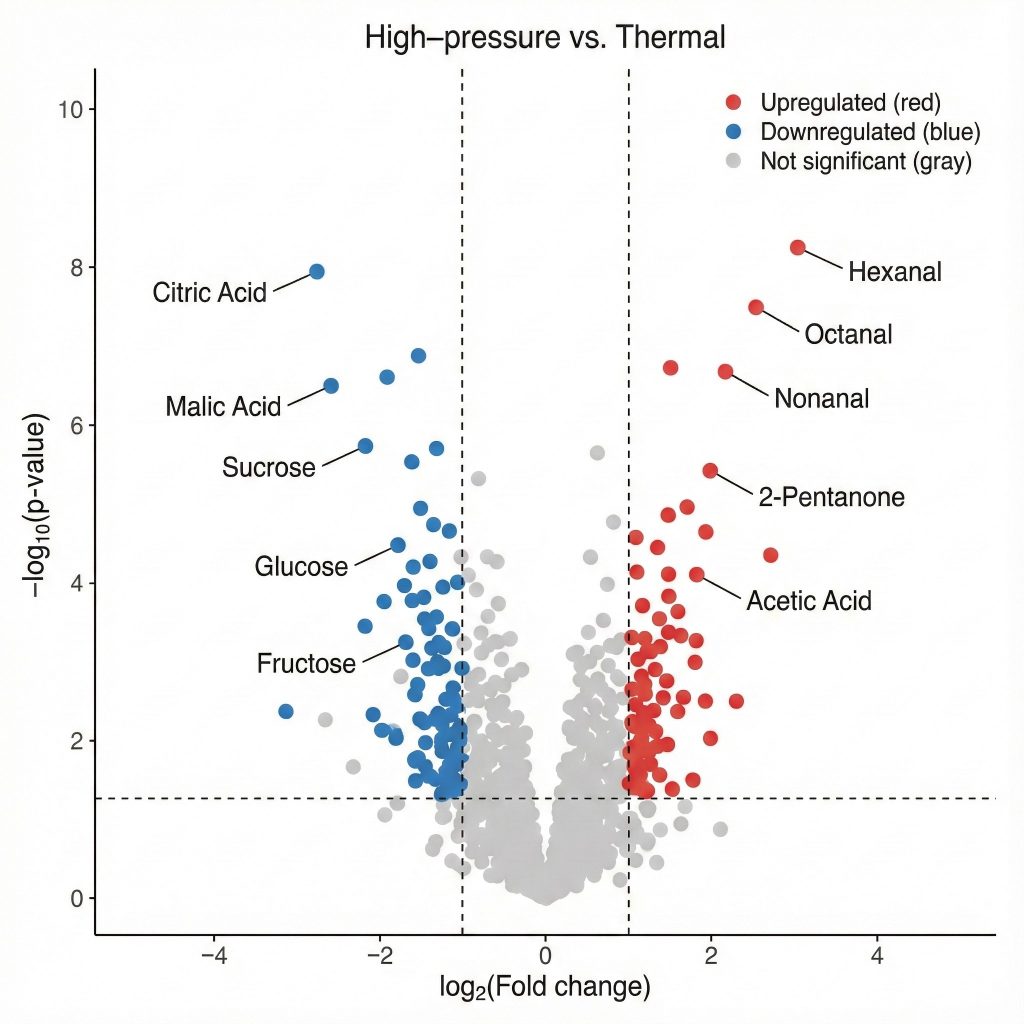
  • What is the impact of processing, formulation or packaging on flavor and shelf-life?
  • Which metabolites are associated with consumer liking or sensory scores?
  • How do different recipes or ingredients affect the nutritional and functional composition of a food?

Our role is to convert complex spectra into clear comparisons, markers and models that answer these practical questions.

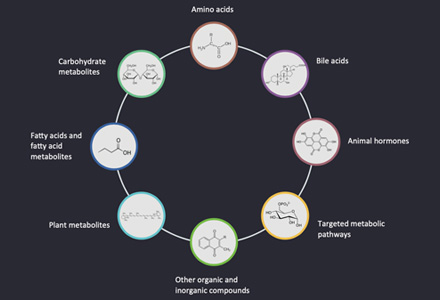
Core Application Areas of Our Food Metabolomics Services

Food Quality, Flavor & Shelf-Life Profiling

Use food metabolomics for quality and flavor profiling to understand why products taste and age the way they do.

We help you:

  • Map flavor-active metabolites in coffee, tea, wine, beer, cocoa, juices and fermented foods
  • Link metabolite profiles to sensory data (aroma, taste, mouthfeel, consumer liking) with multivariate models
  • Compare different processing options (roasting level, fermentation conditions, HPP vs thermal treatment, drying methods)
  • Perform metabolomics-based shelf-life studies, tracking oxidation, off-flavors and nutrient loss over time
  • Build internal food quality fingerprinting models to support batch release and specification setting

Authenticity, Adulteration & Origin Verification

Food authenticity metabolomics testing offers a powerful way to protect brands and high-value products.

Typical projects include:

  • Origin verification for wine, coffee, tea, honey, olive oil and other premium categories
  • Differentiating varieties, breeds or production systems (organic vs conventional, grass-fed vs grain-fed, free-range vs cage)
  • Metabolomics for food fraud detection in oils, dairy, meat, juices and other vulnerable products
  • Detecting adulteration and dilution with cheaper ingredients or undeclared species
  • Developing research-level models for halal authenticity metabolomics and other label claims

We generate robust metabolic fingerprints and use chemometrics to highlight the markers that best separate authentic and non-authentic samples, supporting your authenticity strategy and method development.

Food Safety & Spoilage Research

Our food safety metabolomics capabilities support early-stage research and concept development in safety and spoilage control.

You can use our platform to:

  • Monitor metabolic changes during microbial growth and spoilage in different food matrices
  • Study toxin formation pathways and stress responses under various storage or processing conditions
  • Explore multi-class contaminant screening concepts using high-resolution LC–MS data
  • Identify chemical indicators of early spoilage that may complement existing microbiological tests

Processing, Formulation & Process Optimization

Use untargeted and targeted metabolomics for process optimization when you want to understand how technology and recipe choices shape the final product.

We support R&D teams to:

  • Compare processing technologies (e.g. pasteurization vs UHT, baking vs frying, extrusion, fermentation, drying) at a metabolite level
  • Evaluate recipe and formulation changes (sugar reduction, fat replacement, fiber enrichment, clean-label reformulations)
  • Track key metabolites across unit operations and process steps to identify critical points of change
  • Link formulation and processing factors to flavor, texture and stability outcomes

Nutritional & Functional Food Research

Our nutritional metabolomics for functional foods provides a detailed view of the small molecules that contribute to nutritional and functional value.

Typical applications include:

  • Profiling bioactive compounds (polyphenols, flavonoids, amino acids, peptides, organic acids, SCFAs) in foods and ingredients
  • Assessing how processing, storage and packaging affect nutrient density and bioactive profiles
  • Supporting dietary intervention and functional product studies (e.g. plant-based foods, fortified drinks, botanical extracts) with rich metabolite data
  • Comparing different raw materials, ingredient suppliers or formulations from a nutritional metabolite perspective

Why Choose Our Food Metabolomics Services?

  • Built for Food Matrices
    Extraction efficiency and signal stability optimized for complex foods—typically 20–40% higher feature recovery than generic biological protocols.
  • Statistically Powered Study Design
    We calculate effect size and replicate needs upfront, helping reduce unnecessary samples by 15–30% while maintaining statistical confidence.
  • Quantified, Decision-Ready Outputs
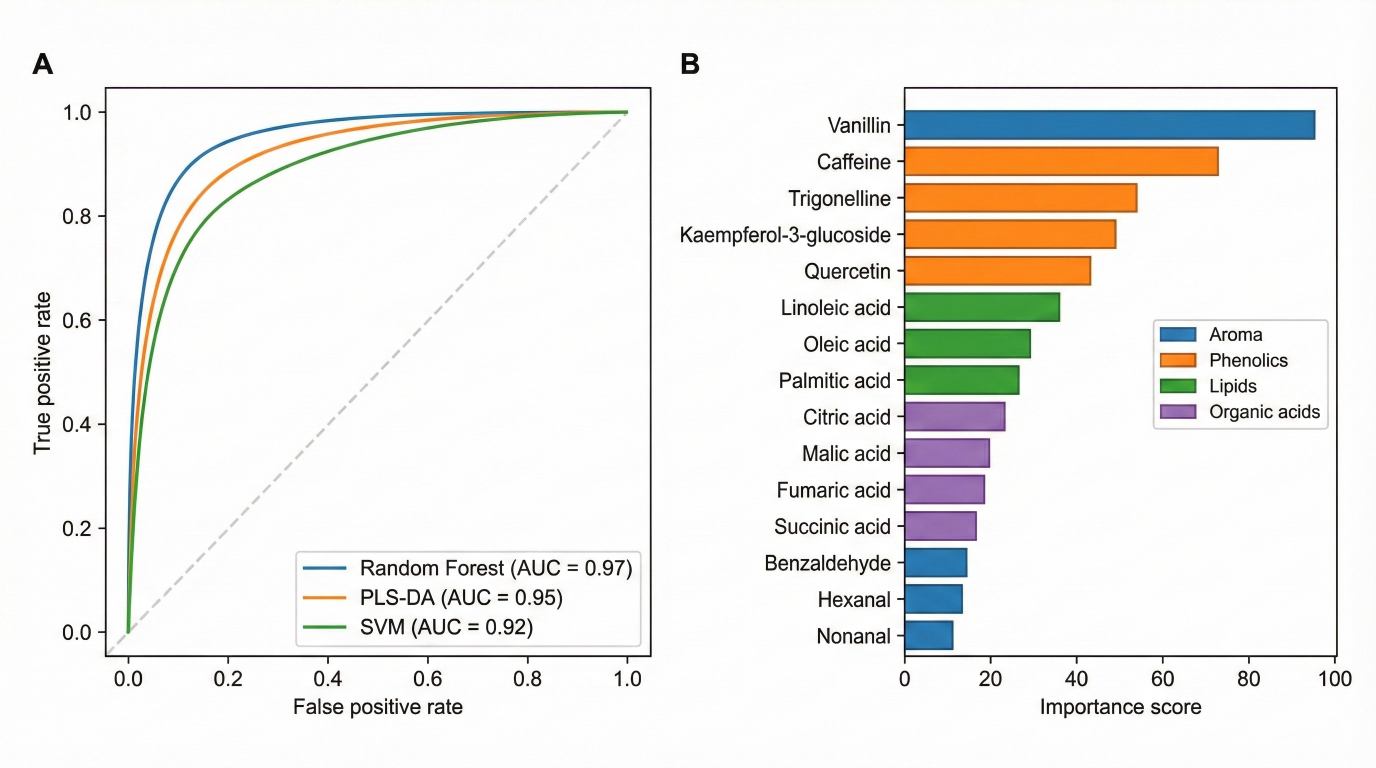
    Every project includes fold-changes, ranked markers, and validated models (e.g., 70–90% classification accuracy in multi-origin studies), not just raw feature lists.
  • Reliable Multi-Factor Insights
    Our workflow handles origin × process × storage designs with >90% batch alignment consistency, allowing clean interpretation across complex variables.
  • Seamless Discovery-to-Target Workflow
    Untargeted to targeted confirmation stays within one pipeline—typically cutting verification time by 25–40% compared with switching vendors.

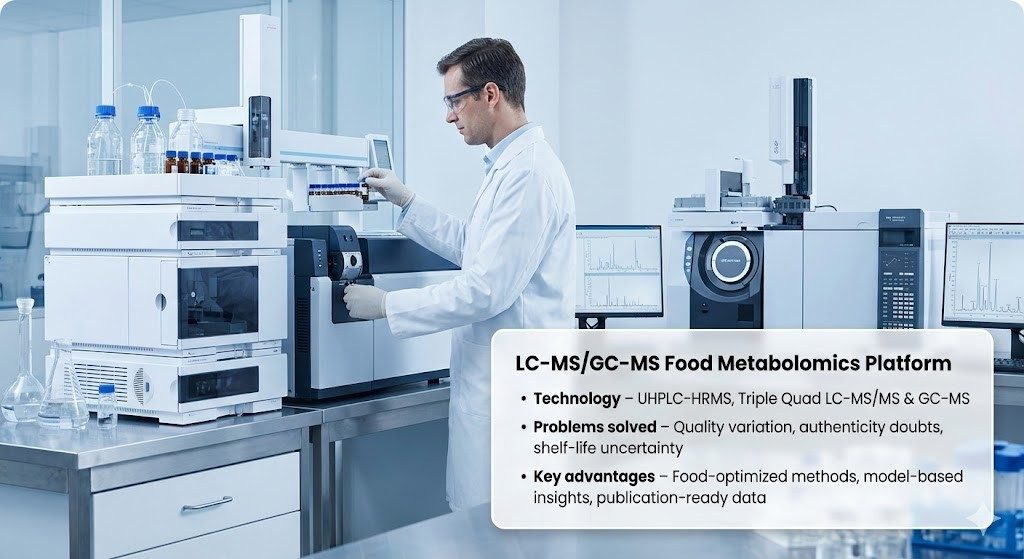
High-Performance LC–MS/GC–MS Platform for Food Metabolomics

UHPLC–HRMS (Q-TOF & Orbitrap-class)

  • Mass accuracy: ≤ 1–3 ppm
  • Resolving power: 60,000–120,000 FWHM
  • MS/MS acquisition: up to 20 Hz (DDA & DIA modes)
  • Typical untargeted runs: 3,000–8,000+ features per sample (matrix-dependent)

Triple Quadrupole LC–MS/MS (Targeted Panels)

  • LOQs typically in the low ng/mL range
  • Quantification linearity: R² ≥ 0.995
  • Intra-batch precision: RSD < 10% for most targets
  • Ideal for confirmation and routine quantitation of key markers discovered in untargeted studies

GC–MS / GC–MS/MS for Volatiles

  • Optimized for aroma & off-flavor markers
  • Comprehensive EI libraries for compound matching
  • Retention-index alignment for robust comparisons
  • Supports flavor & oxidation profiling

QC & Sample Preparation Architecture

  • Pooled QCs every 8–10 samples
  • Drift correction keeps variability <15% across batches
  • Internal standards for RT & mass-accuracy control
  • Extraction recovery often 20–40% higher than generic protocols
Agilent 1260 Infinity II HPLC

Agilent 1260 Infinity II HPLC (Figure from Agilent)

Agilent 6495C Triple quadrupole

Agilent 6495C Triple quadrupole (Figure from Agilent)

Thermo Fisher Q Exactive

Thermo Fisher Q Exactive (Figure from Thermo Fisher)

7890B Gas Chromatograph + 5977 Single Quadrupole

Agilent 7890B-5977A (Figure from Agilent)

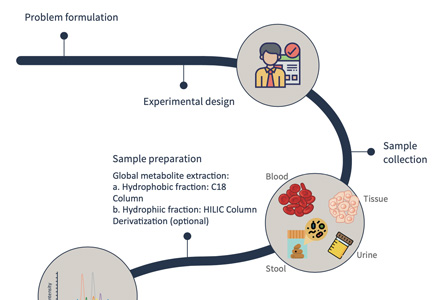
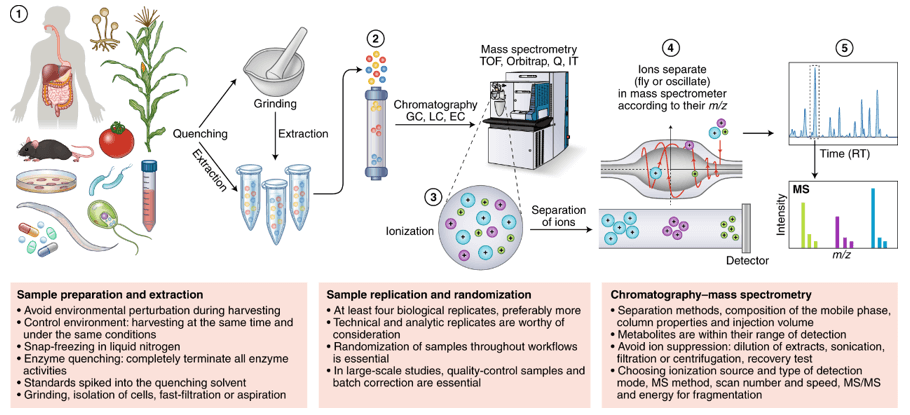
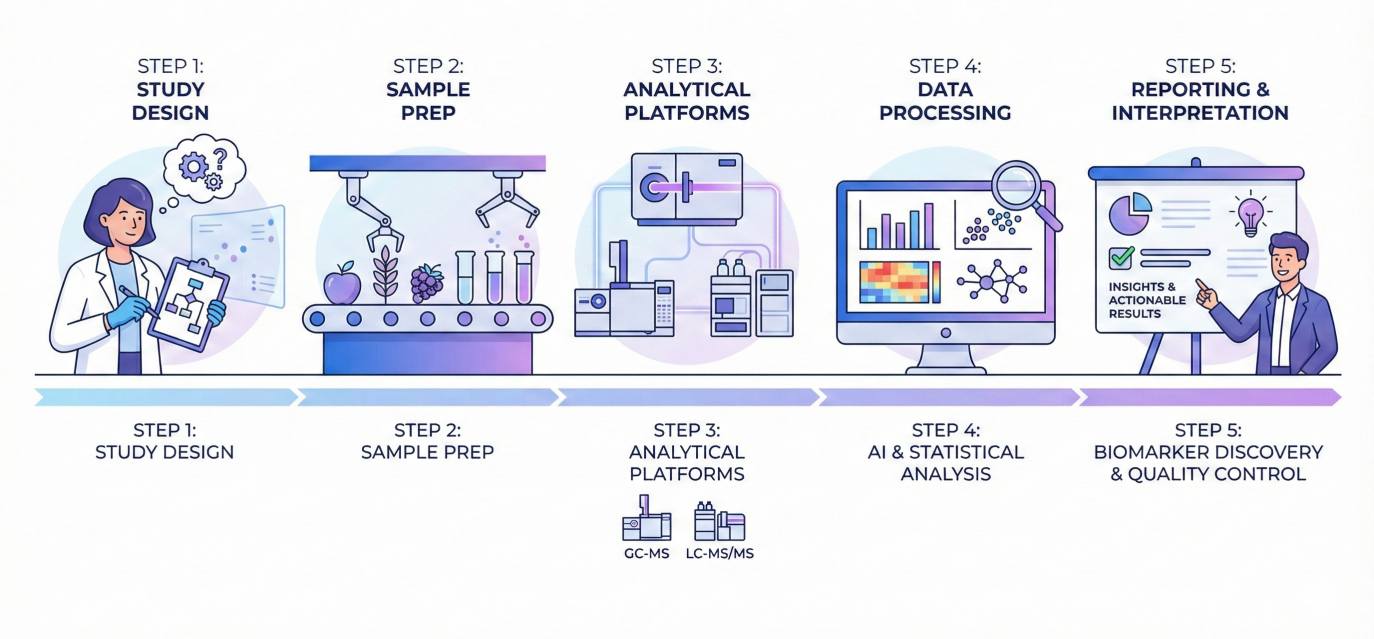
How Our Food Metabolomics Service Works

Food Metabolomics Workflow

Sample Submission Requirements for Food Metabolomics

Sample Types & Minimum Amount

Sample type Recommended minimum amount
Solid / semi-solid foods 10–20 g per sample
Liquids / beverages 20–50 mL per sample
Extracts / concentrates 1–2 mL or 50–100 mg per sample

Handling, Storage & Shipping

Item Recommendation Notes
Containers Use clean, inert polypropylene tubes/bottles; avoid glass for frozen shipment where possible Remove packaging, stones, metal pieces and other obvious foreign materials
Sample preparation Mix heterogeneous products thoroughly to obtain a representative aliquot If grinding/homogenizing, avoid contamination from tools (e.g., metal shavings, plastic dust)
Storage before shipping Store perishable samples at –20 °C or below; high-fat/unstable matrices preferably at –80 °C Minimize freeze–thaw cycles; aliquot if you expect multiple uses
Labeling Clearly label each tube with a sample ID matching your sample list Avoid full project names or confidential info on labels
Shipping conditions Ship frozen samples on dry ice in insulated containers; stable dry products may go ambient Please confirm ambient shipment suitability with us before sending

Deliverables: What You Receive from Food Metabolomics Analysis

  • Raw LC–MS/MS or GC–MS data files (by agreement)
  • Processed data matrices (features × samples)
  • Statistical outputs: PCA/PLS-DA plots, volcano plots, heatmaps, VIP scores and more
  • Tables of candidate biomarkers with detailed meta-information
  • A comprehensive report, ready to be used in internal decision-making, presentations or manuscripts
  • Optional follow-up meeting to discuss results and next steps (e.g. validation experiments or targeted assays)
PCA plot with food samples clustered by origin and processing.

PCA scores plot separating food samples by origin and processing (PC1 + PC2 explain 48.3% variance).

Heatmap of metabolite abundance patterns across grouped food samples.

Hierarchical clustering heatmap of key metabolites grouping samples by origin and processing/storage conditions.

Volcano plot showing significant metabolite changes between two processes.

Volcano plot of differential metabolites between two processing conditions, highlighting significantly up- and downregulated markers.

Two-panel figure with ROC curves and a bar chart of key metabolite importances.

Food authenticity models and markers: (A) ROC curves with AUCs; (B) top metabolites ranked by importance.

What kinds of questions can food metabolomics actually answer?

Food metabolomics is best when you need to know how and why samples differ at the molecular level—for example between origins, processes, storage times or formulations. It has been widely used to study food quality, authenticity, safety, shelf-life and nutritional composition in a single analytical framework.

How is food metabolomics different from conventional food chemistry tests?

Conventional tests usually focus on a small set of predefined indicators (e.g., fat, moisture, a few vitamins or contaminants). Food metabolomics instead measures hundreds to thousands of metabolites at once, then uses chemometrics to find the patterns and markers that explain quality, authenticity or process effects.

Which sample types can be used for food metabolomics services?

Most food and ingredient matrices can be profiled, including raw materials (grains, fruits, vegetables), processed foods, beverages, extracts and intermediates. In practice, the main constraints are matrix complexity and how well the sample can be homogenized and frozen, not the food category itself.

How many samples do I need for a meaningful food metabolomics study?

You need enough samples to capture true biological or process variation, not just analytical noise. In the literature, food metabolomics studies typically use multiple independent batches per group (e.g., different lots, farms or production runs) so that multivariate models and statistics are robust rather than overfitted.

Can food metabolomics really distinguish authentic and adulterated products?

Yes—multiple reviews show metabolomics can successfully separate authentic vs adulterated or mislabeled foods (wine, olive oil, honey, meat, dairy, etc.) using LC–MS/GC–MS fingerprints plus chemometrics. These models identify characteristic marker metabolites that reflect origin, species or process differences.

How reliable and reproducible are metabolomics results for food applications?

With proper QC samples, internal standards and drift correction, metabolomics platforms routinely achieve low relative standard deviations and stable clustering of QC injections, which is why they are now widely used in food quality and authenticity research. We apply similar QC logic so that differences you see between groups reflect real sample biology or processing, not instrument fluctuation.

Can you link food metabolomics data with my existing sensory or QC measurements?

Yes. Food metabolomics is often combined with sensory scores, physical–chemical tests or shelf-life data to build models that connect metabolite changes with flavor, texture, stability or defect rates. This integrative approach is now common in food quality optimization and flavor research.

Is food metabolomics suitable only for big studies, or also for pilots?

It works for both. Many groups start with a focused pilot to check whether metabolite fingerprints can separate their key groups (e.g., origins, processes, storage times), then scale up to larger studies or targeted panels once promising markers are found.

Multiomics of a rice population identifies genes and genomic regions that bestow low glycemic index and high protein content

Badoni, S., Pasion-Uy, E. A., Kor, S., Kim, S. R., Tiozon Jr, R. N., Misra, G., ... & Sreenivasulu, N.

Journal: Proceedings of the National Academy of Sciences

Year: 2024

DOI: https://doi.org/10.1073/pnas.2410598121

Comparative metabolite profiling of salt sensitive Oryza sativa and the halophytic wild rice Oryza coarctata under salt stress

Tamanna, N., Mojumder, A., Azim, T., Iqbal, M. I., Alam, M. N. U., Rahman, A., & Seraj, Z. I.

Journal: Plant-Environment Interactions

Year: 2024

DOI: https://doi.org/10.1002/pei3.10155

Physiological, transcriptomic and metabolomic insights of three extremophyte woody species living in the multi-stress environment of the Atacama Desert

Gajardo, H. A., Morales, M., Larama, G., Luengo-Escobar, A., López, D., Machado, M., ... & Bravo, L. A.

Journal: Planta

Year: 2024

DOI: https://doi.org/10.1007/s00425-024-04484-1

Effects of Aronia melanocarpa juice-powder on hindgut function and performance in post-weaned pigs

Pearce, S. C., Anderson, C. L., & Kerr, B. J.

Journal: Journal of Functional Foods

Year: 2024

DOI: https://doi.org/10.1016/j.jff.2024.106196

Prospective randomized, double-blind, placebo-controlled study of a standardized oral pomegranate extract on the gut microbiome and short-chain fatty acids

Sivamani, R. K., Chakkalakal, M., Pan, A., Nadora, D., Min, M., Dumont, A., ... & Chambers, C. J.

Journal: Foods

Year: 2024

DOI: https://doi.org/10.3390/foods13010015

For Research Use Only. Not for use in diagnostic procedures.
inquiry

Get Your Custom Quote

Connect with Creative Proteomics Contact UsContact Us
return-top