Single-Cell vs. Global Cell Metabolomics
A global cell metabolomics measurement returns the average of every cell in the sample, and that average is
dominated by whichever cell type is most abundant or most metabolically active. A resistant subpopulation, a
rare progenitor, or a few cells that respond to a drug while their neighbors do not will all disappear
inside that mean. Single cell metabolomics exists to recover the differences that averaging destroys.
The measurement is technically harder than a population-scale analysis for three reasons: the amount of
each metabolite in one cell is orders of magnitude below what a conventional assay consumes, the pool turns
over faster than most preparation workflows take, and the act of separating cells can itself perturb the
metabolism being measured. Each of those problems is addressed in the design of the workflow rather than in
the analysis afterwards.
Because a single cell yields a small analyte pool, the information that comes back is different in kind
from a population-level profile: fewer metabolites measured with certainty, but each one attributable to an
identified cell and to a position in a cluster. Where a global profile of cultured cells is what a project
needs, a cell metabolomics service is
the more efficient route; where the question is how cells differ within a tissue, the spatial dimension is
handled by spatial metabolomics
instead.
Service Modules — Isolation, Microscale Extraction & Acquisition
Projects arrive at different stages. Some need the whole chain from live cells to a per-cell table, some
already have sorted populations frozen and ready, and some need a targeted assay on cells that were isolated
elsewhere. The service is organized so that a project can enter at whichever step matches its current state.
Single Cell Isolation and Sorting
Cells are separated by fluorescence-activated cell sorting, magnetic bead sorting, laser microdissection
from tissue sections, or microfluidic capture, depending on the sample and on how much material the
downstream assay can tolerate. The isolation method is chosen for the analyte class and for the amount of
stress it imposes on the cell, and the gating strategy is recorded so that the population being sampled is
defined rather than assumed.
Quenching and Microscale Extraction
Metabolite pools change within seconds, so quenching has to happen faster than the turnover it is meant to
freeze. Cells are washed cold and flash-frozen immediately after isolation, then extracted in a minimal
volume with isotopically labeled internal standards spiked before any analyte can be lost. Extraction volume
is scaled to the sample so that the extract stays concentrated enough to inject.
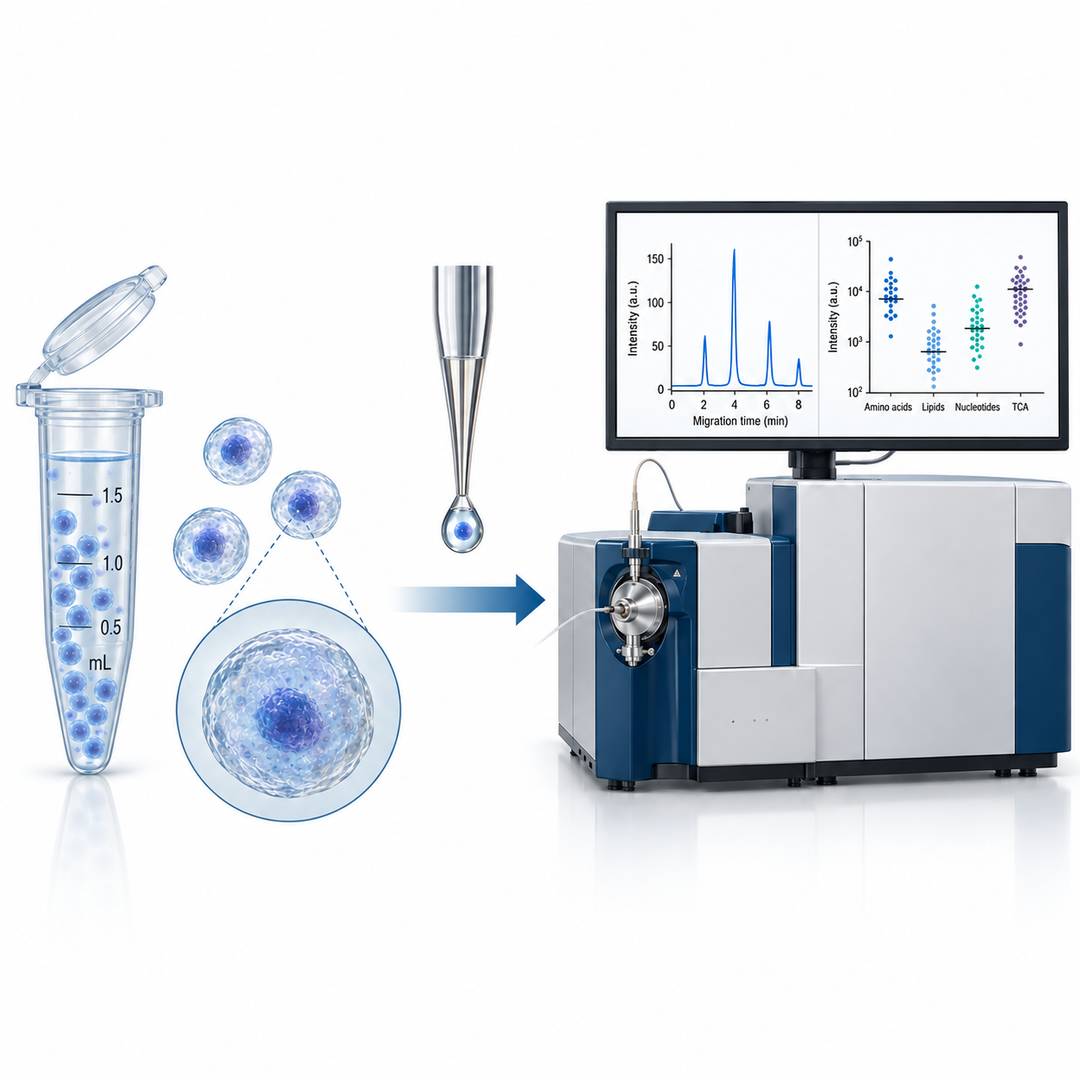
CE-ESI-MS for Charged and Polar Metabolites
Capillary electrophoresis coupled to electrospray ionization mass spectrometry separates metabolites by
charge and hydrodynamic radius in a capillary rather than on a column, which suits the small, polar, and
often charged species that dominate central metabolism. The separation needs very little sample volume,
which is the property that makes it work at the single cell level.
Microflow LC-MS/MS for Targeted and Untargeted Panels
Microflow liquid chromatography with tandem mass spectrometry covers the analytes that CE handles poorly,
including many lipids and neutral compounds, and supports scheduled multiple reaction monitoring when a
defined panel is being quantified. High-resolution acquisition is used where the question is which
metabolites are present rather than how much of a known list is there.
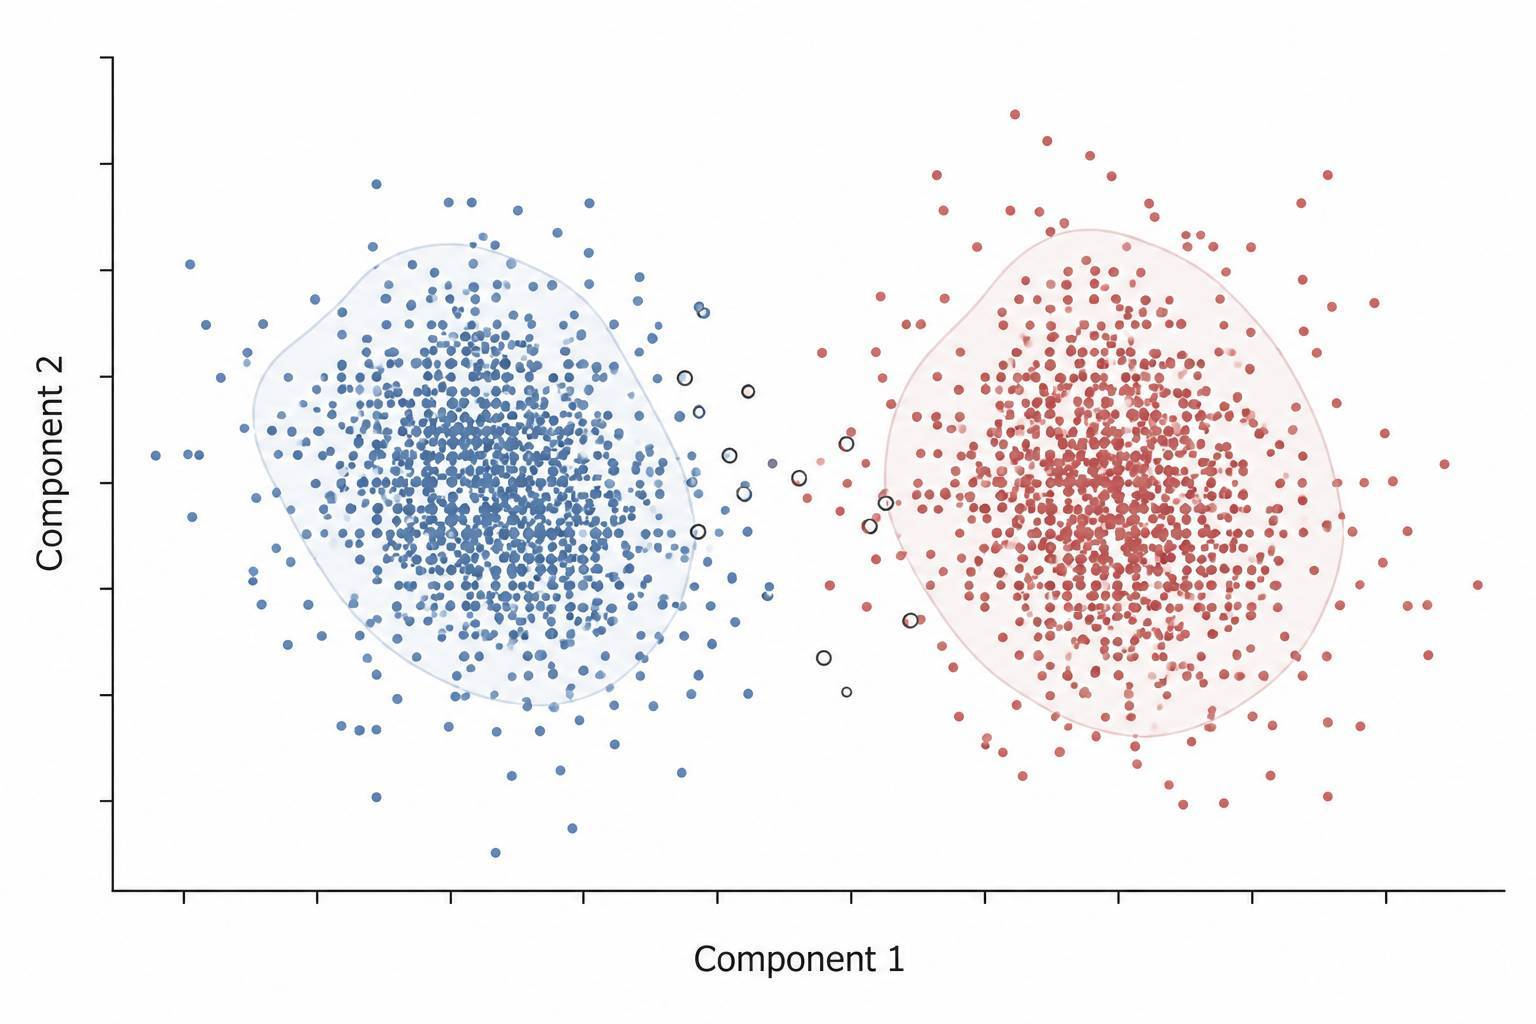
Per-Cell Data Processing and Interpretation
Raw data are processed to a per-cell feature table, normalized against the internal standards and the
pooled QC samples run in the same batch, and then analyzed by dimensionality reduction such as PCA, UMAP, or
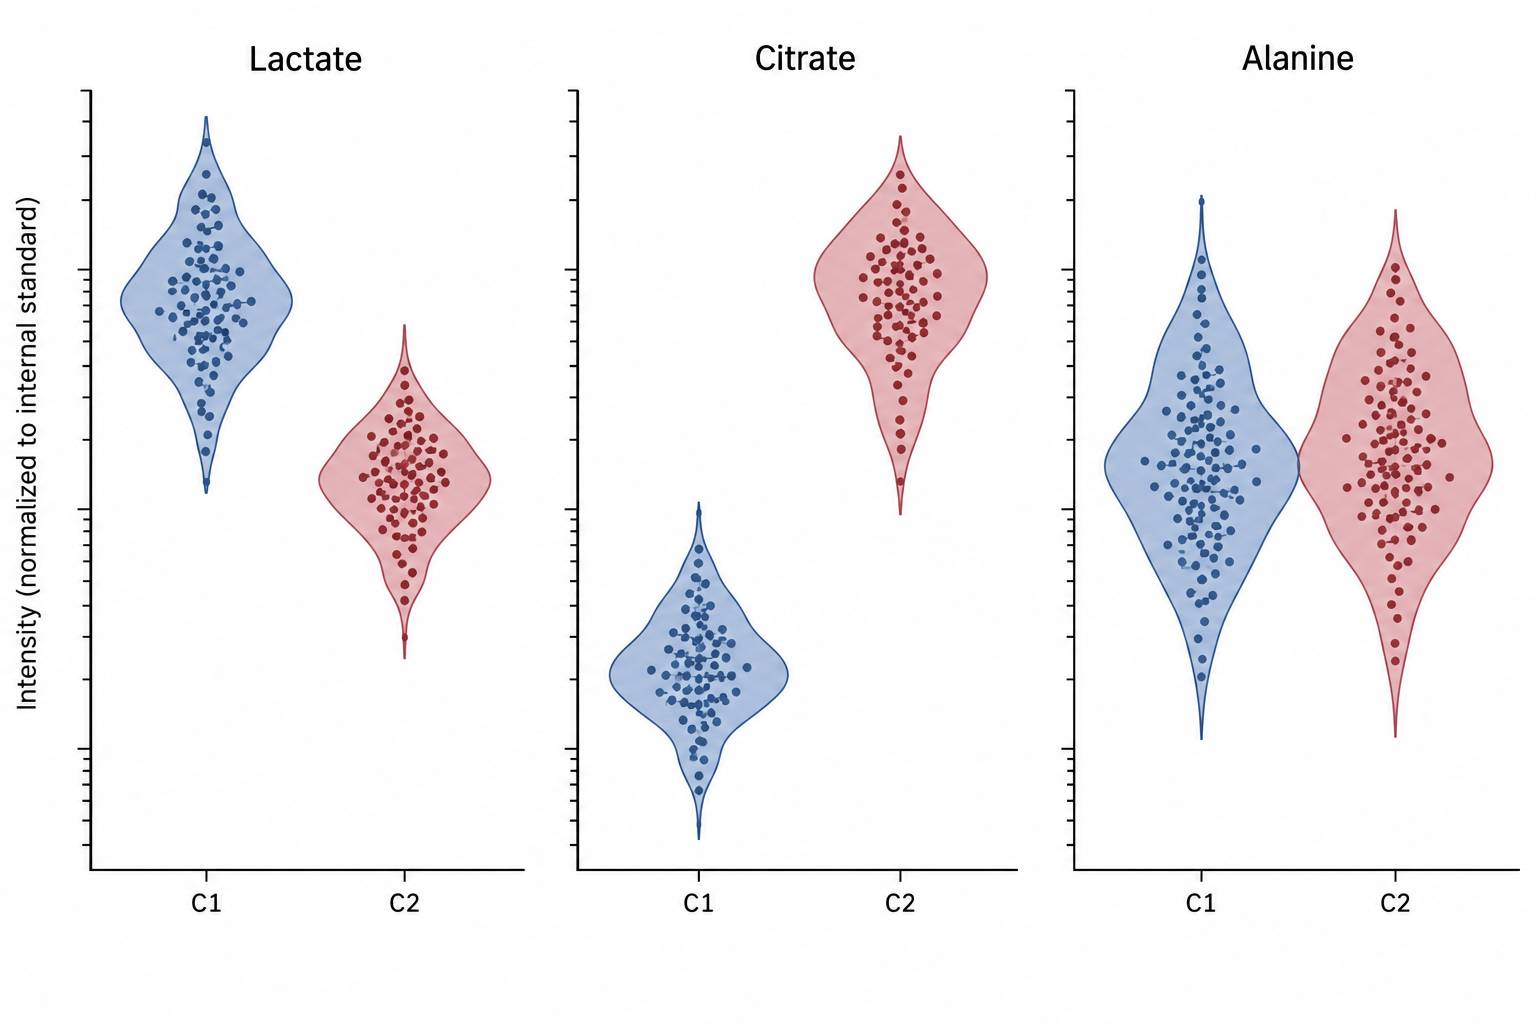
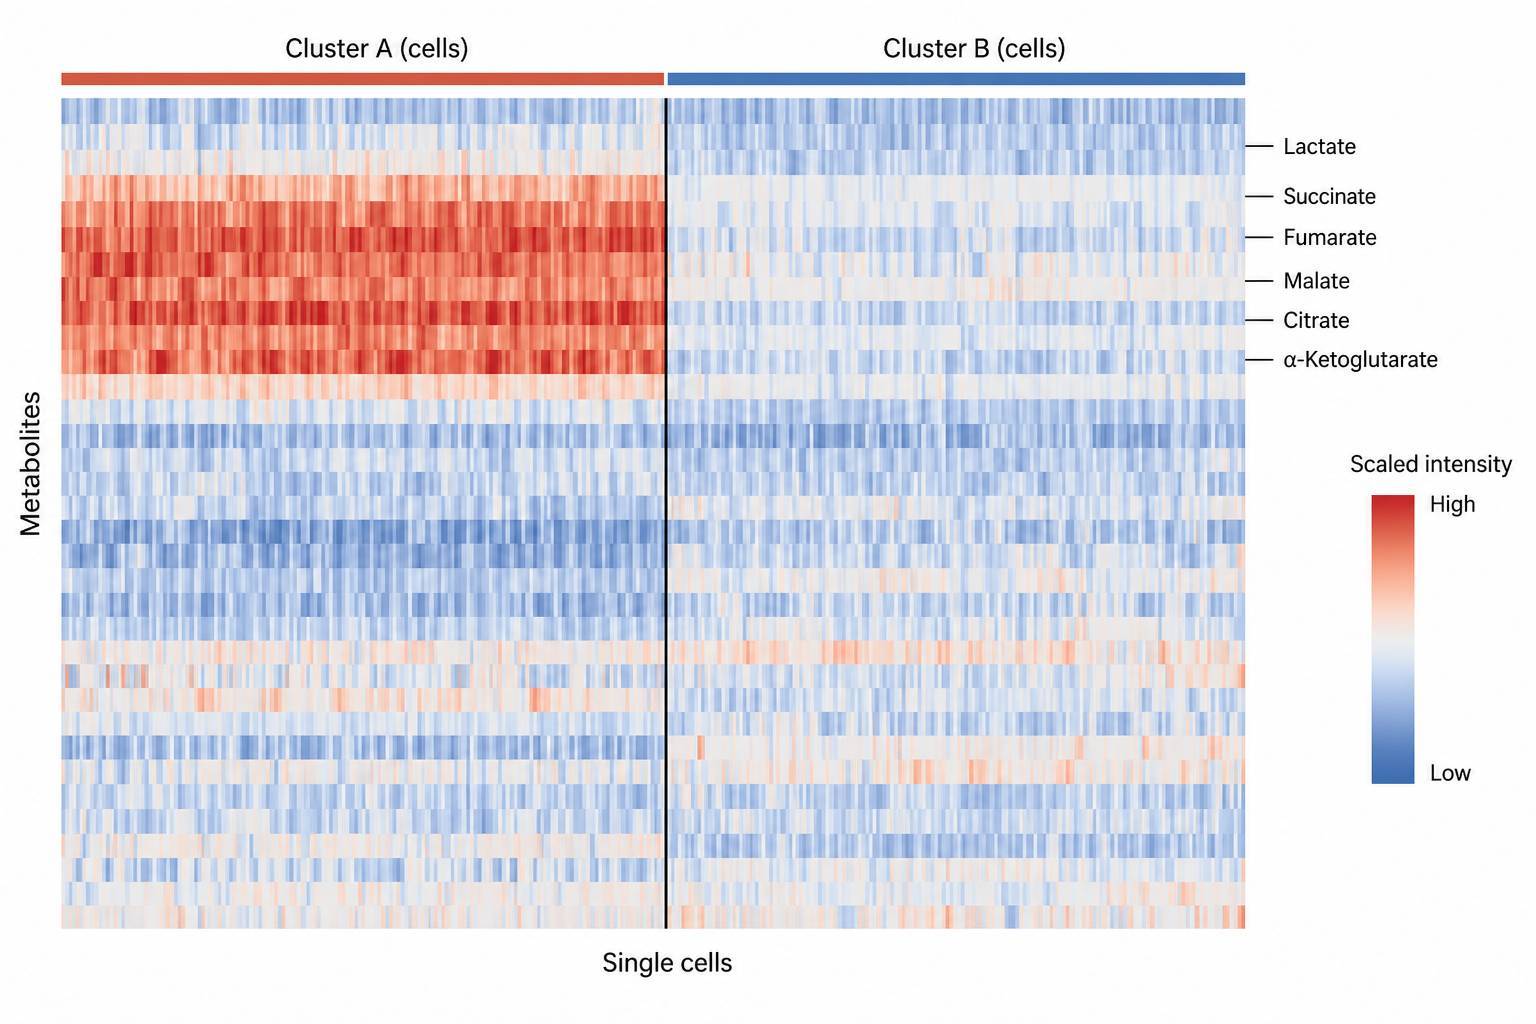
t-SNE, followed by clustering, differential metabolite testing between clusters, and mapping of the
discriminating metabolites onto pathways. Cell-level metadata from the sorting gate is carried through so
that a cluster can be described by the markers that defined it.
| Service Module |
Question It Answers |
Typical Readout |
| Isolation and sorting |
Which cells were measured, and how were they defined |
Sorting gate or dissection coordinates, viability, recovery, and cell-level metadata per analyzed
cell |
| Quenching and extraction |
Is the measured pool the pool that existed in the cell |
Quenching time, extraction volume, internal standard response per sample |
| CE-ESI-MS |
What are the charged and polar metabolites in this cell |
Migration time, mass-to-charge ratio, and intensity per metabolite per cell |
| Microflow LC-MS/MS |
How much of a defined panel is present, or what else is there |
Scheduled MRM peak areas for panel analytes, or high-resolution feature table for discovery |
| Data processing |
Which cells group together, and what separates them |
Per-cell feature matrix, clustering assignment, and discriminating metabolites mapped to pathways
|
Key Challenges in Single-Cell Metabolomics and How We Solve Them
- Analyte amounts far below conventional assay needs — A single cell holds an amount of
each metabolite that is orders of magnitude below the loading of a routine population-level measurement,
and a method transferred directly from population-level workflows returns a chromatogram dominated by
baseline. We scale extraction volume to the sample, select the separation technique that tolerates the
smallest injection, and confirm detection with standards run at single-cell equivalent amounts rather than
assuming that a method validated on larger samples still works.
- Metabolite turnover faster than the preparation — Glycolytic intermediates and energy
cofactors can shift measurably while cells are being counted, gated, or transferred, so a slow workflow
reports the stress of isolation rather than the state of the cell. Quenching is done cold and immediately
after isolation, and the elapsed time between sorting and freezing is recorded for every batch so that a
batch with an extended sort can be identified and interpreted rather than silently averaged in.
- Isolation stress that changes the metabolism being measured — Enzymatic dissociation,
shear forces in a sorter, and extended time in a collection tube all alter the metabolite pool, and the
effect differs between cell types. We compare sorted cells against cells recovered under gentler
conditions, include a short recovery step where the biology allows it, and report the isolation method
alongside the data so that the direction of any isolation effect is known.
- Ion suppression and matrix at very small volumes — At microliter extraction volumes,
salts, culture medium carryover, and the small-molecule background of the separation system are
proportionally larger and can suppress ionization for the analytes of interest. Salt and medium carryover
are controlled during the cold wash, the separation is chosen to move analytes away from the salt region,
and suppression is monitored with spiked standards rather than assumed to be uniform across cells.
- Normalization without a shared internal standard per cell — Every cell carries a
slightly different amount of material, and normalizing by cell volume, protein, or total signal each
introduce their own assumptions. Isotopically labeled standards are added to the extraction of every cell,
pooled QC samples are run at intervals across the batch, and the normalization actually used is stated so
that a between-cluster difference can be compared with a between-batch one.
- Separating biology from stochastic variation — Two cells of the same type never give
identical numbers, and cell cycle phase, stochastic gene expression, and measurement noise all contribute
to that spread. The analysis reports the technical spread measured from replicate injections and reference
cells next to the biological spread between cells, so a genuine subpopulation is not declared on the basis
of variation that the method itself produces.
Metabolites We Quantify at the Single-Cell Level
Coverage is organized by metabolite class, because the class determines both the separation technique and
how confidently a single-cell measurement can be interpreted. Classes are combined within one acquisition
where the chemistry allows it, and the measured list is reported per cell with its annotation level.
| Metabolite Class |
Representative Analytes |
Typical Separation and Detection |
| Glycolytic and gluconeogenic intermediates |
Glucose 6-phosphate,
fructose 1,6-bisphosphate, glyceraldehyde 3-phosphate, phosphoenolpyruvate, pyruvate, lactate |
CE-ESI-MS in negative mode; phosphorylated species resolved by charge |
| Central carbon and tricarboxylic acid cycle metabolites |
Citrate, isocitrate,
α-ketoglutarate, succinate, fumarate, malate, oxaloacetate |
CE-ESI-MS and microflow LC-MS/MS; complements central carbon metabolism panels run on pooled cell populations |
| Amino acids and biogenic amines |
Glutamate, glutamine, aspartate, serine, glycine, alanine, GABA, taurine |
CE-ESI-MS; derivatization-based microflow LC-MS/MS where higher sensitivity is required |
| Nucleotides and energy
cofactors |
ATP, ADP, AMP,
GTP, NAD+, NADH, NADP+, NADPH, coenzyme A |
CE-ESI-MS and ion-pairing microflow LC-MS/MS with scheduled multiple reaction monitoring |
| Redox metabolites |
Glutathione,
glutathione disulfide, cysteine, cystine, and related thiols |
Microflow LC-MS/MS for the reduced and oxidized pair measured in the same cell extract |
| Lipids and fatty acids |
Selected free fatty
acids, acylcarnitines, and glycerophospholipid
species |
Microflow LC-MS/MS; the class that CE-ESI-MS covers least well and that sets the choice of
platform |
| Neurochemicals and signaling metabolites |
Dopamine, serotonin,
norepinephrine, acetylcholine and its precursors |
Microflow LC-MS/MS at high sensitivity, most often applied to individually dissected neurons |
Analytical Platform & Method for Single-Cell Analysis
The platform choice follows from the analyte class and from how much material the isolation step can
deliver, not from a fixed workflow. A charged, polar panel and a lipid panel from the same experiment are
therefore acquired on different systems, and the results are merged at the per-cell data level.
Instrumentation
| Platform |
Separation and Detection |
Best Suited For |
| SCIEX CESI 8000+ CE-ESI-MS |
Capillary electrophoresis with electrospray ionization; separation by charge and hydrodynamic
radius at nanoliter injection volumes |
Charged and polar metabolites: central carbon intermediates, phosphorylated sugars, amino acids,
nucleotides |
| SCIEX QTRAP 6500+ with microflow LC |
Scheduled multiple reaction monitoring on a triple quadrupole; polarity switching within a single
acquisition |
Targeted quantification of a defined panel, including redox pairs and energy cofactors |
| SCIEX TripleTOF 6600+ with microflow LC |
High-resolution accurate-mass acquisition with data-dependent tandem mass spectra |
Untargeted screening of a small number of cells, metabolite identification, and panel design for
later targeted work |
Method Controls
Every batch carries the controls that make a per-cell comparison interpretable. Isotopically labeled
standards are added to each extraction before the analyte can be lost. Pooled QC samples prepared from the
same cell population are injected at intervals, so that instrument drift can be separated from biological
spread, and extraction and matrix blanks bound the background contributed by reagents and the separation
system. Replicate injections of a reference extract then quantify the technical spread that the reporting
subtracts from the spread between cells.
Where a defined panel is being quantified, calibration is built with matrix-matched standards at amounts
typical of a single cell rather than extrapolated from a calibration curve built for larger sample amounts.
Where that panel is the specific need, targeted metabolomics workflows provide the same quantitative framework for
larger cell numbers. Discovery work is run in the same laboratory, so a metabolite first seen by untargeted metabolomics can be moved
into a scheduled assay without transferring methods between sites.
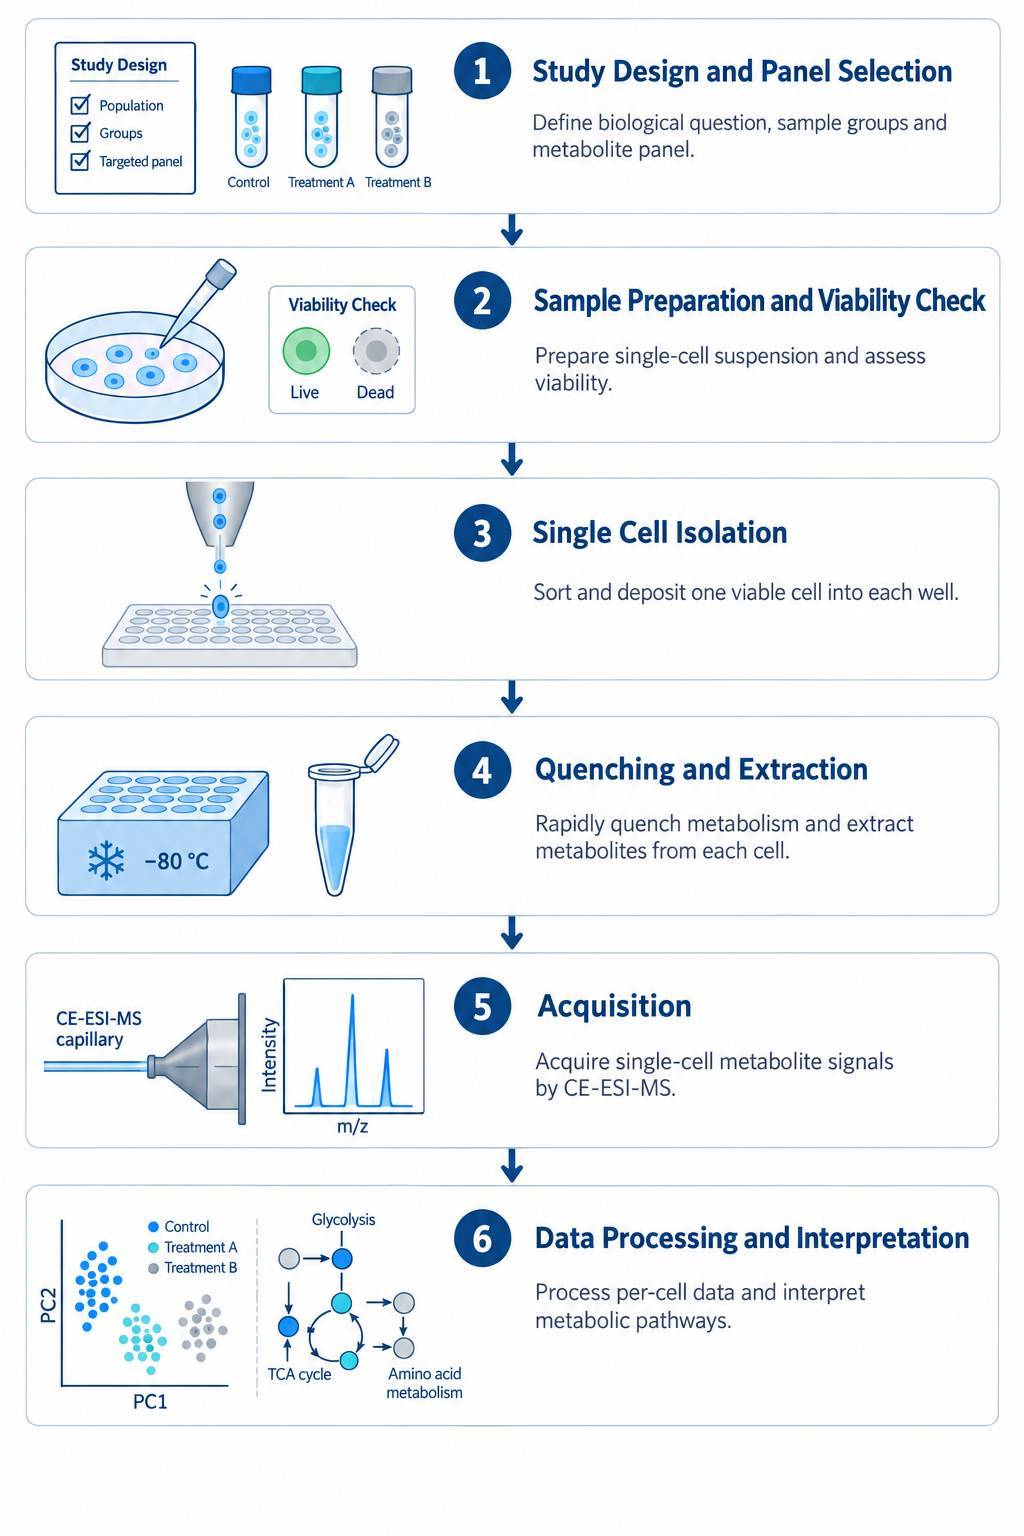
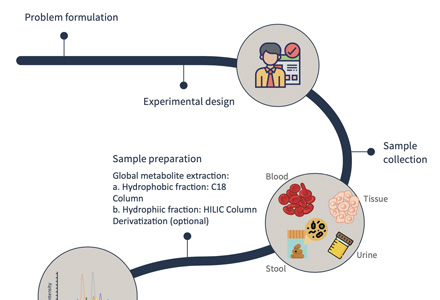
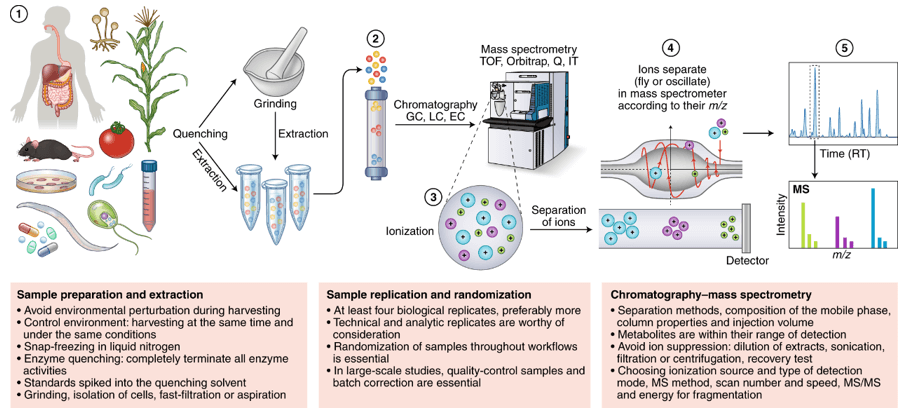
Single Cell Metabolomics Workflow
Sample Types & Cell Preparation Requirements
The service accepts live or freshly isolated cells, frozen sorted populations, and tissue sections for
dissection-based isolation. Requirements below are the general case; a project that works with fewer cells
than listed can still be assessed, because the limiting factor is the analyte class rather than the cell
number alone.
| Sample Type |
Typical Starting Material |
Preparation Notes |
Storage and Shipping |
| Cultured cell lines |
≥ 1 × 10⁶ cells per condition |
Detach with the gentlest method available, wash free of medium, and keep the interval between
harvest and quench as short as possible |
Live cells shipped on the day of harvest, or quenched and flash-frozen for shipment on dry ice
|
| Primary single-cell suspensions |
≥ 1 × 10⁶ cells per condition |
Dissociate with an enzyme and duration chosen per tissue; filter and count before shipping so the
sorting gate can be planned |
Dry ice; avoid repeated freeze–thaw cycles |
| Sorted or labeled populations |
Depends on population frequency |
State the targeting markers and the expected frequency; a rare population may require a
pre-enrichment step before sorting |
Cell pellets frozen immediately after sorting, or sorted directly into a quench solution where the
workflow allows |
| PBMCs and blood-derived cells |
≥ 5 × 10⁶ cells per condition |
Isolate within the stability window of the anticoagulant used and provide the collection tube type
|
Live for sorting, or frozen in aliquots with a validated freezing protocol |
| Tissue sections for dissection |
≥ 3 sections per condition |
Fresh-frozen sections preferred; state the thickness, embedding medium, and whether regions are
marked for dissection |
Dry ice or vapor-phase nitrogen; sections must not thaw in transit |
| Organoids and 3D cultures |
Depends on the model and target population |
Dissociate to single cells, or send intact cultures for sectioning if the spatial context of the
cells matters to the question |
Live cultures shipped on the day of harvest where possible |
- Viability is checked before sorting, and a preparation below the agreed viability threshold is reported
rather than carried forward, because dead and dying cells give a metabolite profile that reflects
degradation
- For workflows that require sorting, the starting cell number is what matters rather than the number
analyzed: isolation consumes most of the material, so the input has to account for the cells that will be
lost at the gate
- Include the sample metadata sheet: origin, treatment arm, time point, harvest method, and any handling
condition that differed between samples
- Do not submit fixed or permeabilized cells for metabolite measurement, because fixation and
permeabilization remove or redistribute the small-molecule pool being measured
- If you are sending processed data for analysis only, also send the raw acquisition files where
available, together with the internal standard used and the normalization that has already been applied
Single Cell Metabolomics Deliverables — What You Receive
- Per-cell feature table — Measured metabolites with
intensity, migration time or retention time, mass-to-charge ratio, and annotation confidence level, one
row per analyzed cell, delivered in Excel and CSV.
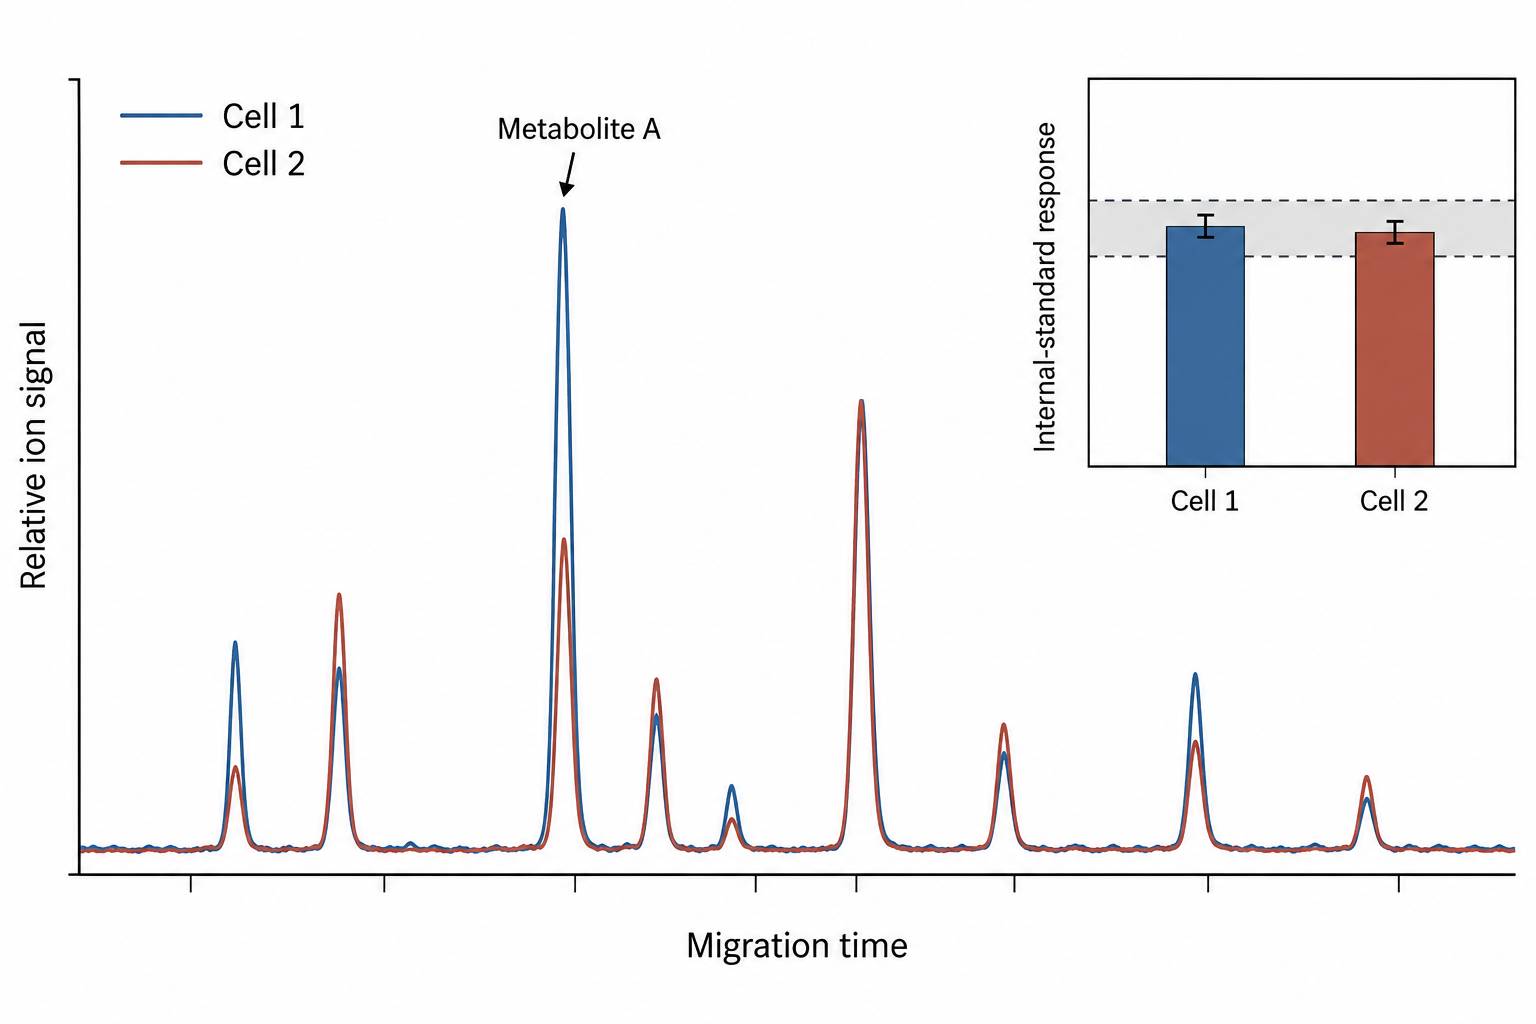
- Internal standard response table — Response of the labeled
standards per cell extract, which is the evidence that the extraction and the injection behaved
consistently across the batch.
- Clustering and dimensionality reduction — Cluster
assignment and PCA, UMAP, or t-SNE projections with the cell-level metadata from the isolation gate
carried through.
- Differential metabolite results — Per-cluster comparisons
with fold changes, the statistical test applied, and the correction used, listed with the direction of
change for every contributing metabolite.
- Pathway mapping — Discriminating metabolites mapped onto
curator databases with the database name and release stated, so enrichment can be reproduced.
- Quality control report — Technical spread from replicate
injections and pooled QC samples, batch drift, blank levels, and the number of cells that passed quality
criteria relative to the number analyzed.
- Methods documentation — Isolation method and parameters,
quenching and extraction volumes, instrument settings, internal standards, and the normalization applied,
written so that the analysis subsection can be assembled from the report.
Representative Data
Applications of Single Cell Metabolomics
For projects that already hold a per-cell dataset, metabolomics data analysis can be carried out on the submitted matrix, and the
wider service portfolio is described under metabolomics services.


 Contact Us


