What Lipid Metabolism Analysis Measures
The panel reports the pools that lipid metabolism moves material between, showing direction of change
rather than abundance alone: fatty acids split by esterification state and chain structure, the glycerolipid
and phospholipid species that carry them, the sterol and bile acid routes that dispose of them, and the
acylcarnitine, ketone, and oxidized mediator readouts downstream. Concentrations, ratios, and the
normalization basis arrive together, so a difference can be attributed to a pathway rather than to sample
handling.
Six steps carry most of the information. Supply covers exogenous fatty acids and the fraction synthesized
from acetyl-CoA. Activation and esterification describe how acyl chains are committed to storage through
glycerol-3-phosphate acylation and diacylglycerol acyltransferase, or to membranes through the Kennedy pathway. Storage
and mobilization are read from triacylglycerol and diacylglycerol species against the free fatty acid pool.
Oxidation is read from mitochondrial import, where long-chain acylcarnitines are the carrier, and from the
β-oxidation output. Remodeling
is read from lysophospholipid-to-phospholipid ratios and sphingolipid species; disposal from bile acids and
oxidized lipid mediators.
Two limits shape how the data should be read. A concentration describes pool size, not the rate at which
material moves through it: an oxidation inhibitor can raise long-chain acylcarnitines without changing how
much fat the tissue burns. Lipid pools are also compartmentalized, so a tissue homogenate averages lipid
droplets against membranes and lipoprotein cargo. Both limits are stated in the report rather than left to
be discovered after publication.
The Lipid Pools We Quantify and What Each One Reports
The panel is organized by pathway rather than by compound class, so the analyte list matches the decision
the study has to make. Segments are selected at study design; there is no requirement to run all of them,
and each is quantified independently to absolute concentration.
| Pool or Node |
Representative Analytes |
What It Reports |
|
Fatty acyl pool
|
Free fatty acids (FFA) and total fatty acids after hydrolysis, reported as separate values;
saturated and monounsaturated species; the n-3 and n-6 families reported through their parent
species — alpha-linolenic acid, linoleic acid, and arachidonic acid; products of unsaturated
fatty acid biosynthesis, including trans isomers, odd-chain species, and very-long-chain
species |
Supply and mobilization. The free fraction carries the metabolic signal — adipose release,
lipotoxicity, ligand availability — while the esterified fraction reports stored and structural
material. |
|
Glycerolipid storage pool
|
Triacylglycerol, diacylglycerol, and monoacylglycerol species resolved by acyl chain composition
|
Esterification and storage load, plus the intermediate that accumulates when the last acylation
step is rate-limited. The same triacylglycerol mass can be built from different acyl combinations,
so species are reported individually rather than as a class sum. |
|
Membrane phospholipid pool
|
Phosphatidylcholine, phosphatidylethanolamine, phosphatidylserine, phosphatidylinositol,
phosphatidic acid, lysophospholipids, plasmalogens, and cardiolipin where required |
Remodeling and membrane composition, including the phosphatidic acid and diacylglycerol
intermediates shared with the storage route. Positional information on the acyl chains is available
where the study needs it. |
| Sphingolipid pool |
Ceramides by chain length, sphingomyelin, hexosylceramides, sphingosine, and
sphingosine-1-phosphate |
Stress and death signaling that runs in parallel with acyl-chain handling. Because the free and
esterified forms behave differently, the ratio of sphingosine-1-phosphate to its precursors is
reported rather than each value alone. |
| Sterol pool |
Cholesterol, cholesteryl esters, lathosterol, desmosterol, 7-dehydrocholesterol, plant sterols,
oxysterols, and — where the study needs them — the steroid hormones derived from cholesterol |
Whether cholesterol is being synthesized or absorbed, and how much has been converted to oxidized
derivatives. Mevalonate pathway intermediates are reported as synthesis precursors rather than as a
summary sterol value. |
|
Bile acid pool
|
Primary and secondary species in free and glycine- or taurine-conjugated form, with
12α-hydroxylated and non-12α-hydroxylated species distinguished |
Hepatic disposal of cholesterol and the microbial contribution to the circulating pool.
Conjugation state must be preserved, so species are quantified individually rather than as total
bile acids. |
|
Mitochondrial import and oxidation
|
Acylcarnitines reported species by species with free carnitine as the denominator, plus
β-hydroxybutyrate and acetoacetate |
How much acyl chain enters the mitochondrion and whether oxidation completes. The chain-length
distribution localizes a defect, which is why the profile is reported as a spectrum rather than a
total. |
|
Oxidized lipid mediators
|
Enzymatically derived oxylipins covering cyclooxygenase, lipoxygenase, and cytochrome P450
products, with isoprostanes, malondialdehyde, and 4-hydroxynonenal as non-enzymatic markers |
Signal output at the boundary between lipid pools and oxidative stress. These analytes require
their own extraction and their own aliquot, so that enzymatic and autoxidative products stay
distinguishable. |
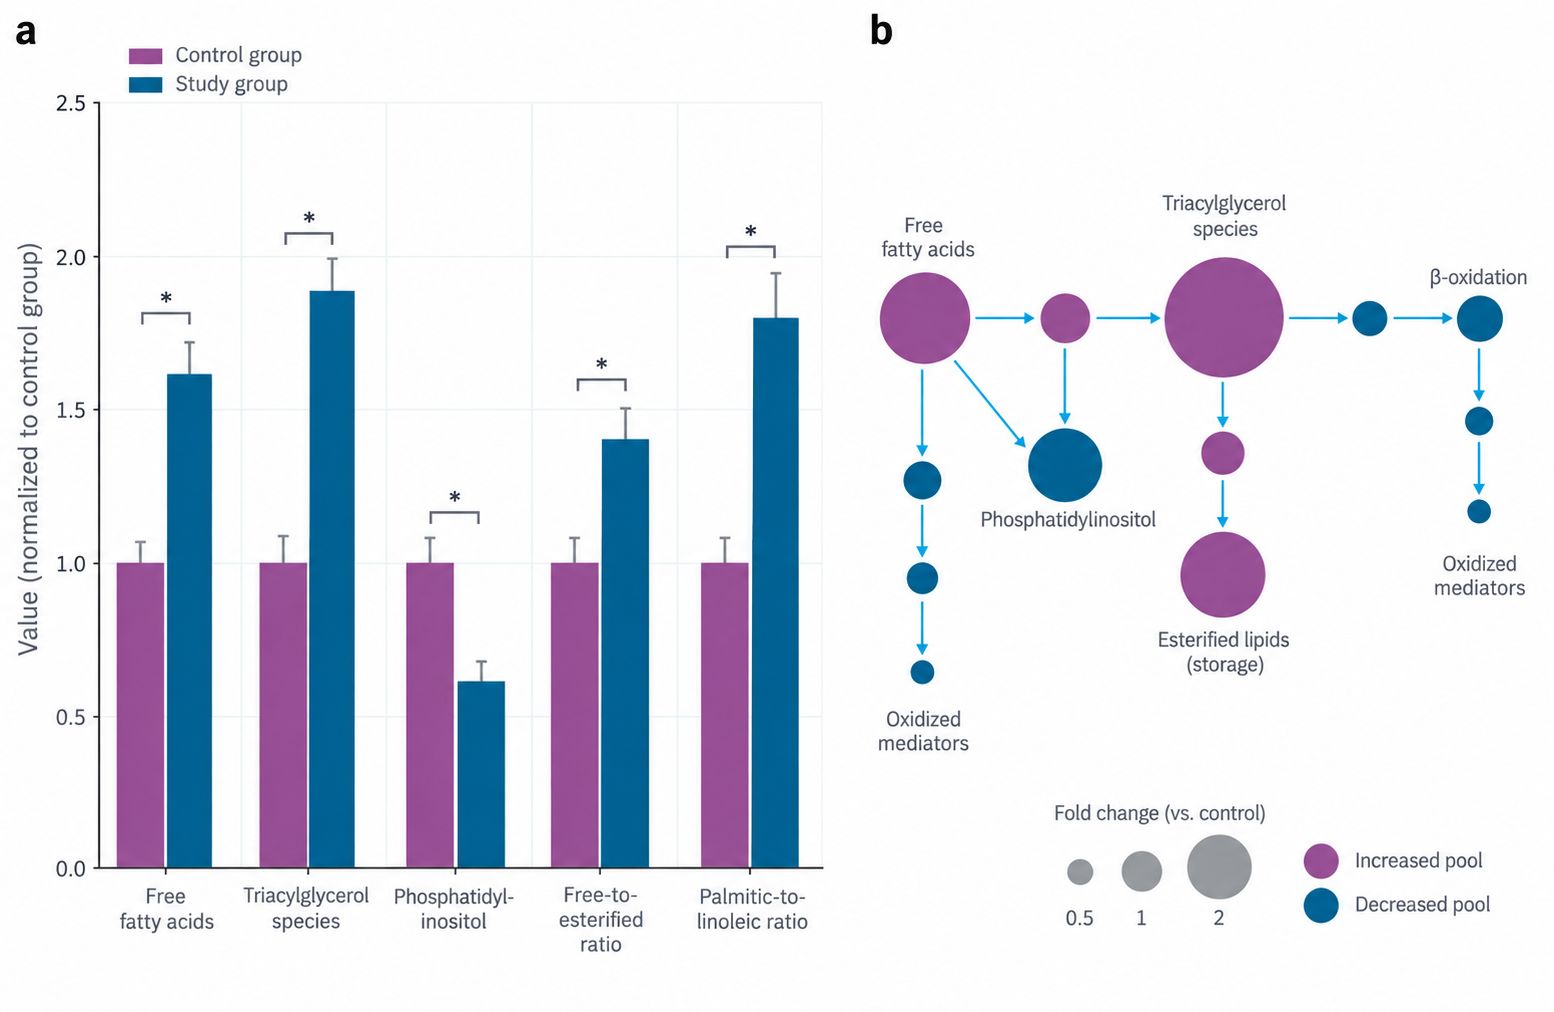
Where a study needs only the free fraction measured against the esterified fraction — the comparison that
separates adipocyte mobilization from impaired re-esterification — the same analytes are reported as a free fatty acid panel, with both
fractions derived from one extraction. Feasibility, working range, and the achievable limit of
quantification are confirmed per matrix before samples are processed.
Key Challenges in Lipid Metabolism Analysis and How We Solve Them
- Free and Esterified Fatty Acids Reported as One Value — A hydrolyzed total fatty acid
value is the simplest number to produce and the wrong one for a metabolism question: the free fraction is
a small percentage of the total, so the change that matters for insulin resistance and lipotoxicity barely
registers. We quantify both fractions from one extraction with isotope-labeled standards and report the
free-to-esterified ratio.
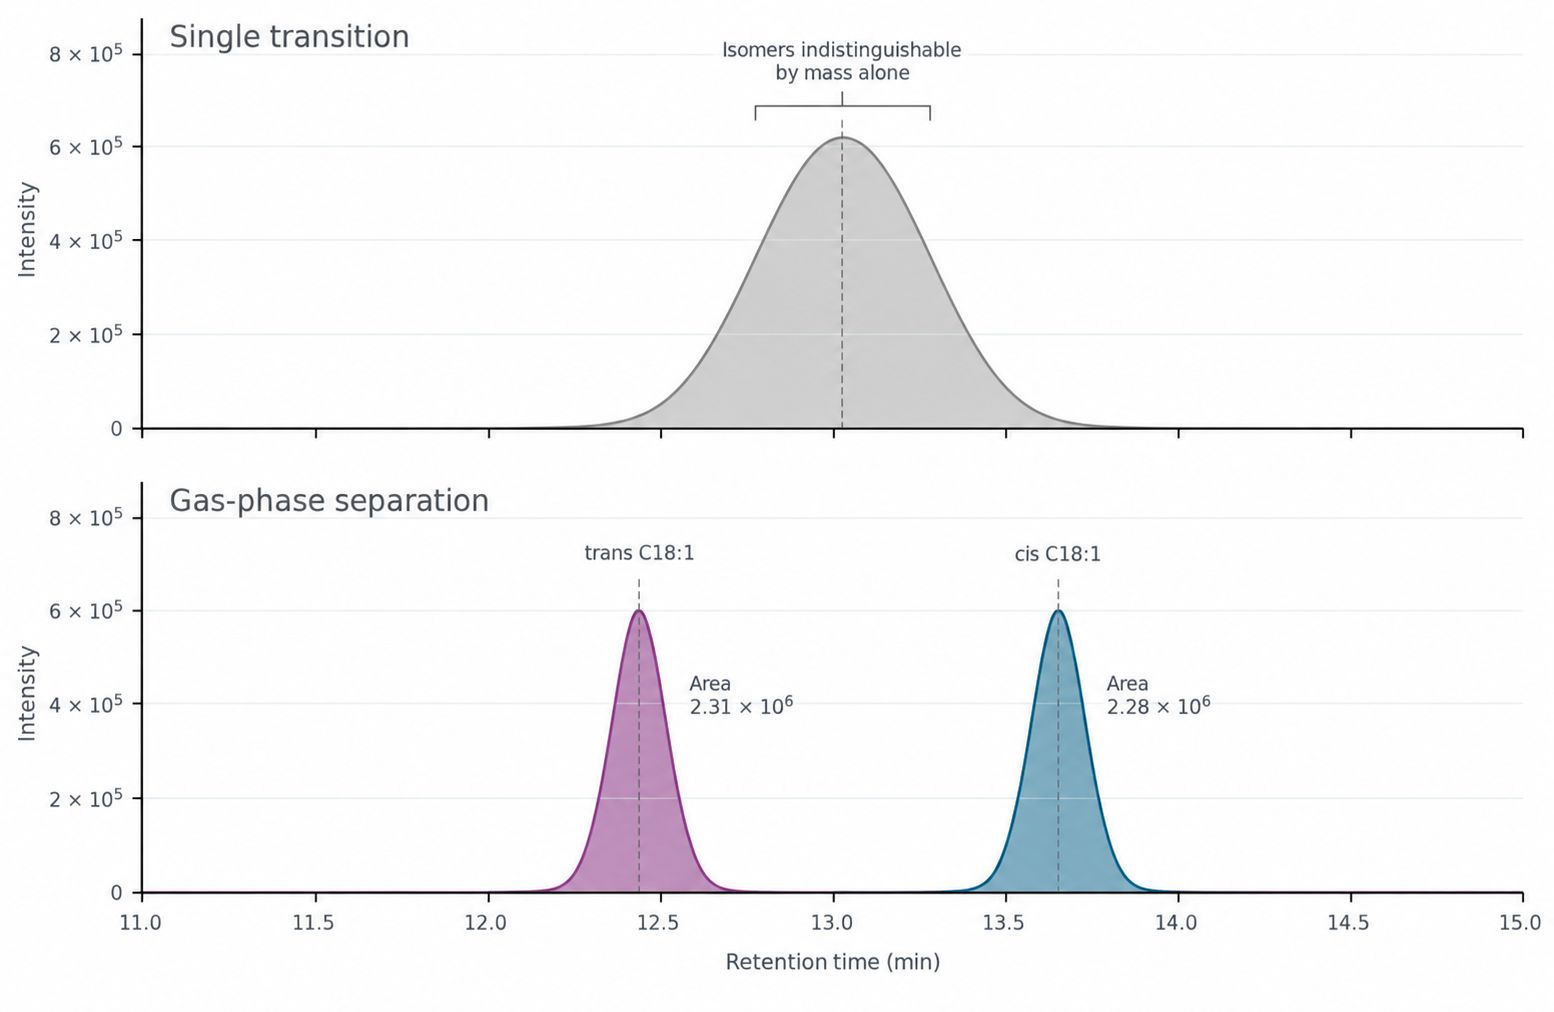
- Positional and Geometric Isomers Co-Elute — Two lipid species can share a molecular
formula, a precursor ion, and a product ion while differing in acyl placement or geometry: phospholipase
A2 acts on sn-2, and cis and trans C18:1 have the same mass but are not equivalent dietary markers.
Neither pair separates on a single MRM transition, so we resolve them by C30 reversed-phase gradients and
gas-phase separation of methyl esters.
- Oxidized Lipids Form During Processing, Not in the Sample — Oxylipins and oxysterols
sit at low nanomolar concentrations and are generated enzymatically in vivo, so oxidation after collection
is indistinguishable from biology; polyunsaturated fatty acids generate isoprostane and aldehyde artifacts
on exposure to air, light, or repeated thawing. Antioxidant and chelator are assigned per matrix, samples
are frozen in single-use aliquots, and non-enzymatic markers are acquired alongside the enzymatic
products.
- Acylcarnitines Lose Their Meaning as a Single Sum — Carnitine carries activated fatty
acids across the mitochondrial membrane, and the chain length of the species that accumulates identifies
where the pathway is blocked: a block at import produces a long-chain pattern, a defect inside the
oxidation spiral leaves partially oxidized species of intermediate length. Summing them into a total
acylcarnitine value discards that information. We quantify individual species against free carnitine
instead.
- The Normalization Basis Can Reverse a Conclusion — Lipid values are unusually sensitive
to the normalizer because lipid content varies more between samples than most metabolite classes: a result
expressed per milligram of wet weight, per milligram of protein, or per total phospholipid can move a
comparison in different directions, particularly in liver, adipose, and brain. A lipemic serum sample also
dilutes every analyte through lipid volume rather than biology. We measure the normalizer in the same
extraction.
Pathway Indices Reported With Every Dataset
Ratio-based readouts carry pathway direction that single concentrations do not, and in most designs they
are computed from analytes already being quantified. They are surrogates, not rates: each index reports
relative activity of one step under defined conditions, and none substitutes for a labeled tracer study.
Every index is computed only from analytes measured in the same batch, and the report names the samples that
entered each calculation.
| Index |
Computation |
What a Shift Indicates |
| Desaturation |
Palmitoleic acid divided by palmitic acid, and oleic acid divided by stearic acid |
Relative stearoyl-CoA desaturase activity, the step that sets membrane fluidity and the substrate
pool for esterification. Widely used in liver and adipose models where the enzyme is a therapeutic
target. |
| Elongation
|
Stearic acid divided by palmitic acid |
Whether elongation keeps pace with synthesis, and whether very-long-chain species are being
produced at the expense of C16 chains. |
| Synthesis versus dietary supply |
Palmitic acid divided by linoleic acid |
Relative de novo
lipogenesis. Linoleic acid cannot be synthesized and is supplied by diet, so an endogenous
palmitate excess dilutes it. Interpretable only when the dietary background is comparable between
groups. |
| Free-to-esterified balance |
Free fatty acids against the sum of triacylglycerol and cholesteryl ester fatty acids |
Mobilization against storage. A rise indicates lipolysis exceeding re-esterification or impaired
uptake; a fall indicates the opposite. Both fractions are quantified from one extraction. |
| Saturation balance |
Saturated species against monounsaturated plus polyunsaturated species |
Membrane ordering and the balance between elongation and desaturation output; a coarse but robust
comparator across large sample sets. |
| Cholesterol source |
Lathosterol and desmosterol divided by cholesterol for synthesis; sitosterol and campesterol for
absorption |
Where circulating or tissue cholesterol came from. Synthesis and absorption move independently, so
a single cholesterol value cannot answer the question that statin and ezetimibe studies are designed
to ask. |
|
Ketone body balance
|
β-hydroxybutyrate divided by acetoacetate |
Hepatic mitochondrial redox state and the completeness of β-oxidation, read
from the two products of the same acetyl-CoA pool rather than from one of them. |
| Bile acid conjugation |
Glycine-conjugated against taurine-conjugated species, with the 12α-hydroxylated fraction reported
separately |
Hepatic conjugation capacity and the composition of the pool returned to the gut. The ratio is
species-dependent, so all groups being compared have to be the same species. |
| Acylcarnitine pattern |
Individual species against free carnitine, with the long-chain fraction and the acetylcarnitine
fraction reported separately |
Mitochondrial import capacity against completed oxidation. A long-chain accumulation with a low
acetylcarnitine fraction indicates an import limitation rather than reduced oxidation per se. |
Analytical Platform & Method for Lipid Quantification
Platform
- Chromatographic separation — reversed-phase UHPLC with
C18 chemistry, long C30 gradients where isomeric acyl species must be resolved, and hydrophilic
interaction separation for acylcarnitines and polar lipid intermediates.
- Quantification — triple quadrupole mass spectrometry in
scheduled MRM, with positive and negative ion mode acquired in one batch so that fatty acids and their
esterified forms share a single calibration set.
- High-resolution confirmation — accurate mass
acquisition on an Orbitrap platform for species assignment and for any analyte whose identity depends
on more than a transition ratio.
- Gas-phase separation for fatty acid composition —
methyl ester derivatization with gas chromatography for chain-length profiling, cis and trans
configuration, and sterols, where volatility-based separation outperforms liquid chromatography.
- Internal standards — isotope-labeled analogues for each
lipid class, including free fatty acids, triacylglycerol, phospholipid, cholesteryl ester, and
oxylipins, spiked before extraction so that recovery and matrix effects are corrected per sample.
- Batch structure — calibration standards and pooled
quality control samples interleaved through every batch, with all groups of one comparison acquired
together and a defined position in the extraction queue.
Method Performance
| Parameter |
What We Report |
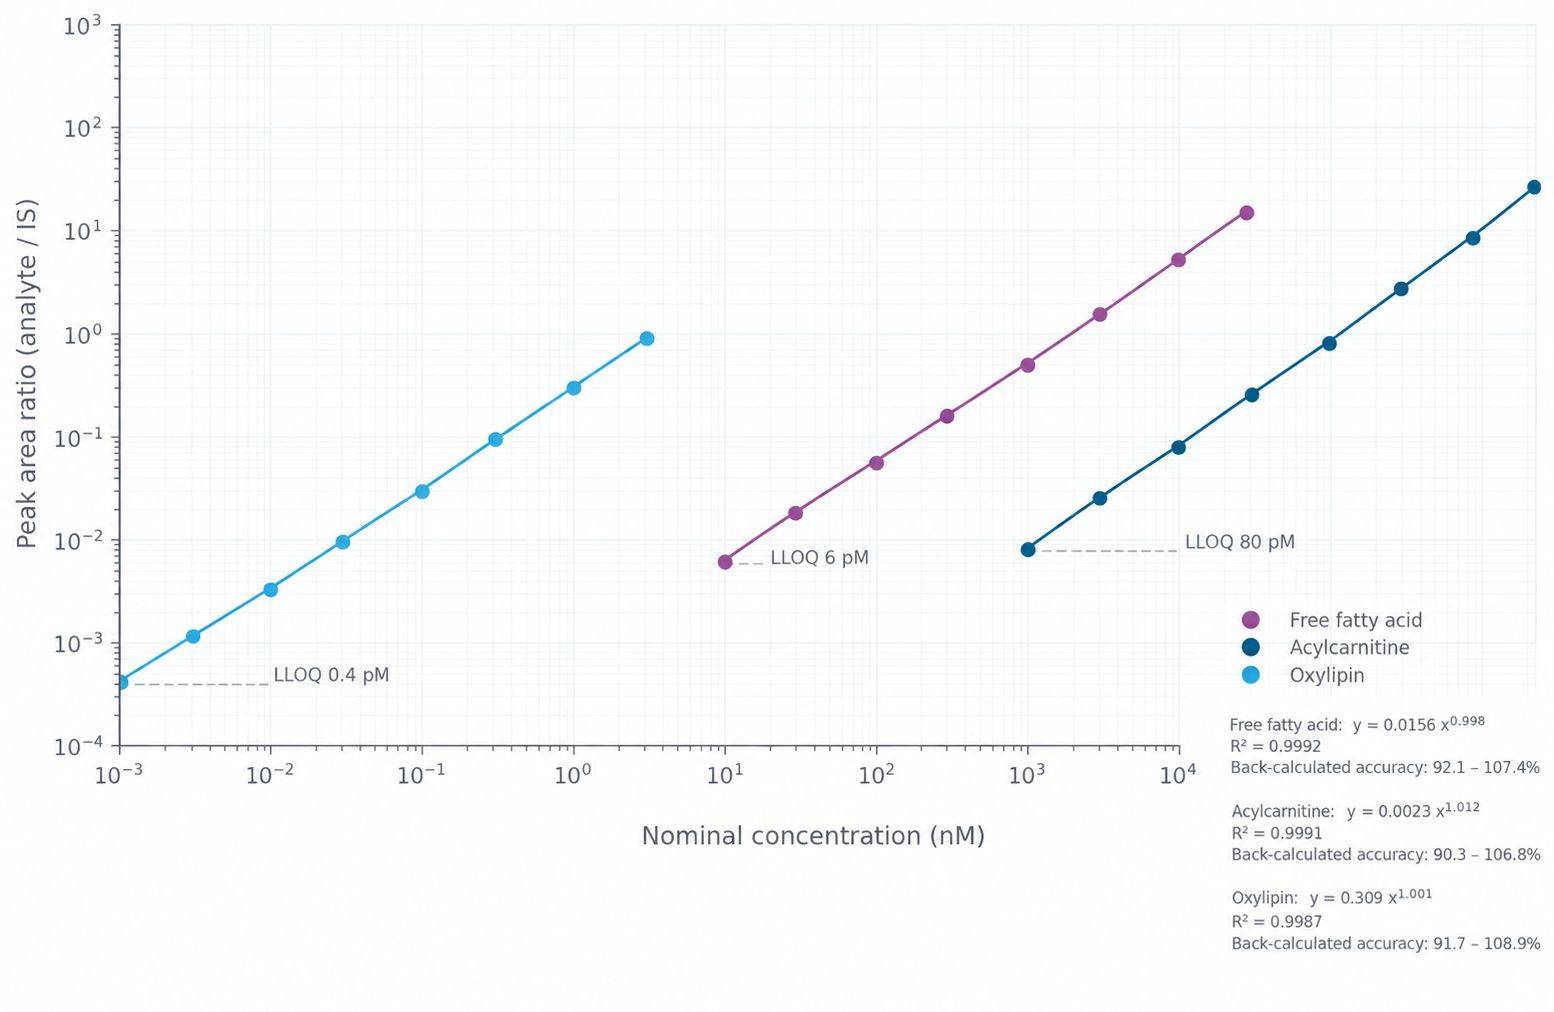
| Calibration |
Matrix-matched curves with weighted regression; R² ≥ 0.995 for analytes covered by authentic
standards, with back-calculated accuracy at every level and the working range stated per
analyte. |
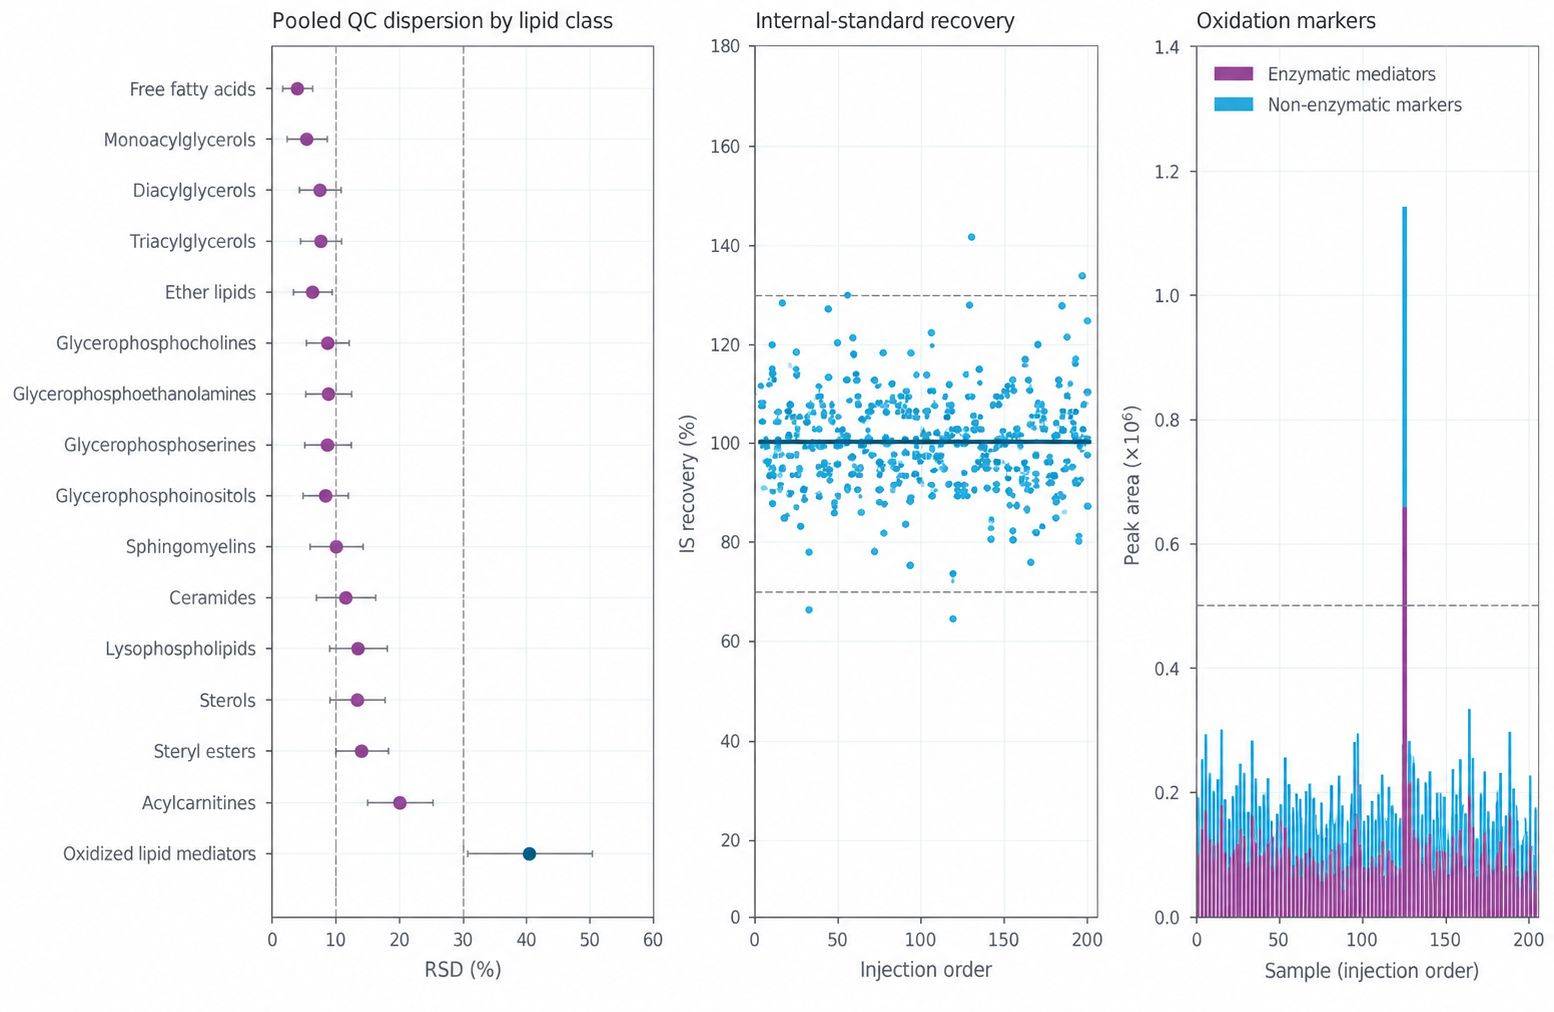
| Precision |
Replicate CV ≤ 10% for quantified lipid classes, with pooled quality control dispersion
reported per species, including the polyunsaturated species most sensitive to oxidation. |
| Accuracy |
Recovery corrected per sample against class-specific isotope-labeled internal standards spiked
at the earliest point in processing, reported alongside the uncorrected response. |
| Sensitivity |
Analyte-dependent. Free fatty acids, acylcarnitines, and bile acids are typically quantified
in the low nanomolar range, while oxidized lipid mediators are measured at picogram levels where
sample amount supports it. The limit of quantification is reported per analyte, not as a single
assay figure. |
| Isomer selectivity |
Resolution of critical pairs demonstrated in spiked matrix for every reported class, including
cis and trans C18:1, sn-positional acyl placement where it is claimed, and the ether-linked
species that overlap with their diacyl analogues. |
| Sample-level QC |
Internal standard response, retention time stability, carryover, and the oxidation marker
panel reported for every sample, so individual results can be accepted or flagged rather than
averaged into a group value. |
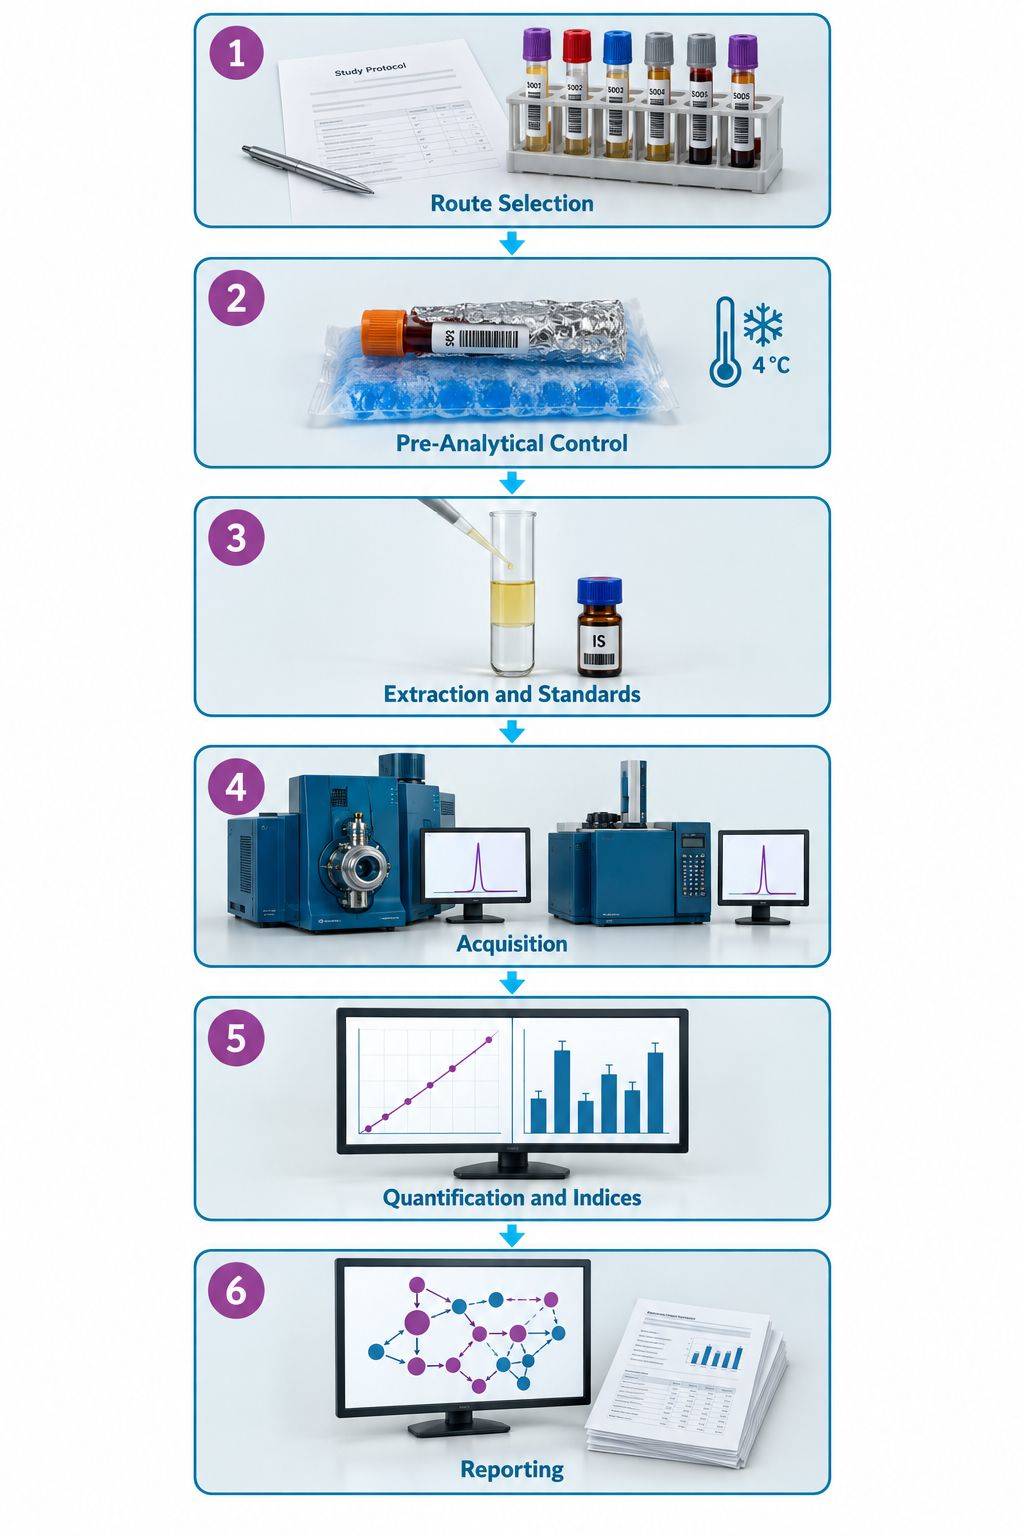
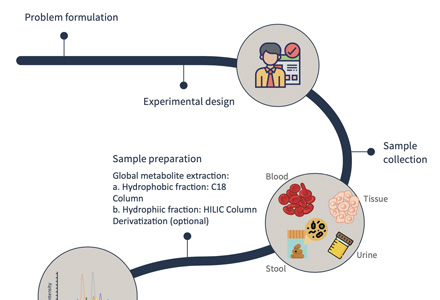
Lipid Metabolism Analysis Workflow
Sample Requirements for Lipid Metabolism Analysis
| Sample Type |
Amount Required |
Preparation Instructions |
Storage and Shipping |
| Serum / Plasma |
≥ 50 µL |
Collect in EDTA or heparin tube, centrifuge promptly, aliquot the supernatant, record fasting
state and hemolysis status; avoid holding at ambient temperature |
Store at −80°C; ship on dry ice |
| Tissue (liver, heart, muscle, adipose) |
≥ 20 mg |
Snap freeze in liquid nitrogen immediately, record wet weight before freezing, keep frozen during
dissection; lipid-rich tissue is processed at a lower input than other matrices |
Store at −80°C; ship on dry ice |
| Cultured Cells |
≥ 1 × 10⁶ cells |
Wash with cold PBS, centrifuge, remove the supernatant completely, freeze the pellet; record cell
number and, where available, protein content for normalization |
Store at −80°C; ship on dry ice |
| Cell Culture Medium |
≥ 200 µL |
Centrifuge, collect the supernatant, record the interval from medium change to collection |
Store at −80°C; ship on dry ice |
| Feces / Gut Content |
≥ 50 mg |
Aliquot promptly and freeze the aliquot rather than the bulk material; relevant where the
microbial contribution to the bile acid and short-chain pool is part of the question |
Store at −80°C; ship on dry ice |
| Urine |
≥ 200 µL |
Centrifuge to remove debris, record the collection interval, aliquot |
Store at −80°C; ship on dry ice |
| Lipid Extract |
≥ 100 µL |
State the extraction solvent and whether the extract has been dried; dried films are reconstituted
under nitrogen rather than air |
Store at −80°C under inert gas where possible; ship on dry ice |
| Plant Material |
≥ 50 mg |
Freeze in liquid nitrogen, grind while frozen, keep the powder at −80°C; oil-rich tissue requires
a lower input |
Store at −80°C; ship on dry ice |
Notes
- Keep polyunsaturated lipid samples protected from light from collection onward; photo-oxidation is fast
and the products overlap with the oxidized lipid mediator panel.
- Do not add antioxidant or chelator before confirming the buffer with us. The requirement differs between
the general lipid panel and the oxidized mediator workflow, and the wrong additive changes free fatty acid
recovery.
- Freeze in single-use aliquots. A second thaw changes free fatty acid and oxylipin values in a way that
cannot be corrected afterwards, so record freeze-thaw history for every sample.
- Record fasting state, collection time relative to feeding, and any lipid-lowering or dietary
intervention for each sample; free fatty acids, ketone bodies, and the synthesis indices all respond to
these variables.
- Submit every group belonging to one comparison together, so that extraction order and acquisition batch
cannot align with treatment group.
- State the intended normalizer — wet weight, protein, tissue lipid content, or sample volume — at study
design so it can be measured in the same extraction; a normalizer added later from a separate assay
introduces a second error term.
- Contact us before shipping samples of limited amount, such as sorted cell populations, microdialysis
fractions, or small biopsies, so that extraction and the analyte list are scaled to what is available.
- Where the same samples will also be used for oxidized lipid mediators, plan additional material; that
workflow consumes a separate aliquot under different extraction conditions.
Deliverables — What You Receive
- Quantitative concentration tables — absolute concentrations
per species per sample in Excel and CSV, with free and esterified fractions in separate columns, units and
matrix stated for every column, and normalizer values delivered alongside.
- Class-level and species-level summaries — lipid class
totals alongside the species that compose them, so a class change can be traced to the acyl compositions
responsible rather than reported as an aggregate shift.
- Calibration and quality control report — calibration curves
with regression parameters and back-calculated accuracy, internal standard recovery per sample, pooled
quality control dispersion, carryover, retention time stability, and the oxidation marker panel.
- Pathway index tables — desaturation, elongation, synthesis
versus supply, free-to-esterified, saturation balance, cholesterol source, ketone body, bile acid
conjugation, and acylcarnitine pattern indices, each with its analyte inputs and the samples included.
- Chromatographic and accurate mass data — extracted ion
chromatograms for every quantified species, including the resolved isomeric pairs that were claimed, plus
accurate mass spectra for species confirmed by high-resolution acquisition.
- Pathway annotation and methods documentation — species
annotated to LIPID MAPS, KEGG, and HMDB identifiers and mapped onto the routes covered by the panel, with
collection, extraction, derivatization, and acquisition parameters written so that a methods section can
be assembled from it.
Representative Data
Applications of Lipid Metabolism Analysis
Untargeted Profiling Identifies the Lipid
Classes That Accumulate When a Cardiomyocyte Lipid Droplet Route Fails
Background
Lipid droplets hold esterified lipid between rounds of use, and their handling inside cardiomyocytes sits
between normal energy storage and lipotoxic injury. The study identified LIPTER, a human long non-coding RNA
expressed in cardiomyocytes, as a factor required for lipid droplet transport, and had to establish what
happens to the lipid pools when it is removed. Because the phenotype was expected as a redistribution among
lipid classes rather than a change in total lipid mass, the analysis had to resolve the classes and their
acyl compositions from limited sample amounts.
The challenge was to determine which lipid classes change when a cardiomyocyte lipid droplet route is
disrupted, from a small number of differentiated cell samples, and do it with enough class resolution that
the accumulating species could be assigned to the storage pool rather than to membrane lipid.
Findings (from the published study)
- LIPTER was knocked out in human induced pluripotent stem cells and the metabolome of enriched
cardiomyocytes was profiled at day 40 of differentiation, comparing knockout against wild type. The
untargeted metabolomics acquisition and data analysis were performed by Creative Proteomics.
- 10 million cardiomyocytes per sample were extracted with 800 µL of methanol together with
DL-o-chlorophenylalanine and LPC (12:0) as internal standards, ultrasonicated for 30 minutes, and analyzed
on an Ultimate 3000 HPLC and UHPLC coupled to Q Exactive mass spectrometry with electrospray ionization in
both polarities; alignment and multivariate analysis were carried out in Compound Discover and SIMCA-P.
- The top increased metabolites in the knockout were lipid and lipid-like molecules, including
phosphatidylinositol, phosphatidic acid, and triacylglycerol. Triacylglycerol is the core lipid of a lipid
droplet while phosphatidylinositol and phosphatidic acid are phospholipids of the droplet membrane, so the
pattern localized the change to the droplet compartment rather than to bulk membrane lipid.
- Lipid staining confirmed the interpretation: Oil Red O and Nile Red signal increased in the knockout and
quantified droplet-positive area rose against cardiomyocyte area, while re-expression of LIPTER repressed
droplet accumulation.
- Palmitate handling was measured directly: cells were loaded with 200 µM palmitic acid for 6 hours and
then depleted, with droplet density quantified separately in the whole cell and in the perinuclear and
cytosolic halves.
- The same direction appeared in vivo: mice with a cardiomyocyte-specific loss of Myh10 gained cardiac
lipid on a 45 kcal% fat diet over three months, with elevated heart triacylglycerol and reduced fatty acid
oxidation rates.
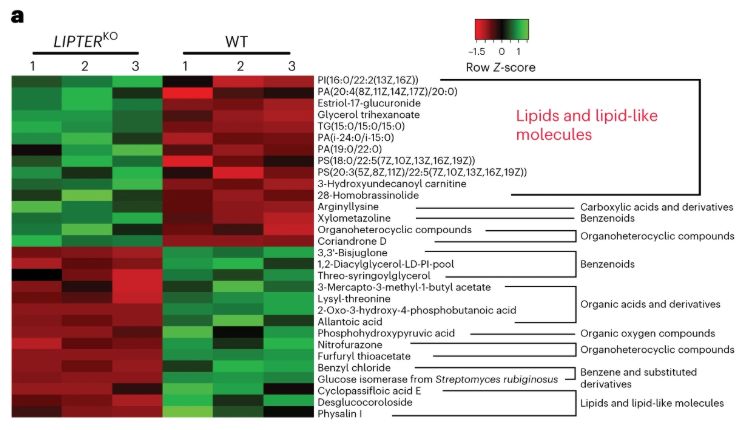
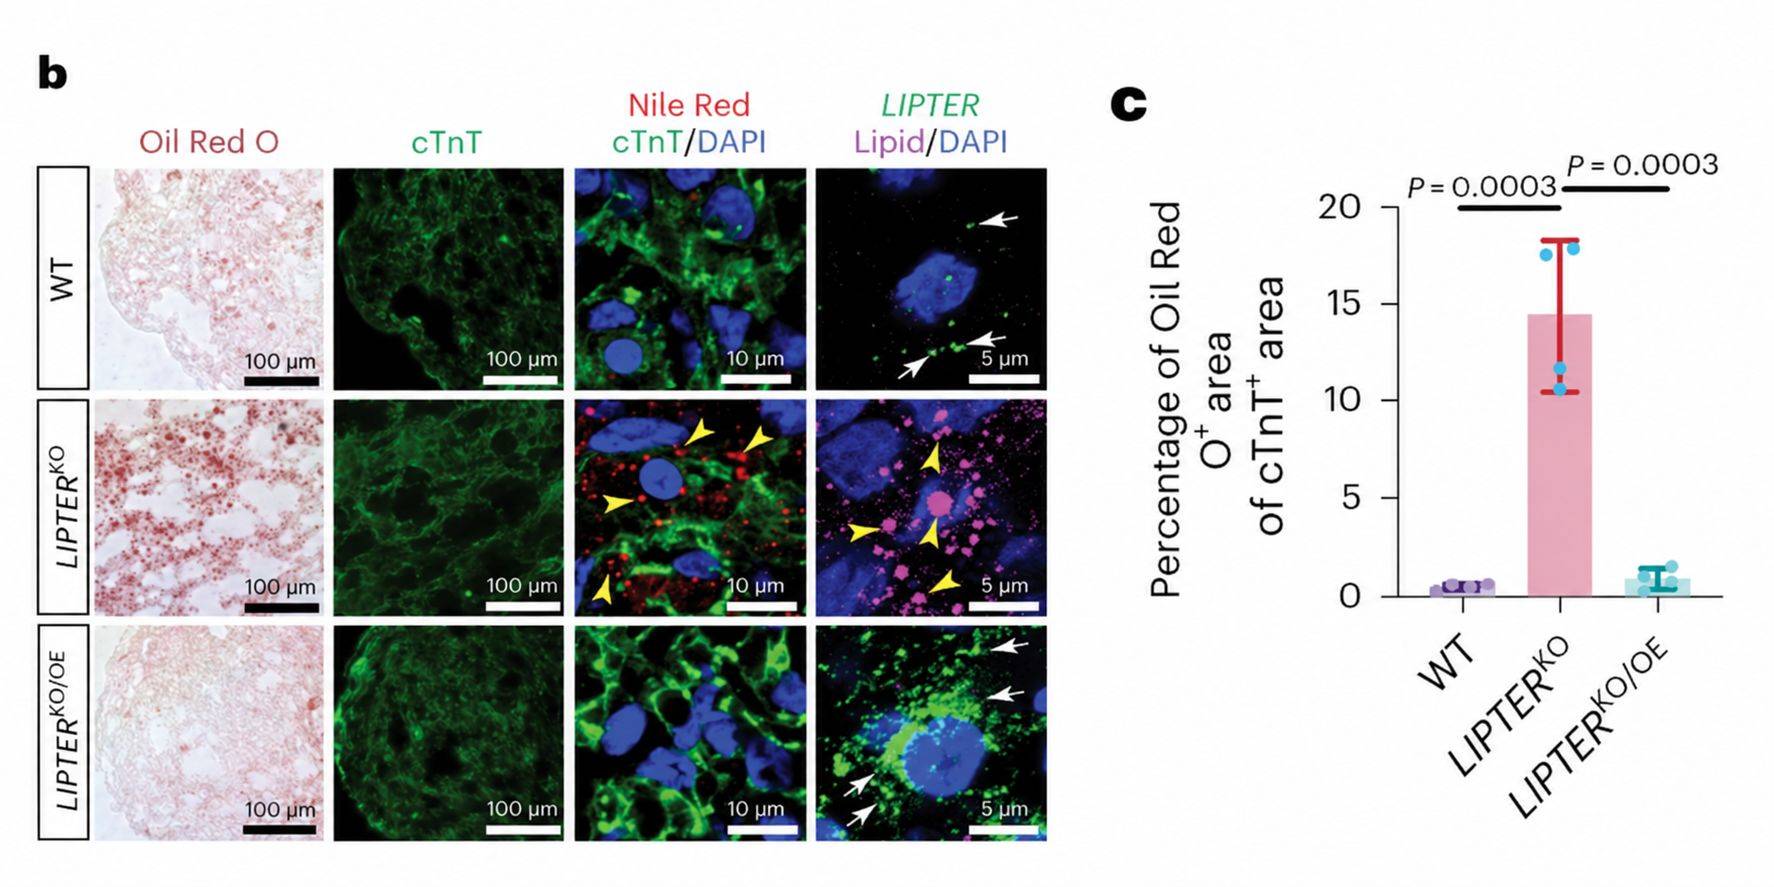 Figure 2. LIPTER deficiency disrupts lipid droplet balance in human induced pluripotent stem cell-derived cardiomyocytes: metabolite heat map, lipid droplet staining, and quantification of droplet-positive area against cardiomyocyte area.
Process Insight
The key result was not a fold change in one metabolite but the assignment of a class. Phosphatidylinositol
and phosphatidic acid sit close enough in mass to triacylglycerol that a coarser class resolution could have
reported the change as a generic increase in lipid content. Separating the classes individually is what
allowed the droplet compartment to be named as the site of the defect.
Two operational decisions shaped the dataset. Sample amount was the first: differentiated cardiomyocytes
yield limited material, so extraction had to be scaled to 10 million cells without losing the low-abundance
species that distinguish membrane phospholipid from storage lipid. Pre-analytical control was the second:
the design recorded both the palmitate loading and depletion intervals, so accumulated lipid could be
attributed to transport failure rather than to a difference in fatty acid supply. The baseline measurement —
often omitted — is what made the phenotype interpretable.
Where Our Lipid Metabolism Analysis Service Fits
The metabolomics in this study was performed by Creative Proteomics on the study's own samples, and the
outcome depended on class-level resolution rather than on a total lipid value. The same analytical basis is
available for your program:
- Class and acyl composition resolved together — phosphatidylinositol, phosphatidic acid,
and triacylglycerol quantified as separate analytes with their acyl compositions, so an accumulation can
be assigned to the storage or membrane pool rather than reported as an undifferentiated lipid increase.
- Free and esterified fractions kept apart — the same extraction reports the active free
fraction against the esterified pool, the comparison that separates supply from storage in a fatty acid
loading experiment.
- Scales to limited material — the workflow tolerates small differentiated-cell samples,
sorted populations, and low-volume biofluids, with the analyte list and internal standard set adjusted to
the amount of material available.
- Interpretable rather than raw output — concentrations arrive with class summaries, the
pathway indices, and the pre-analytical control record, so the pathway that changed can be named in a
mechanistic discussion.
Reference
- Han, L., Huang, D., Wu, S. et al.
Lipid
droplet-associated lncRNA LIPTER preserves cardiac lipid metabolism. Nature Cell Biology
25(7), 1033–1046 (2023).




 Contact Us


