Chlorophyll Detection Panel — 7+ Analytes Quantified by LC-MS/MS
Each analyte is quantified against its own authentic chemical standard. Each analyte has a dedicated analysis page with molecular structure, sample requirements, and method details. The full panel runs from a single extract.
| Analyte |
Functional Role |
Biological Occurrence & Significance |
| Chlorophyll a |
Primary light-harvesting & reaction center |
Universal reaction center pigment in all oxygenic photoautotrophs — higher plants, green algae, cyanobacteria. Essential for charge separation in PSI and PSII. Most abundant chlorophyll in nature; the reference pigment for biomass estimation and photosynthetic capacity. |
| Chlorophyll b |
Accessory antenna |
Light-harvesting antenna pigment in higher plants, green algae, and prochlorophytes. Chl a/b ratio (typically 2.5-3.5) is a sensitive indicator of light acclimation, nitrogen status, and photosynthetic apparatus stoichiometry. |
| Chlorophyll c1 |
Accessory (chromalveolates) |
Accessory pigment in chromalveolates — diatoms, dinoflagellates, brown algae. Chl c1/c2 ratio serves as a taxonomic marker for distinguishing diatom vs. dinoflagellate blooms in marine phytoplankton community analysis (CHEMTAX). |
| Chlorophyll c2 |
Accessory (chromalveolates) |
Second major Chl c isoform; co-occurs with c1 in most chromalveolates. More abundant than c1 in peridinin-containing dinoflagellates. Used alongside c1 in pigment-based phytoplankton functional type classification for oceanographic studies. |
| Chlorophyll d |
Red-shifted (far-red) |
Red-shifted chlorophyll in Acaryochloris marina (cyanobacterium). Absorbs far-red light (700-740 nm), enabling photosynthesis in shaded or near-infrared environments. Niche but ecologically significant for extremophile photobiology research. |
| Chlorophyll f |
Far-red (beyond 700 nm) |
Most red-shifted naturally occurring chlorophyll, discovered in cyanobacteria from stromatolites. Absorbs up to ~760 nm — beyond the traditional "red limit" of photosynthesis. Critical for understanding evolutionary limits of light harvesting and engineering far-red-enhanced crops. |
| Pheophytin a / b |
Degradation/quality marker |
Mg-free chlorophyll derivatives formed by acidification, heating, or senescence. Pheophytin/chlorophyll ratio is a key quality indicator — included in every panel to flag sample degradation during processing, food thermal treatment, or plant senescence. |
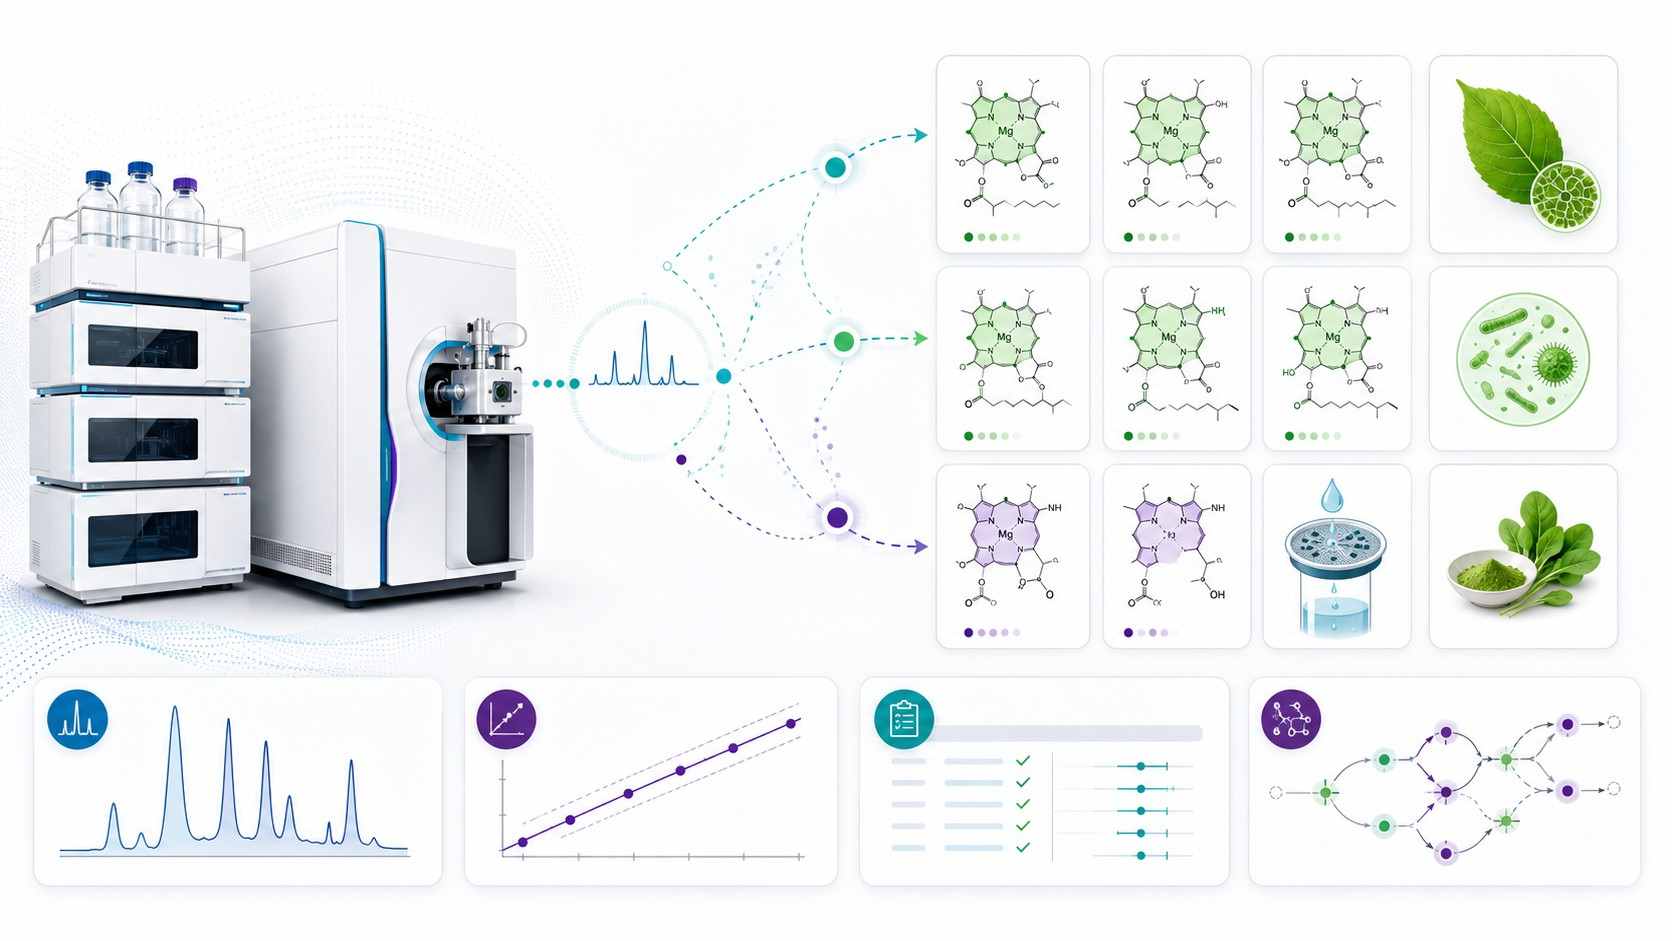
Analytical Platform & Method — How Chlorophylls Are Quantified
LC-MS/MS Platform
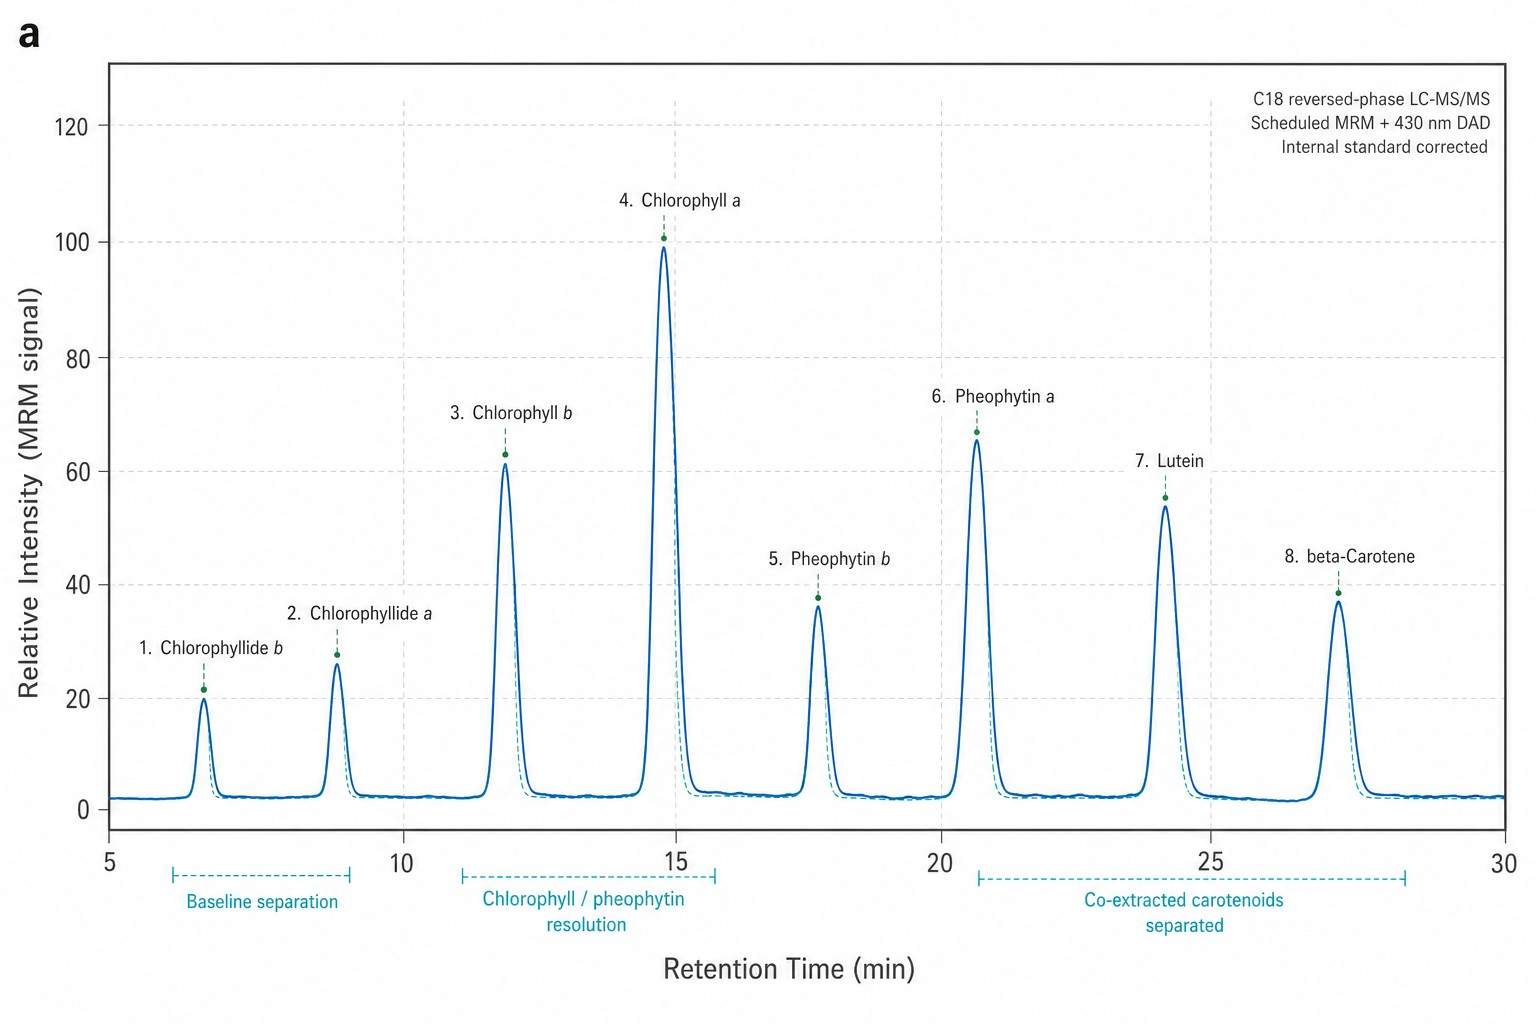
SCIEX QTRAP 6500+ with heated ESI source. Scheduled MRM acquisition for each chlorophyll species and degradation product. C18 reversed-phase column (150 x 2.1 mm, 3 um) with ternary gradient (methanol:ammonium acetate / acetonitrile:water / ethyl acetate). Detection at 430-436 nm (Soret band) with full-scan MS confirmation. MS/MS fragmentation for isomer discrimination — critical for distinguishing chlorophyll a from divinyl-chlorophyll a, and pheophytin a from pheophorbide a.
Complementary: HPLC-DAD — Agilent 1260 Infinity II with diode array for parallel absorbance-based quantification at multiple wavelengths (430/450/665 nm). Provides cross-validation of LC-MS/MS concentrations and enables pigment-based phytoplankton community analysis (CHEMTAX) when paired with carotenoid profiling.
Method Performance
| Parameter |
Specification |
| LOD |
0.01-0.24 ng/mL (species-dependent); Chl a: ~0.1 ng/mL, Chl b: ~0.15 ng/mL |
| LLOQ |
0.5-2.0 ng/mL (matrix-dependent); 10-20 pg on-column |
| Linear Range |
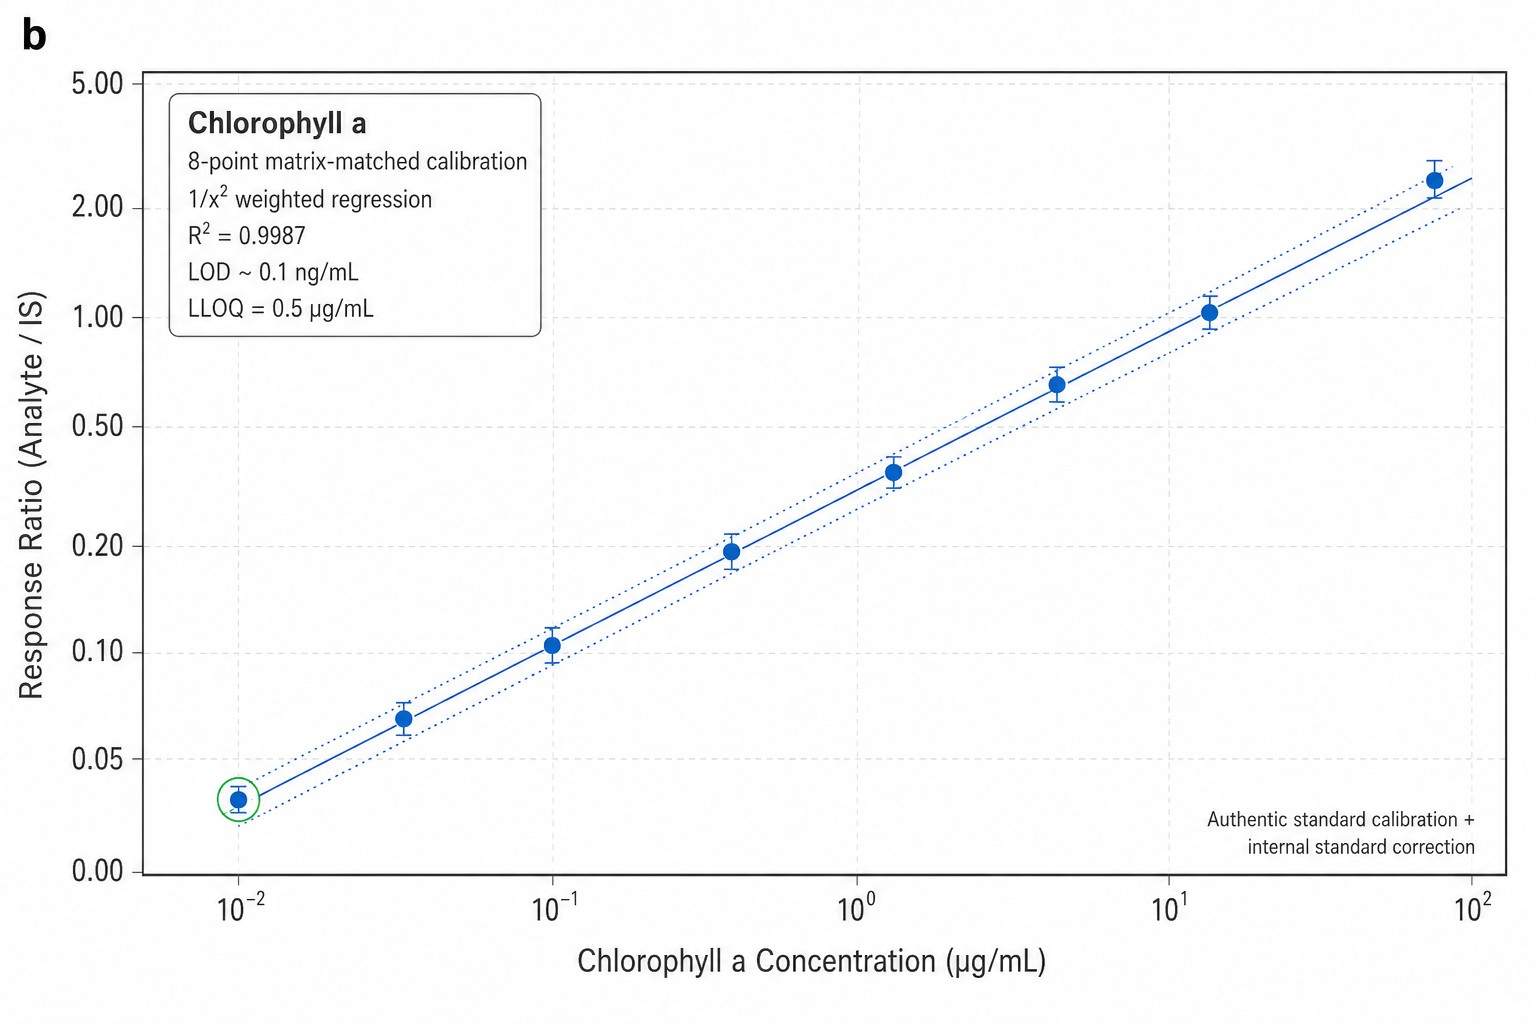
3-4 orders of magnitude; R2 above or equal to 0.995 per analyte |
| Quantification |
Absolute — external standard calibration (6-8 points, 1/x2 weighted) with internal standard (canthaxanthin or apo-8'-carotenal) |
| Precision (CV) |
Intra-batch: below 5% (major Chls), below 10% (minor species/degradation products). Inter-batch: below 15% |
| Spike Recovery |
85-115% at low/mid/high QC levels per matrix |
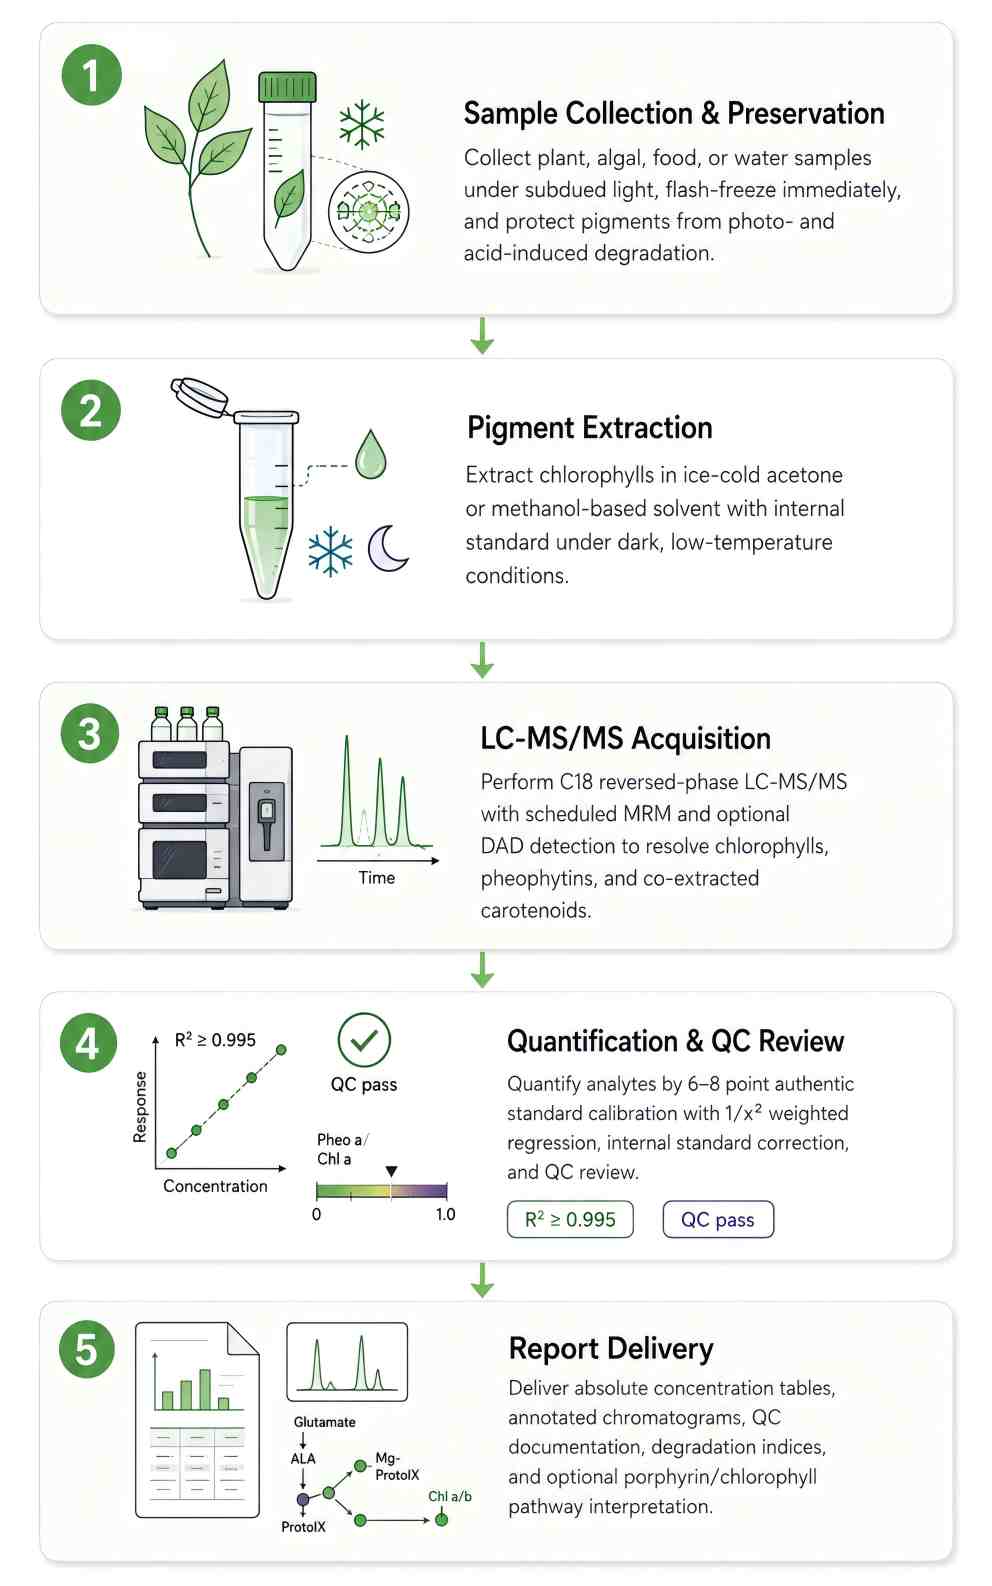
Chlorophyll Analysis Workflow — From Sample to Quantitative Data
Sample Types & Collection Requirements
| Sample Type |
Minimum Amount |
Collection & Processing |
Storage & Shipping |
| Plant Leaf Tissue |
Above or equal to 1 g FW (freeze-dried recommended); pooled from 3+ plants |
Harvest in subdued light. Flash-freeze in liquid N2 immediately. Lyophilize in darkness, grind to powder. Record leaf age, position, light exposure history. Avoid senescent or damaged tissue. |
-80 degree C; dry ice; light-protected |
| Microalgae / Cyanobacteria |
Above or equal to 300 mg fresh pellet; above or equal to 30 mg freeze-dried |
Centrifuge (3,000 x g, 5 min, 4 degree C). Wash with ice-cold PBS or ammonium formate. For field: filter onto GF/F under low vacuum (below 100 mm Hg), fold, wrap in foil. Record light, photoperiod, growth phase, nutrients. |
Flash-freeze in liquid N2; -80 degree C; dry ice; foil-wrapped |
| Food / Food Colorants |
Above or equal to 1 g solid; above or equal to 2 mL liquid |
Homogenize to uniform paste/powder. For oil-based: record oil content. For E140/E141 colorants: note processing history (blanching, drying, pH) affecting chlorophyll-pheophytin conversion. |
-20 degree C (1 week); -80 degree C (long-term); dry ice; dark containers |
| Environmental Water |
0.5-4 L (oligotrophic: 4 L; eutrophic: 0.5-1 L) |
Filter onto 47 mm GF/F under low vacuum. Add MgCO3 buffer. Fold filter, blot, wrap in foil. Record temperature, salinity, Secchi depth, collection depth. |
Flash-freeze in liquid N2 immediately; -80 degree C; dry ice |
| Soil / Sediment |
Above or equal to 5 g FW |
Collect top 2-5 mm for biological soil crusts. Homogenize, remove debris. Record soil type, organic matter, moisture, vegetation cover. |
-80 degree C; dry ice; light-protected |
Applications of Chlorophyll Analysis
Deliverables — What You Receive
- Quantitative Concentration Table — Absolute chlorophyll concentrations (ug/g FW, ug/g DW, or ug/L) per analyte per sample. Excel and CSV. LOD/LLOQ flags, IS recovery, pheophytin/chlorophyll degradation index per sample.
- QC Report — Calibration curves (6-8 points, 1/x2 weighted, R2 and back-calculated accuracy per analyte). Pooled QC RSD. IS peak area CV. Blank carryover. Spike recovery at 3 levels.
- Chromatograms & Spectral Data — UV-Vis chromatogram (430 nm) with annotated peaks. MRM traces per analyte. MS/MS confirmation spectra. Raw data files (.wiff, .mzML) on request.
- Methods Documentation — Complete LC-MS/MS parameters, extraction protocol, data processing settings and software versions. Formatted for manuscript methods section.
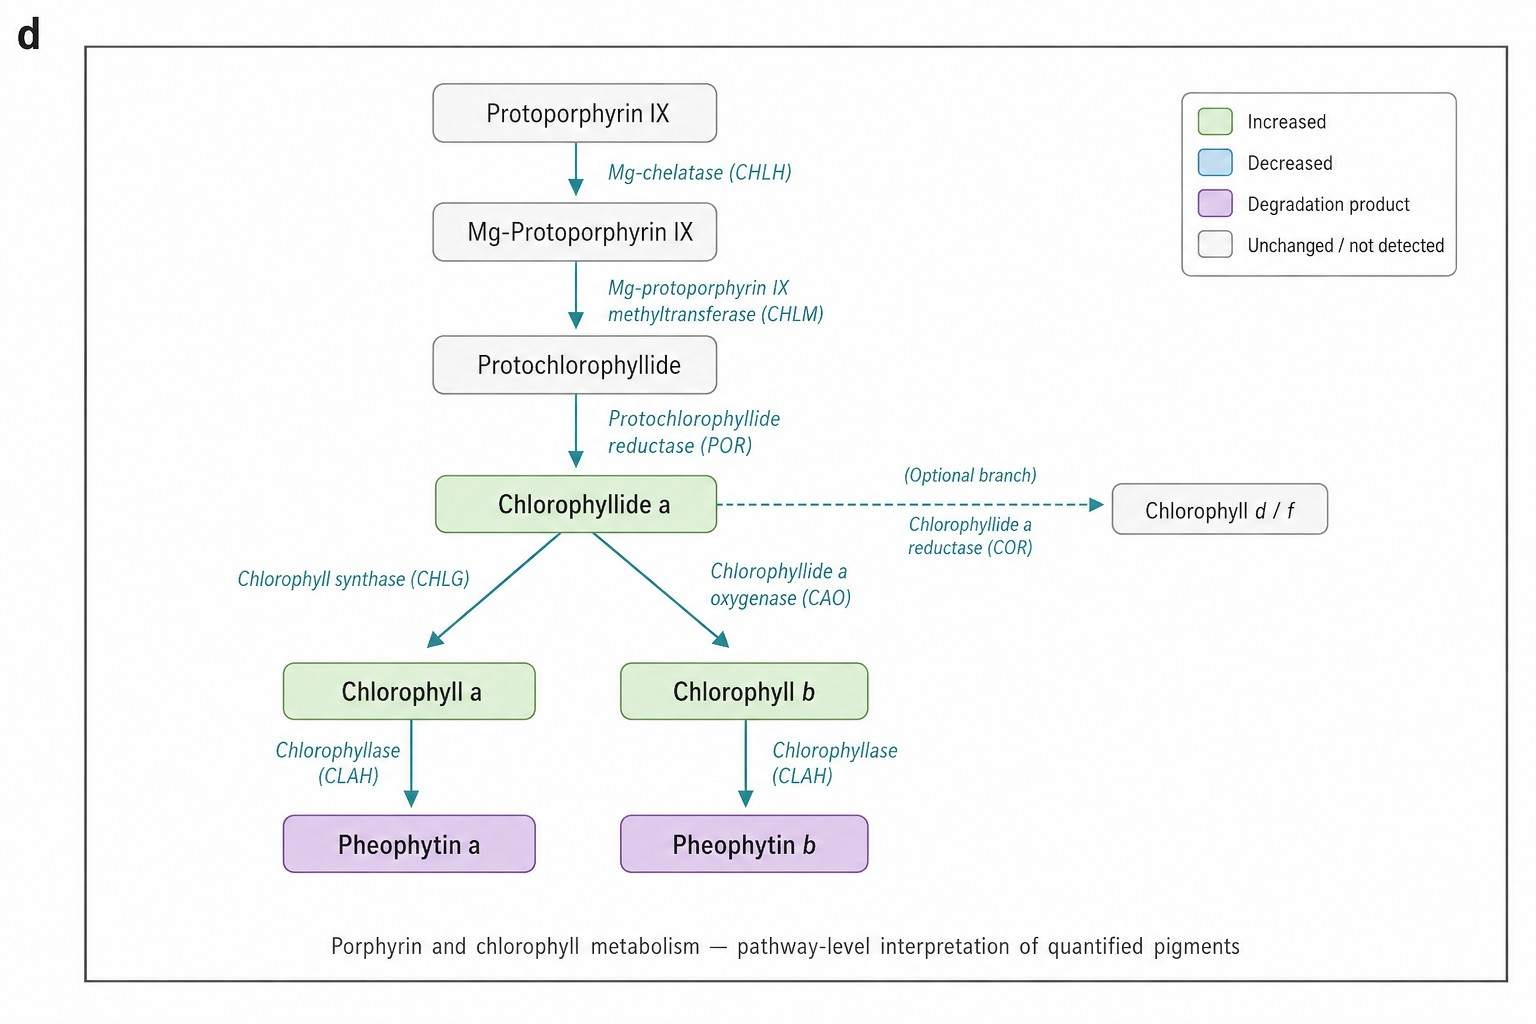
- Optional Add-ons — Carotenoid co-quantification (carotenoids analysis). KEGG porphyrin/chlorophyll metabolism pathway mapping. CHEMTAX phytoplankton community analysis. Statistical analysis with publication-ready figures.
Data Visualizations
Case Study — UPLC-UV-MSE Quantification of 37 Chlorophyll & Carotenoid Species in Stressed Microalgae
UPLC-UV-MSE analysis for quantification and identification of major carotenoid and chlorophyll species in algae
Fu, W., Magnusdottir, M., Brynjolfsson, S., Palsson, B.O., & Paglia, G. | Analytical and Bioanalytical Chemistry, 2012, 404, 3145-3154 | IF: 3.8
DOI: 10.1007/s00216-012-6434-4
The Analytical Challenge
Dunaliella salina is a model microalga for carotenoid and chlorophyll research — but its pigment profile is exceptionally complex, containing chlorophyll a, chlorophyll b, and dozens of carotenoids that shift dramatically under environmental stress. Traditional HPLC-UV methods could quantify only the major pigments but could not distinguish structurally similar chlorophyll derivatives (e.g., chlorophyll a vs. divinyl-chlorophyll a, pheophytin a vs. pheophorbide a), and could not identify unknown pigment species appearing under stress conditions. The researchers needed: (1) quantification of ALL chlorophylls and carotenoids against authentic standards; (2) structural identification of unknown derivatives; (3) sensitivity to detect trace degradation products — all from a single injection.
How Advanced LC-MS Chlorophyll Analysis Solved It
The team used a UPLC-UV-MSE method coupling ultra-performance liquid chromatography with parallel low-energy (quantification) and high-energy (fragmentation) mass spectrometry. Key quantitative results:
- 37 pigments detected and quantified — 19 carotenoids + 18 chlorophyll species — with LOD ranging from 0.01 ng/mL (lutein) to 0.24 ng/mL (chlorophyll a), representing a ~10-50x sensitivity improvement over standard HPLC-UV
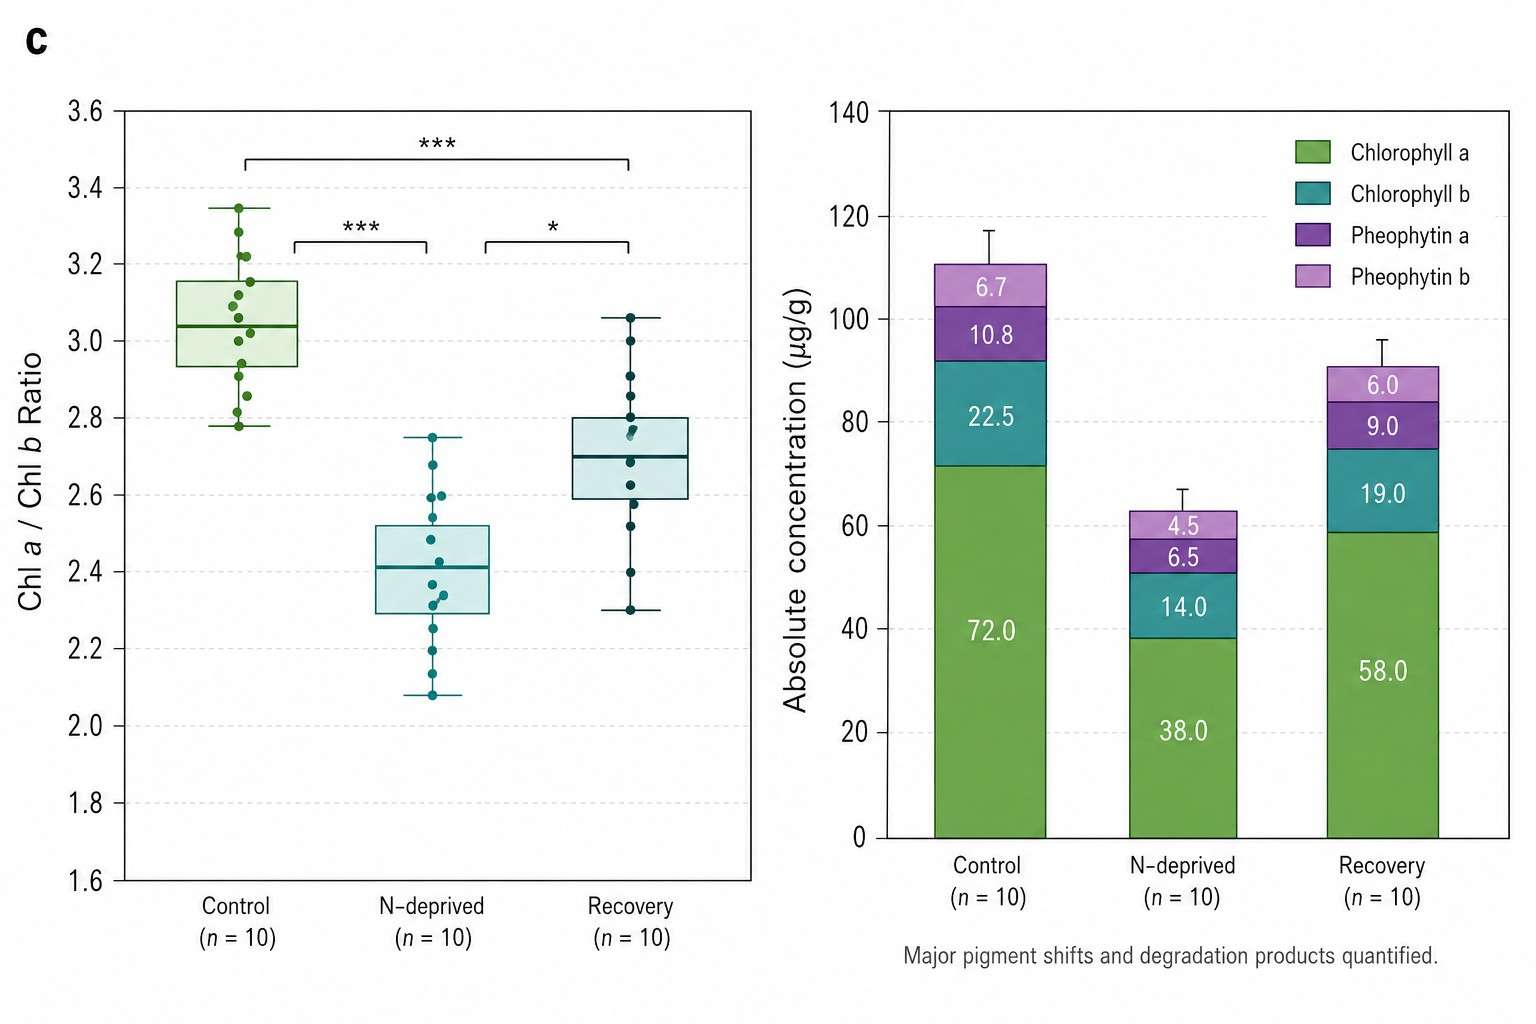
- Nitrogen deprivation triggered an 8-fold increase in beta-carotene (from ~2 to ~16 pg/cell) while chlorophyll a decreased 4-fold (from ~15 to ~3.8 pg/cell) — the Chl a/carotenoid ratio inverted, quantifying the shift from light harvesting to photoprotection
- 3 previously unreported chlorophyll derivatives identified via MSE spectral matching, including a novel pheophytin species that appeared only under stress — molecules invisible to UV-only detection
- Pheophytin a appeared exclusively in stressed samples (0.8 pg/cell), confirming chlorophyll degradation as a biological stress response rather than a sample preparation artifact
| Measurement |
Result (Control → N-deprived) |
| Chlorophyll a |
~15 pg/cell → ~3.8 pg/cell (decrease of 4-fold) |
| Chlorophyll b |
~5 pg/cell → ~1.6 pg/cell (decrease of ~3-fold; Chl a/b ratio shifted from 3.0 to 2.4) |
| Beta-Carotene |
~2 pg/cell → ~16 pg/cell (increase of 8-fold) |
| Pheophytin a |
Undetectable → 0.8 pg/cell (appeared only under stress) |
Analytical Approach We Replicate
This study demonstrates the framework our chlorophyll service delivers: (1) C18 ternary gradient chromatography for baseline separation of chlorophylls, carotenoids, and degradation products; (2) MS/MS fragmentation for confident isomer identification — distinguishing structurally similar species that UV-only methods conflate; (3) authentic standard calibration (6-8 points) for absolute quantification in pg/cell or ug/g units; (4) pheophytin monitoring as a built-in quality indicator distinguishing biological degradation from handling artifacts. When you submit your samples, you get the same analytical depth — every chlorophyll species resolved, every degradation product tracked, every concentration traceable to an authentic standard.
Reference
- Fu, W., Magnusdottir, M., Brynjolfsson, S., Palsson, B.O., & Paglia, G. UPLC-UV-MSE analysis for quantification and identification of major carotenoid and chlorophyll species in algae. Analytical and Bioanalytical Chemistry 404, 3145-3154 (2012).
Selected Publications in Chlorophyll & Plant Pigment Analysis
UPLC-UV-MSE analysis for quantification and identification of major carotenoid and chlorophyll species in algae
Fu, W., Magnusdottir, M., Brynjolfsson, S., Palsson, B.O., & Paglia, G.
Journal: Analytical and Bioanalytical Chemistry
Year: 2012
DOI: https://doi.org/10.1007/s00216-012-6434-4
Comprehensive chlorophyll composition of commercial green food colorants and coloring foodstuffs by HPLC-ESI-QTOF-MS/MS
Perez-Galvez, A. & Roca, M.
Journal: Food Chemistry
Year: 2023
DOI: https://doi.org/10.1016/j.foodchem.2023.135746
Fast, Sensitive, and Inexpensive Alternative to Analytical Pigment HPLC: Quantification of Chlorophylls and Carotenoids by Gauss Peak Spectra Fitting
Kupper, H., Seibert, S., & Parameswaran, A.
Journal: Analytical Chemistry
Year: 2007
DOI: https://doi.org/10.1021/ac070236m
An improved HPLC method for the analysis of chlorophylls and carotenoids from marine phytoplankton
Wright, S.W., Jeffrey, S.W., Mantoura, R.F.C., et al.
Journal: Marine Ecology Progress Series
Year: 1991
DOI: https://doi.org/10.3354/meps077183
Determination of chlorophylls and carotenoids by HPLC during olive lactic fermentation
Gandul-Rojas, B. & Minguez-Mosquera, M.I.
Journal: Journal of Chromatography A
Year: 1996
DOI: https://doi.org/10.1016/0021-9673(96)00123-9
Identifying isoprenoid biosynthesis intermediates by HPLC-MS in genetically engineered microorganisms
Perez-Gil, J., Rodriguez-Concepcion, M., & Vickers, C.E.
Journal: Methods in Enzymology
Year: 2022
DOI: https://doi.org/10.1016/bs.mie.2022.03.026
Chlorophyll a fluorescence: a signature of photosynthesis
Baker, N.R. & Rosenqvist, E.
Journal: Journal of Experimental Botany
Year: 2004
DOI: https://doi.org/10.1093/jxb/erh201