Service Brochure
Download technical PDF
Get decision-ready data from amino acid metabolism. Our targeted LC–MS/MS panels deliver high-confidence quantification across biological and industrial samples—supporting pathway analysis, process optimization, and biomarker validation.
Accurate quantification of 80+ amino acids & derivatives
Pathway-aligned panels for urea cycle, BCAA, one-carbon metabolism & more
Matrix-adapted workflows for biofluids, fermentation, food & plant extracts
QC-validated results with isotope-labeled internal standards
Fully customizable panel design & advanced signal correction
Amino acid metabolism supports nitrogen balance, energy production, neurotransmitter synthesis, and protein turnover—core functions in both biological and engineered systems. These dynamic pools respond to nutrient inputs, process conditions, and metabolic interventions, making them critical readouts for pathway activity.
Targeted amino acid panel metabolomics via LC–MS/MS provides the most reliable approach for accurate amino acid quantification and pathway-level resolution of metabolic changes. It enables you to:
(i) measure absolute pool sizes and key metabolic ratios
(ii) monitor specific nodes such as the urea cycle , BCAA catabolism, one-carbon and sulfur amino acid pathways
(iii) compare conditions across biofluids, tissues, fermentation systems, food matrices, and plant materials.
Common obstacles include inconsistent quantification, matrix-driven ion suppression, and limited pathway coverage—all of which obscure signals and delay decisions. Creative Proteomics resolves these with a targeted service that is:
Creative Proteomics offers a suite of LC–MS/MS-based targeted panels covering core amino acids, pathway-specific intermediates, and functional biomarkers across metabolic, nutritional, and neurobiological contexts. Panels are pre-configured or fully customizable with pathway relevance, matrix specificity, and quantification accuracy in mind.
| Panel | Included Analytes |
| Standard & Essential Amino Acids Panel (20 targets) | Arginine, Histidine, Isoleucine, Leucine, Lysine, Methionine, Phenylalanine, Threonine, Tryptophan, Valine, Alanine, Asparagine, Aspartic acid, Cysteine*, Glutamine*, Glutamic acid, Glycine, Proline, Serine, Tyrosine |
| Comprehensive Amino Acid & Derivatives Panel (80+ targets) | All core AAs plus: L-4-Hydroxyproline, 5-Hydroxylysine, β-Alanine, 1-/3-Methyl-L-histidine, Citrulline, Ornithine, 4-Aminobutyric acid (GABA), Taurine, Monoamines, Catecholamines, Polyamines, Choline compounds, and other metabolic derivatives. |
* Cysteine, Glutamine, and Asparagine are stabilized through proprietary protocols to minimize degradation during sample handling and processing.
| Panel | Key Targets / Pathways |
| Urea Cycle & Nitrogen Balance | Arginine, Citrulline, Ornithine, Aspartate, Urea |
| Branched-Chain / Aromatic AAs (BCAA/AAA) | Leucine, Isoleucine, Valine, Phenylalanine, Tyrosine, Tryptophan |
| One-Carbon & Sulfur Metabolism | Methionine, Homocysteine, Serine, Glycine, Cysteine, Taurine |
| Neuroactive Precursors | Glutamate, GABA, Aspartate, Tyrosine, Tryptophan |
| Amino Acid Transport / Biosynthesis | Glutamine, Asparagine, Proline, Alanine, Threonine |
| Panel | Representative Classes |
| Neurotransmitter-Related | Monoamines, Catecholamines, GABA, Glutamate, Polyamines, Choline derivatives |
| Cytotoxicity Indicators | Oxidized amino acid byproducts, 5-Hydroxylysine, β-Alanine, Methylhistidines |
| Immunological Biomarkers | Arginine, Methionine, Kynurenine (customized on request) |
| Food Consumption Markers | 3-Methyl-L-histidine, β-Alanine, Taurine, Threonine, Glycine |
| Category | Options |
| Target List | Define your own list from amino acids, metabolic intermediates, amines, and custom biomarkers |
| Chiral Resolution | Support for D/L isomer separation via derivatization or chiral LC |
| Internal Standards | 13C/15N-labeled internal standards for select analytes (quantitative or semi-quantitative) |
| Labile Compound Stabilization | Special workflows for glutamine, cysteine, asparagine, and other unstable AAs |
LC–MS/MS (Primary Platform)
Mass Spectrometer: Triple Quadrupole MS (e.g., SCIEX QTRAP, Thermo TSQ, Agilent 6495 series)
Ionization Mode: Electrospray Ionization (ESI), Positive Mode
LC System: UHPLC or HPLC (depending on resolution and throughput needs)
Chromatography: HILIC or Reversed Phase, depending on analyte group and matrix
Derivatization Options: OPA, AccQ-Tag, FMOC-Cl, or derivatization-free (native) based on analyte class
| Parameter | Typical Range |
| LOD / LOQ | 0.1–10 fmol (on-column), analyte-dependent |
| Dynamic Range | 4–5 orders of magnitude |
| Quantification Type | Absolute (isotope dilution) and/or relative (normalized to internal standards) |
| Precision (CV%) | ≤10% intra-batch; ≤15% inter-batch |
| Accuracy (Spike Recovery) | 85–115% |
| Injection Volume | Typically 2–10 μL |
GC–MS (Optional / Confirmatory Use)
GC–MS is available for specific cases requiring orthogonal confirmation, improved resolution, or library-based identification (e.g., β-alanine, GABA, short-chain amines).
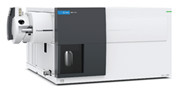
Agilent 6495C Triple quadrupole (Figure from Agilent)
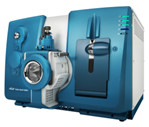
SCIEX Triple Quad™ 6500+ (Figure from Sciex)
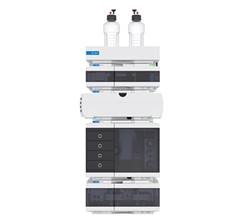
Agilent 1260 Infinity II HPLC (Figure from Agilent)
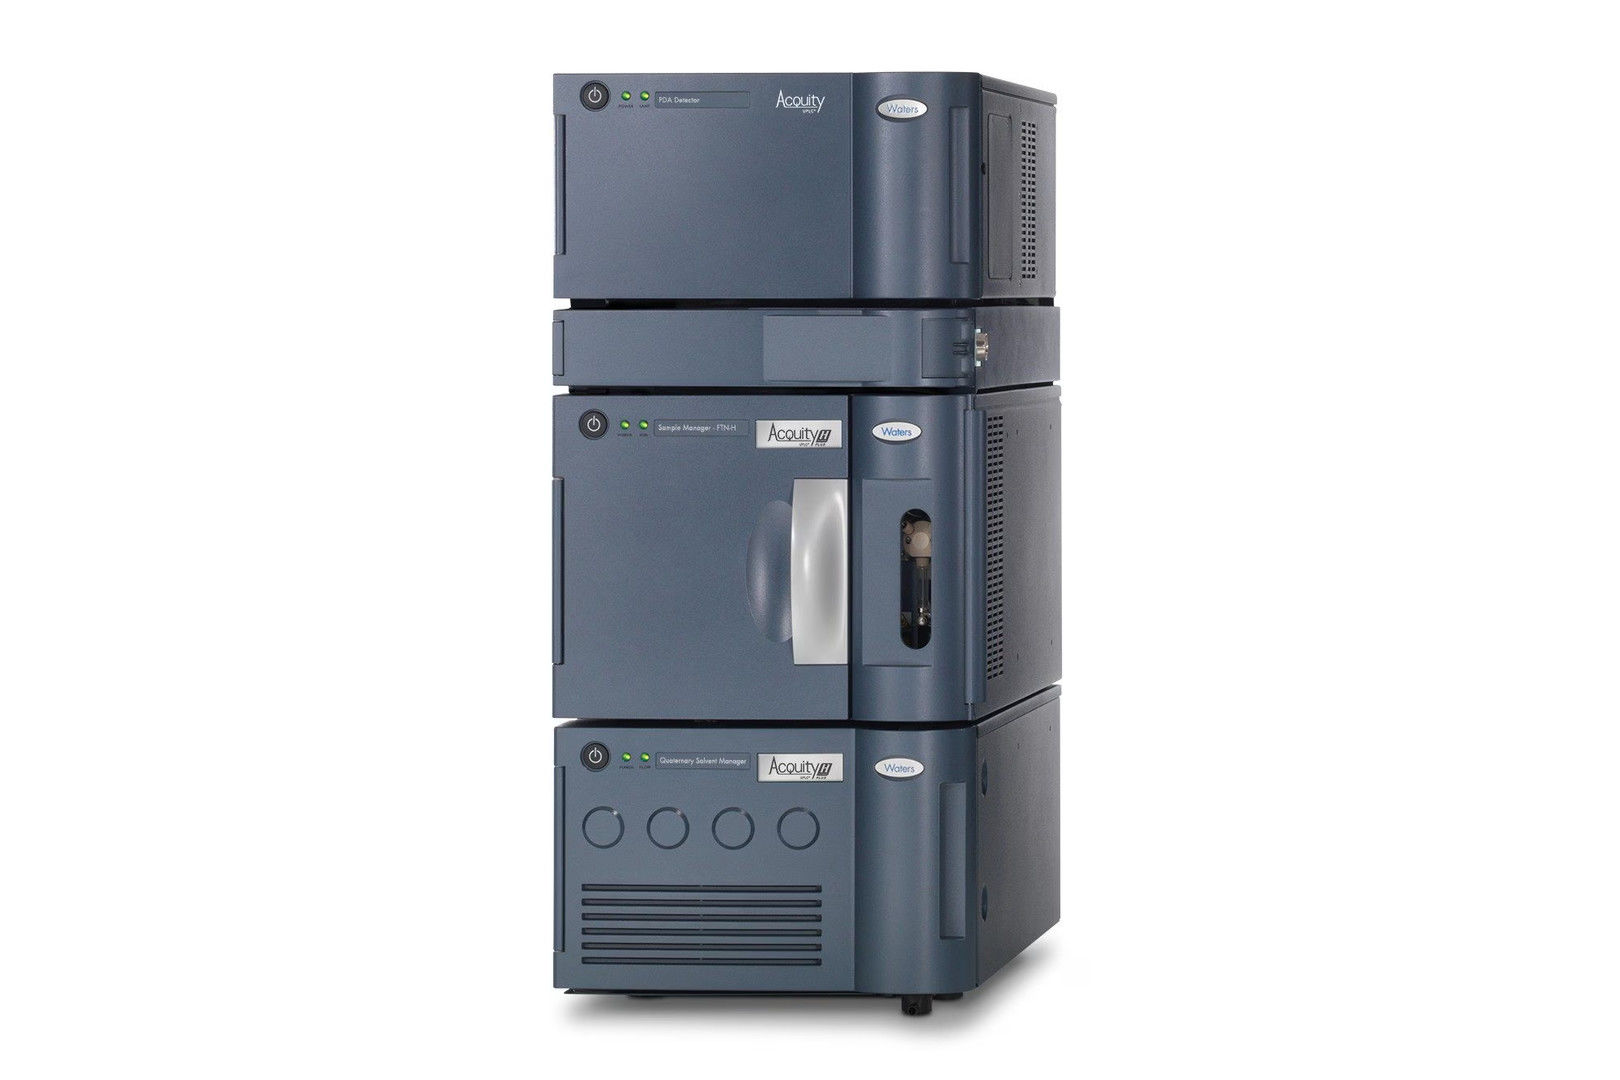
Waters ACQUITY UPLC System (Figure from Waters)
| Sample Type | Amount Required | Preparation Instructions | Storage & Shipping |
|---|---|---|---|
| Plasma / Serum | ≥ 50 μL | Collect in EDTA / heparin tube, centrifuge, aliquot supernatant, avoid hemolysis | Store at −80°C; ship on dry ice |
| Urine / CSF | ≥ 50 μL | Centrifuge to remove debris, aliquot | Store at −80°C; ship on dry ice |
| Tissue (wet weight) | 5–20 mg | Snap freeze in liquid nitrogen or dry ice immediately after collection | Store at −80 °C; ship on dry ice |
| Cell Pellets | ≥ 0.5–5 × 10⁶ cells | Wash with cold PBS, centrifuge, remove supernatant, freeze pellet | Store at −80°C; ship on dry ice |
| Fermentation Broth | ≥ 100 μL | Centrifuge, collect supernatant or filter if needed | Store at −80°C; ship on dry ice |
| Food / Ingredient | 50–100 mg or μL | Homogenize or extract in cold solvent (e.g. methanol:water), aliquot | Store at −80°C; ship on dry ice |
| Plant Tissue | 10–30mg | Remove soil/debris, flash freeze immediately after collection | Store at −80°C; ship on dry ice |
Notes
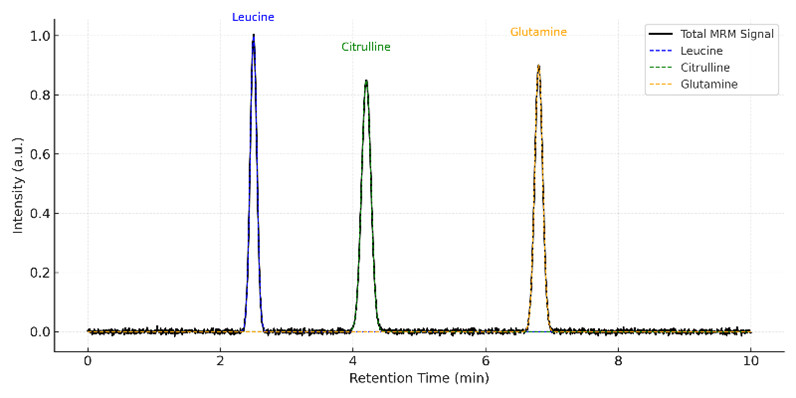
Representative MRM chromatogram showing clean peak separation and symmetric signal shapes for leucine, citrulline, and glutamine under a targeted LC–MS/MS panel.
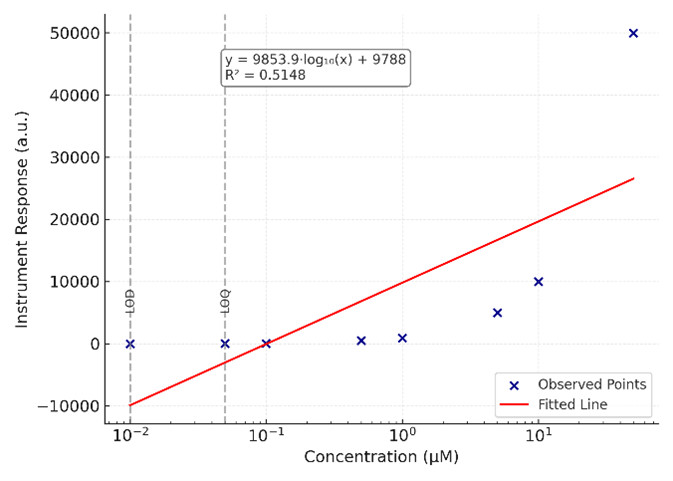
Calibration curve of a representative amino acid across 8 concentration levels, with linear regression (R² = 0.998) and indicated LOD/LOQ thresholds.
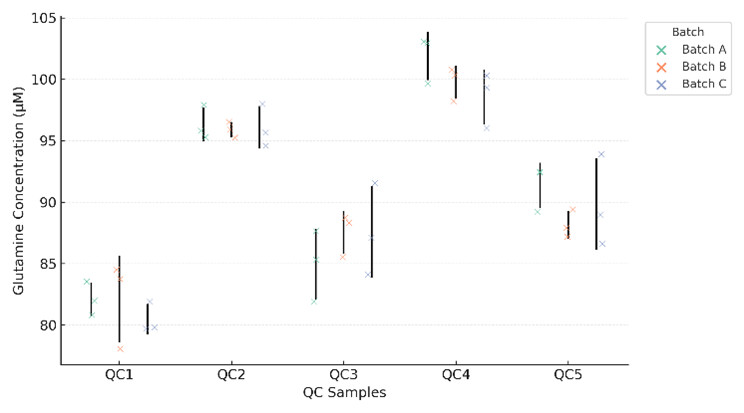
Batch-wise overlay of glutamine concentrations from five QC samples, demonstrating intra- and inter-batch reproducibility with low variance.
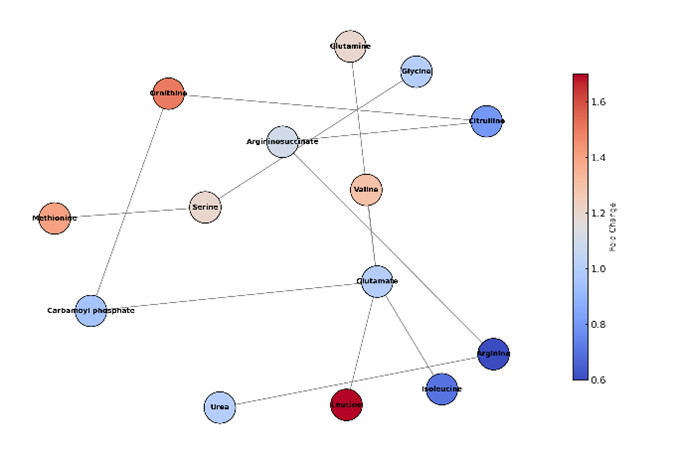
Simplified metabolic network illustrating quantified amino acids from the urea cycle, BCAA, and one-carbon metabolism pathways, colored by fold-change.
Our amino acid profiling service supports researchers and developers across industries:
Biotech & Biopharma
Monitor nutrient consumption, strain performance, and culture viability
Food & Nutrition
Validate essential amino acid content in protein blends and specialty formulations
Agriculture & Plant Science
Assess amino acid response in plants under stress, drought, or nutrient variation
Metabolomics & Systems Biology
Quantify central nitrogen metabolism, BCAA levels, and metabolic flux
Protein Characterization
Support amino acid composition studies in recombinant proteins
Researchers working with switchgrass hydrolysates observed complete inhibition of yeast growth in material harvested under drought conditions. To diagnose the cause, biomass was pretreated via Ammonia Fiber Expansion (AFEX), subjected to solvent extraction (water, ethanol, ethyl acetate) either before or after AFEX, and then analyzed by liquid chromatography–mass spectrometry (LC–MS) while monitoring Saccharomyces cerevisiae fermentation performance.
Challenge:
Identify the plant-generated vs. pretreatment-derived inhibitors in a complex plant matrix, and determine a practical mitigation that restores fermentation.
Table 4A. Amino acid composition in hydrolysates of ethanol extracted switchgrass
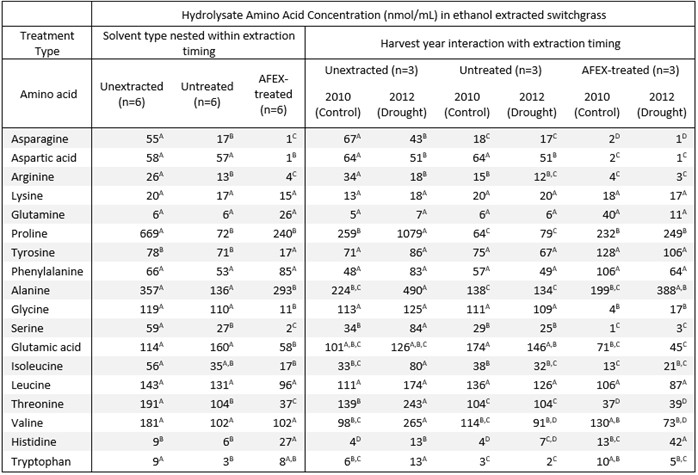
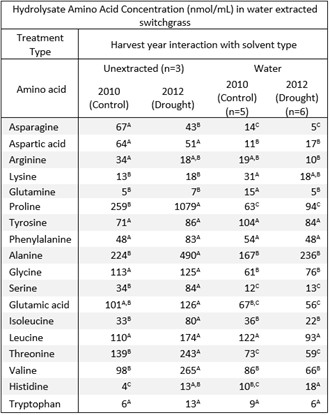
Table 4B. Amino acid composition in hydrolysates of water extracted switchgrass
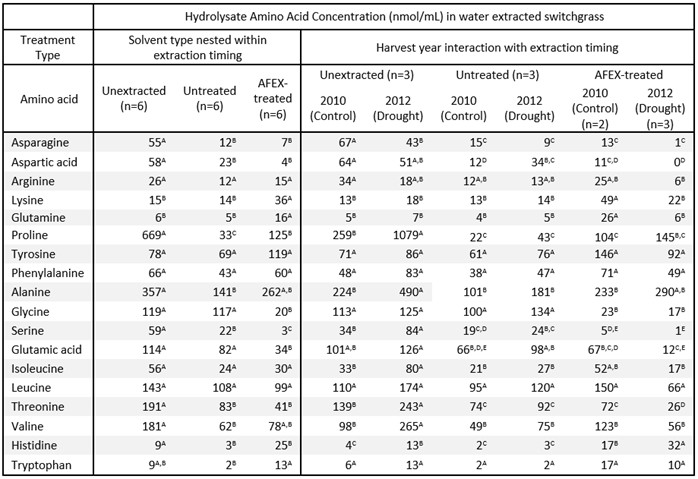
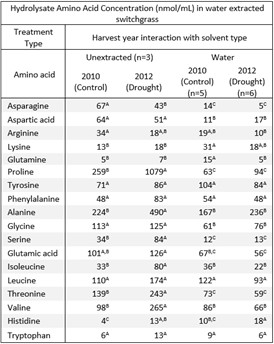
The study demonstrates a feedstock-QA workflow that combines water extraction, AFEX, high-solids enzymatic hydrolysis, LC–MS characterization of extracts, and S. cerevisiae performance readouts to pinpoint inhibitory chemistry under drought stress.
While this publication pinpoints saponins as key inhibitors, Creative Proteomics supports similar bioenergy projects by integrating amino acid analysis alongside saponin surveillance to deliver nitrogen-pathway context that impacts fermentation:
Reference
What is the benefit of using a targeted amino acid panel instead of untargeted metabolomics?
Targeted panels allow for precise quantification of amino acids with predefined coverage, optimized sensitivity, and pathway alignment. This approach supports hypothesis-driven studies, ensures data reproducibility across batches, and eliminates ambiguity in metabolite identification.
Can this analysis differentiate structurally similar amino acids or isomers?
Yes. The platform supports chromatographic resolution of structural isomers and, where applicable, chiral separation of D-/L- forms using derivatization or specialized LC phases. This enables confident quantification of analytes like leucine/isoleucine or D-serine/L-serine.
How many amino acids can be measured in a single run?
Depending on the panel configuration and matrix, over 80 amino acids and derivatives can be captured simultaneously, including proteinogenic amino acids, metabolic intermediates, and functional analogs.
Is the method compatible with both biological and industrial sample types?
Yes. The workflow is adaptable to a wide range of matrices such as plasma, urine, cell lysates, fermentation broth, plant tissue, and food ingredients. Extraction and QC strategies are matrix-specific to ensure analytical integrity.
Can amino acid levels be linked to specific metabolic pathways?
Quantified amino acids are annotated against core pathways such as the urea cycle, BCAA metabolism, one-carbon metabolism, and neurotransmitter biosynthesis. Fold-change and concentration data can be visualized on pathway maps for interpretability.
How do you ensure data reliability across batches or large studies?
Methodology is locked and reproducible across runs. Each batch includes matrix-matched calibrators, internal standards, system suitability checks, and QC replicates, ensuring consistent performance and comparability.
Can the panel be customized based on my study or strain-specific needs?
Absolutely. Panels can be tailored to include specific targets, pathway classes, or unique analytes relevant to engineered strains, nutrition interventions, or metabolic phenotyping goals.
MS-CETSA functional proteomics uncovers new DNA-repair programs leading to Gemcitabine resistance
Nordlund, P., Liang, Y. Y., Khalid, K., Van Le, H., Teo, H. M., Raitelaitis, M., ... & Prabhu, N.
Journal: Research Square
Year: 2024
High Levels of Oxidative Stress Early after HSCT Are Associated with Later Adverse Outcomes
Cook, E., Langenberg, L., Luebbering, N., Ibrahimova, A., Sabulski, A., Lake, K. E., ... & Davies, S. M.
Journal:Transplantation and Cellular Therapy
Year: 2024
Multiomics of a rice population identifies genes and genomic regions that bestow low glycemic index and high protein content
Badoni, S., Pasion-Uy, E. A., Kor, S., Kim, S. R., Tiozon Jr, R. N., Misra, G., ... & Sreenivasulu, N.
Journal: Proceedings of the National Academy of Sciences
Year: 2024
The Brain Metabolome Is Modified by Obesity in a Sex-Dependent Manner
Norman, J. E., Milenkovic, D., Nuthikattu, S., & Villablanca, A. C.
Journal: International Journal of Molecular Sciences
Year: 2024
UDP-Glucose/P2Y14 Receptor Signaling Exacerbates Neuronal Apoptosis After Subarachnoid Hemorrhage in Rats
Kanamaru, H., Zhu, S., Dong, S., Takemoto, Y., Huang, L., Sherchan, P., ... & Zhang, J. H.
Journal: Stroke
Year: 2024
Pan-lysyl oxidase inhibition disrupts fibroinflammatory tumor stroma, rendering cholangiocarcinoma susceptible to chemotherapy
Burchard, P. R., Ruffolo, L. I., Ullman, N. A., Dale, B. S., Dave, Y. A., Hilty, B. K., ... & Hernandez-Alejandro, R.
Journal: Hepatology Communications
Year: 2024
Comparative metabolite profiling of salt sensitive Oryza sativa and the halophytic wild rice Oryza coarctata under salt stress
Tamanna, N., Mojumder, A., Azim, T., Iqbal, M. I., Alam, M. N. U., Rahman, A., & Seraj, Z. I.
Journal: Plant‐Environment Interactions
Year: 2024
Teriflunomide/leflunomide synergize with chemotherapeutics by decreasing mitochondrial fragmentation via DRP1 in SCLC
Mirzapoiazova, T., Tseng, L., Mambetsariev, B., Li, H., Lou, C. H., Pozhitkov, A., ... & Salgia, R.
Journal: iScience
Year: 2024
Physiological, transcriptomic and metabolomic insights of three extremophyte woody species living in the multi-stress environment of the Atacama Desert
Gajardo, H. A., Morales, M., Larama, G., Luengo-Escobar, A., López, D., Machado, M., ... & Bravo, L. A.
Journal: Planta
Year: 2024
A personalized probabilistic approach to ovarian cancer diagnostics
Ban, D., Housley, S. N., Matyunina, L. V., McDonald, L. D., Bae-Jump, V. L., Benigno, B. B., ... & McDonald, J. F.
Journal: Gynecologic Oncology
Year: 2024
Glucocorticoid-induced osteoporosis is prevented by dietary prune in female mice
Chargo, N. J., Neugebauer, K., Guzior, D. V., Quinn, R. A., Parameswaran, N., & McCabe, L. R.
Journal: Frontiers in Cell and Developmental Biology
Year: 2024
Proteolytic activation of fatty acid synthase signals pan-stress resolution
Wei, H., Weaver, Y. M., Yang, C., Zhang, Y., Hu, G., Karner, C. M., ... & Weaver, B. P.
Journal: Nature Metabolism
Year: 2024
Quantifying forms and functions of intestinal bile acid pools in mice
Sudo, K., Delmas-Eliason, A., Soucy, S., Barrack, K. E., Liu, J., Balasubramanian, A., … & Sundrud, M. S.
Journal: bioRxiv
Year: 2024
Elevated SLC7A2 expression is associated with an abnormal neuroinflammatory response and nitrosative stress in Huntington's disease
Gaudet, I. D., Xu, H., Gordon, E., Cannestro, G. A., Lu, M. L., & Wei, J.
Journal: Journal of Neuroinflammation
Year: 2024
Thermotolerance capabilities, blood metabolomics, and mammary gland hemodynamics and transcriptomic profiles of slick-haired Holstein cattle during mid lactation in Puerto Rico
Contreras-Correa, Z. E., Sánchez-Rodríguez, H. L., Arick II, M. A., Muñiz-Colón, G., & Lemley, C. O.
Journal: Journal of Dairy Science
Year: 2024
DNA stimulates SIRT6 to mono-ADP-ribosylate proteins within histidine repeats
Pederson, N. J., & Diehl, K. L.
Journal: bioRxiv
Year: 2024
Glycine supplementation can partially restore oxidative stress-associated glutathione deficiency in ageing cats
Ruparell, A., Alexander, J. E., Eyre, R., Carvell-Miller, L., Leung, Y. B., Evans, S. J., ... & Watson, P.
Journal: British Journal of Nutrition
Year: 2024
Untargeted metabolomics reveal sex-specific and non-specific redox-modulating metabolites in kidneys following binge drinking
Rafferty, D., de Carvalho, L. M., Sutter, M., Heneghan, K., Nelson, V., Leitner, M., ... & Puthanveetil, P.
Journal: Redox Experimental Medicine
Year: 2023
Sex modifies the impact of type 2 diabetes mellitus on the murine whole brain metabolome
Norman, J. E., Nuthikattu, S., Milenkovic, D., & Villablanca, A. C.
Journal: Metabolites
Year: 2023
A human iPSC-derived hepatocyte screen identifies compounds that inhibit production of Apolipoprotein B
Liu, J. T., Doueiry, C., Jiang, Y. L., Blaszkiewicz, J., Lamprecht, M. P., Heslop, J. A., ... & Duncan, S. A.
Journal: Communications Biology
Year: 2023
Methyl donor supplementation reduces phospho‐Tau, Fyn and demethylated protein phosphatase 2A levels and mitigates learning and motor deficits in a mouse model of tauopathy
van Hummel, A., Taleski, G., Sontag, J. M., Feiten, A. F., Ke, Y. D., Ittner, L. M., & Sontag, E.
Journal: Neuropathology and Applied Neurobiology
Year: 2023
Sex hormones, sex chromosomes, and microbiota: identification of Akkermansia muciniphila as an estrogen-responsive bacterium
Sakamuri, A., Bardhan, P., Tummala, R., Mauvais-Jarvis, F., Yang, T., Joe, B., & Ogola, B. O.
Journal: Microbiota and Host
Year: 2023
Living in extreme environments: a photosynthetic and desiccation stress tolerance trade-off story, but not for everyone
Gajardo, H. A., Morales, M., López, D., Luengo-Escobar, M., Machado, A., Nunes-Nesi, A., ... & Bravo, L.
Journal: Authorea Preprints
Year: 2023
Resting natural killer cell homeostasis relies on tryptophan/NAD+ metabolism and HIF‐1α
Pelletier, A., Nelius, E., Fan, Z., Khatchatourova, E., Alvarado‐Diaz, A., He, J., ... & Stockmann, C.
Journal: EMBO Reports
Year: 2023
Function and regulation of a steroidogenic CYP450 enzyme in the mitochondrion of Toxoplasma gondii
Asady, B., Sampels, V., Romano, J. D., Levitskaya, J., Lige, B., Khare, P., ... & Coppens, I.
Journal: PLoS Pathogens
Year: 2023
Get Your Custom Quote
Explore the future of metabolomics with Creative Proteomics. Discover cutting-edge solutions for metabolic analysis and research.
Copyright © 2026 Creative Proteomics. All rights reserved.