What Is Phenylalanine—and Why Measure It?
Phenylalanine (Phe) is an essential aromatic amino acid that enters metabolism through diet and feeds multiple pathways: it converts to tyrosine, contributes to catecholamine and thyroid hormone biosynthesis via downstream networks, and reflects amino-acid availability, protein turnover, and nitrogen balance. In experimental systems, shifts in Phe often accompany nutrient perturbation, microbiome–host interactions, and metabolic remodeling in cells, tissues, and biofluids.
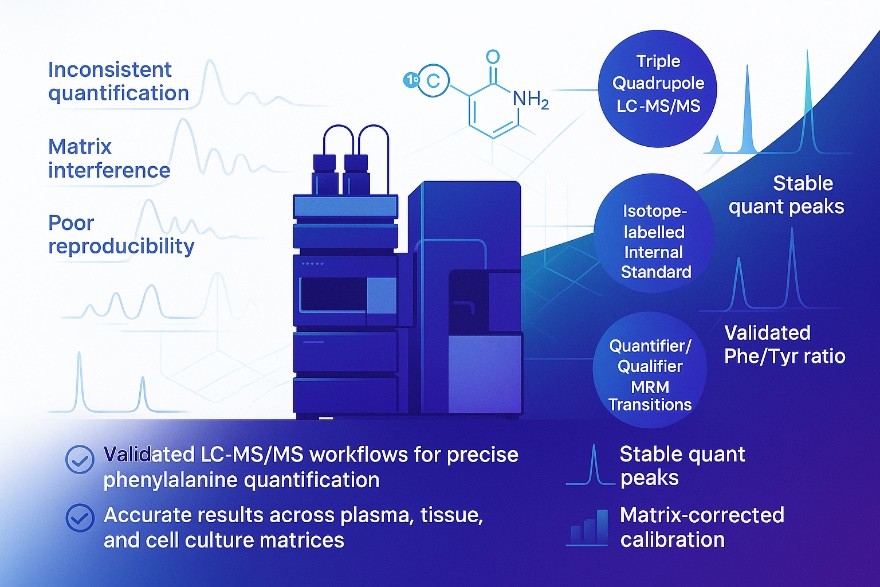
Why analyze Phe with LC-MS/MS:
- Track pathway dynamics via Phe ↔ Tyr and related aromatic amino-acid networks
- Evaluate nutrient restriction/supplementation and media/formulation consistency
- Quantify changes linked to energy and signaling (e.g., mTOR, hepatic metabolism)
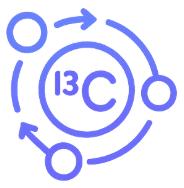
- Integrate with amino-acid panels or 13C isotope tracing for flux insights
- Obtain matrix-specific, low-LLOQ measurements suitable for plasma/serum, CSF, urine, tissues, and cell culture media
Creative Proteomics provides high-specificity LC-MS/MS phenylalanine quantification to support rigorous, decision-ready research.
Phenylalanine Analysis Services by Creative Proteomics
Choose from flexible, research-focused service packages—from single-analyte Phe measurement to dual-analyte ratios, amino-acid panels and stable-isotope tracing. All services are for research use only.
Related Analytes for Phenylalanine LC-MS/MS
To support broader pathway interpretation, several related amino acids can be co-quantified with phenylalanine (Phe) in the same LC-MS/MS workflow. These targets provide context on aromatic amino-acid metabolism, nitrogen balance, and overall metabolic status.
| Analyte |
Typical Purpose |
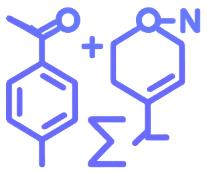
| Tyrosine (Tyr) |
Enables Phe/Tyr ratio for pathway analysis and neurochemistry studies |
| Tryptophan (Trp) |
Completes the aromatic amino acid network; supports neurotransmitter biosynthesis research |
| Valine · Leucine · Isoleucine (BCAAs) |
Indicators of nutrient status and energy metabolism |
| Glutamine · Glutamate |
Reflect nitrogen metabolism and anaplerotic flux in the TCA cycle |
These analytes can be seamlessly integrated into a custom amino acid panel or added individually to meet your experimental goals.
→ View Full Analyte List in our Amino Acid Panel.
Why Choose Our Phenylalanine Analysis Service?
- Sensitivity: LLOQ typically ≤0.5–2.0 µM in plasma/serum(matrix-dependent).
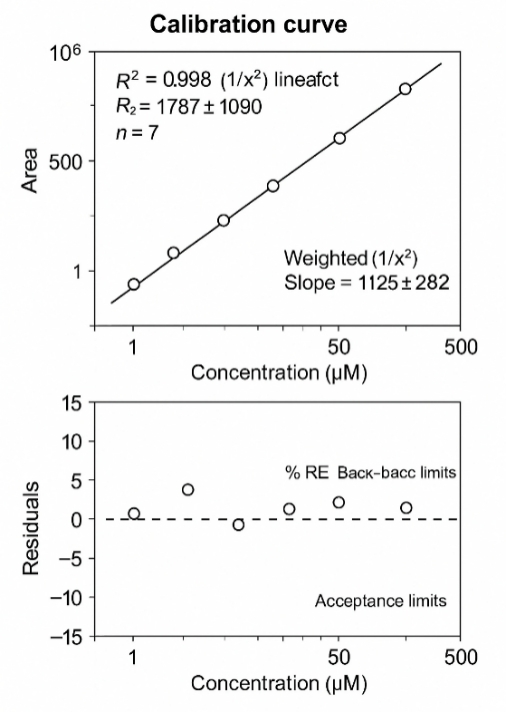
- Linearity: dynamic range about 0.5–500 µM, R² ≥0.995.
- Precision: ≤10% intra-batch RSD; ≤15% inter-batch RSD(QC levels)。
- Accuracy/Recovery: 85–115% with isotope-labelled internal standards.
- Matrix effect (corrected): within ±15% after IS/matrix matching.
- Carryover: <0.1× LLOQ verified with post-high blanks.
- Phe/Tyr ratio robustness: propagated CV typically ≤5–8% in dual assays.
- Isotope tracing repeatability: major isotopologue CV ≤10–15%.
- Throughput: approx. 60–120 samples/day/instrument(method/panel dependent)
Phenylalanine LC‑MS/MS Method and Analytical Performance
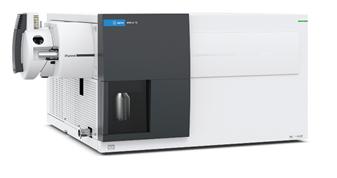
Platform: Triple-quadrupole LC-MS/MS (MRM); HILIC or reversed-phase workflows by matrix
Internal Standards: isotope-labelled Phe (preferred) or validated analogue
Preparation: protein precipitation ± derivatization (if required); low-temperature handling to minimize conversion
Calibration & QC: matrix-matched calibration; multi-level QC (L/M/H) per batch
Typical performance (insert your validated numbers)
- Linearity: broad dynamic range for physiological/experimental levels
- LLOQ: sub-µM to low-µM (matrix-dependent)
- Precision: intra/inter-batch RSD within acceptance criteria
- Recovery & matrix effects: assessed and corrected (IS and/or matrix matching)
Phenylalanine Analysis Workflow: Step by Step
Sample Requirements for Phenylalanine Testing
| Matrix |
Minimum volume / mass |
Container |
Pre-analytical handling |
Storage & shipping |
Notes |
| Plasma / Serum |
≥ 80 µL (ideal 100 µL) |
EDTA or heparin tube |
Centrifuge promptly (≤30 min); keep on ice; avoid hemolysis |
Store −80 °C; ship on dry ice |
Record anticoagulant; limit freeze–thaw (≤3×) |
| CSF |
≥ 60 µL |
Sterile, low-bind tube |
Handle cold; minimize dwell time; no additives |
Store −80 °C; ship on dry ice |
Avoid repeated freeze–thaw |
| Urine |
≥ 250 µL |
Plain polypropylene |
Mix well; note specific gravity; aliquot if needed |
Store ≤−20 °C (short) or −80 °C; ship cold/dry ice |
Dilution factors must be recorded |
| Tissue homogenate |
≥ 25 mg eq. |
Pre-chilled, low-bind tube |
Pre-cool tools; rapid quench (e.g., cold MeOH); keep on ice |
Store −80 °C; ship on dry ice |
Provide wet weight and buffer composition |
| Cell supernatant / Media |
≥ 250 µL |
Sterile polypropylene |
Quench metabolism (cooling/organic); clarify by spin |
Store −80 °C; ship on dry ice |
Note time-point, cell density, treatment |
General tips: aliquot to avoid re-freeze; label with sample ID, matrix, collection time, and treatment; include a sample manifest with matrix, volume, and any dilution.
What You Receive: Deliverables from Our Phenylalanine Analysis
- Project overview, sample inventory, method summary
- Quantification table: Phe (units specified); optional Tyr and Phe/Tyr ratio
- Representative chromatograms/spectra and QC metrics (linearity, precision, recovery, matrix effects)
- Isotope tracing (optional): isotopologue distributions and corrected abundances
- File formats: PDF report + raw/processed data (CSV/Excel) upon request
Applications of Phenylalanine Analysis in Research and Industry
Case. Different Phenylalanine Pathway Responses to Cold Stress Based on Metabolomics and Transcriptomics in Tartary Buckwheat Landraces
Background:
Tartary buckwheat, cultivated for centuries by the Yi people in Southwest China, thrives in challenging environments due to its robust adaptation mechanisms. This crop's diverse landraces are crucial for maintaining biodiversity and meeting local nutritional needs.
Understanding how these landraces respond to cold stress at molecular and metabolic levels is vital for enhancing their resilience and improving agricultural sustainability in mountainous regions.
Samples:
Tartary buckwheat landraces RG and TM, obtained from Yi villages in Liangshan Prefecture, China, and the cultivar "Chuan Qiao NO.2" from the Institute of Crop Science, underwent sterilization with 1% H2O2, followed by germination under controlled conditions (25 °C, 16h light/8h dark).
Cold stress treatment (4 °C, 16h light/8h dark) for 4 days was applied, after which plant materials were promptly frozen in liquid nitrogen and stored at −80 °C. The analysis included 3 replicates for RNA-seq and 6 for metabolomics.
Technical methods procedure:
Total Flavonoids and rutin were extracted with 80% methanol, ultrasonicated, and centrifuged. Supernatants were analyzed using HPLC with a UV detector and a C18 column, using a gradient elution of methanol and acetic acid in water.
Anthocyanins were extracted from seedlings with water/formic acid, ultrasonicated, and centrifuged. The content was analyzed at 520 nm using HPLC with a C18 column and a gradient of water/formic acid and acetonitrile/formic acid.
Total RNA was isolated using Plant RNA Purification Reagent, with quality assessed by a Bioanalyzer and quantified by NanoDrop. cDNA libraries were constructed using the TruSeq RNA Sample Prep Kit. Libraries were sequenced on an Illumina HiSeq xten platform (2 × 150 bp).
Clean reads were processed and aligned to the reference genome using SeqPrep, Sickle, and HIASAT. Assembled reads were analyzed using StringTie, and differential expression was quantified using RSEM and EdgeR. Functional enrichment analysis was performed with Goatools and KOBAS.
Metabolites analysis was performed with a liquid chromatography system coupled to a triple time-of-flight mass spectrometer, using a BEH C18 column and a gradient elution method. PCA and OPLS-DA were used to analyze variations in metabolite profiles. Significance was determined using Student’s t-test with SPSS software, considering P < 0.05 as significant.
Results
Total flavonoid content and specific flavonoids like rutin and cyanidin 3-O-rutinoside were analyzed under cold stress, showing significant increases, particularly in the TM cultivar of Tartary buckwheat.
Genes involved in flavonoid biosynthesis, such as PAL (Phenylalanine Ammonia-Lyase), C4H (Cinnamate-4-Hydroxylase), and F3H (Flavanone 3-Hydroxylase), were significantly upregulated under cold stress in the TM cultivar. Significant differences in gene expression were observed between the cultivars TM, RG, and CQ, indicating varying responses to cold stress.
The combined metabolomics and transcriptomics approach effectively revealed the differential responses of Tartary buckwheat cultivars to cold stress. The TM cultivar exhibited a more robust response, with higher increases in flavonoid content and upregulation of stress-related genes.
 Fig 1. (A) Changes in the expression of genes related to rutin and proanthocyanidin biosynthesis in Tartary buckwheat under cold stress. For the heatmap, each row represents a gene, and three columns represent three Tartary buckwheat genotypes (TM, RG, and CQ). PAL: phenylalanine ammonia lyase; C4H: cinnamate-4-hydroxylase; 4CL: 4-coumarate CoA ligase; CHS: chalcone synthase; CHI: chalcone isomerase; F3H: flavanone-3-hydroxylase; F3′H: flavonoid-3′-hydroxylase; F3′5′H: flavonoid-3′5′-hydroxylase; FLS: flavonol synthase; and DFR: dihydroflavonol reductase. (B) Heatmap of changes in the expression of transcription factors under cold stress. A total of 34 transcription factors (belonging to five groups) were differentially expressed. (C) Heatmap of changes in the expression of genes related to proline and MDA under cold stress. I: genes related to MDA and II: genes related to proline.
 Fig 2. Changes in metabolites in three Tartary buckwheat phenotypes in response to cold stress. (A) Amino acids and their derivatives, (B) organic acid and their derivatives, (C) sugars and their derivatives, (D) flavone biosynthesis, and (E) anthocyanin biosynthesis.
Reference
- Song, Y. (2022). "Different Phenylalanine Pathway Responses to Cold Stress Based on Metabolomics and Transcriptomics in Tartary Buckwheat Landraces." Journal of Agricultural and Food Chemistry 70(2), 687-698.
High Levels of Oxidative Stress Early after HSCT Are Associated with Later Adverse Outcomes
Cook, E., Langenberg, L., Luebbering, N., Ibrahimova, A., Sabulski, A., Lake, K. E., ... & Davies, S. M.
Transplantation and Cellular Therapy
Year: 2024
MS-CETSA Functional Proteomics Uncovers New DNA-Repair Programs Leading to Gemcitabine Resistance
Nordlund, P., Liang, Y. Y., Khalid, K., Van Le, H., Teo, H. M., Raitelaitis, M., ... & Prabhu, N.
Research Square
Year: 2024
Teriflunomide/Leflunomide Synergize with Chemotherapeutics by Decreasing Mitochondrial Fragmentation via DRP1 in SCLC
Mirzapoiazova, T., Tseng, L., Mambetsariev, B., Li, H., Lou, C. H., Pozhitkov, A., ... & Salgia, R.
iScience
Year: 2024