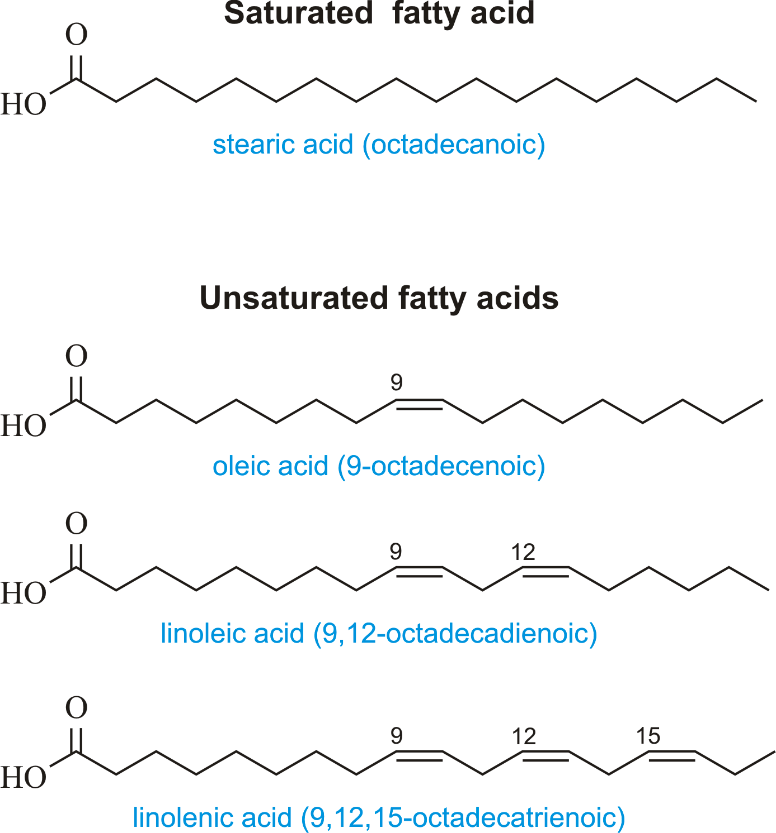
Fatty acids are divided into saturated fatty acids and unsaturated fatty acids. Unsaturated fatty acids are divided into monounsaturated fatty acids and polyunsaturated fatty acids according to the degree of unsaturation.
Lipids are an important substance for the body to store and supply energy, as well as an important structural component of biofilms. Different types of fatty acids are related to a variety of metabolic diseases, such as diabetes, coronary heart disease and non-alcoholic fatty liver. Qualitative and quantitative analysis of fatty acids can promote research on related mechanisms and evaluate potential biomarkers of diseases. Changes in the interaction between the microbial flora and the host under different physiological conditions or environments may cause changes in fatty acid levels. The study of fatty acid changes in the microbial flora can also prompt relevant research information.
The fatty acids in the microbial flora can provide information on the structure of the microbial community and serve as a classification basis for identifying bacteria. It can also be used to study the nutritional status and metabolic activities of the community structure.
Food ingredients and products such as dietary supplements (such as fish oil) or drugs also contain various fatty acids. Fatty acid composition analysis can help you determine the identity and quantity of various fatty acids in these lipid products, and provide important product information.
According to the requirements of different molecular structures, Creative Proteomics provides a series of fatty acid analysis services based on GC-MS and LC-MS. In addition, we can also provide quantitative testing services for short-chain fatty acids. Our fatty acid analysis services can be applied to many industries, including biology, pharmaceuticals, agriculture, animal husbandry, food, nutrition, environment and other fields.
Gas Chromatography with Flame Ionization Detection (GC-FID): High sensitivity, reliable quantification, cost-effective, suitable for routine analysis.
Gas Chromatography with Mass Spectrometry (GC-MS): High sensitivity, specificity, structural elucidation, suitable for complex mixtures.
Liquid Chromatography with Mass Spectrometry (LC-MS): Excellent separation efficiency, sensitivity, accurate identification, versatility in method development.
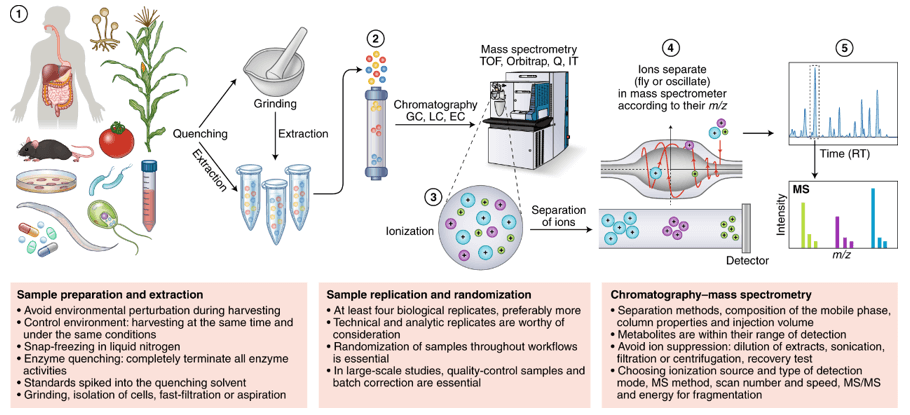
 Figure 1. Fatty acids analysis service workflow.
The first step is to extract fatty acids from the sample matrix, which can be achieved through different approaches:
Fatty acids are typically derivatized to improve their volatility and thermal stability for GC analysis. Common derivatization methods include:
Quick-freeze in liquid nitrogen and store at -80°C, and send it on dry ice.
Please contact us for other sample types and dosages.
| Content | Description |
|---|---|
| Data Preprocessing | - Raw Data Conversion: Convert raw data files to a suitable format. - Peak Detection: Identify fatty acid peaks. - Noise Reduction: Remove data noise. - Alignment: Align peaks across samples. |
| Peak Annotation | - Compound Identification: Match peaks with a reference database. - Retention Time & Mass Accuracy Correction: Adjust for variations. |
| Quantification | - Peak Integration: Calculate metabolite abundance. - Normalization: Correct for variations. - Internal Standards: Use if available. |
| Statistical Analysis | - Univariate Analysis: Identify significant differences. - Multivariate Analysis: Explore patterns and group samples. |
| Metabolite Pathway Analysis | - Pathway Enrichment Analysis: Determine affected pathways. - Network Analysis: Explore metabolite interactions. |
| Visualization | - Heatmaps: Visualize metabolite abundance patterns. - Volcano Plots: Display fold changes vs. significance. - Pathway Maps: Diagram affected pathways. |
| Biological Interpretation | - Biomarker Discovery: Identify potential biomarkers. - Biological Insights: Understand the significance of changes. |
| Validation | - Targeted Analysis: Validate findings with standards. |
| Reporting and Visualization | - Generate Reports: Compile results, figures, and tables. - Publication-Quality Figures: Create visualizations for publication. |
| Integration with Other Data | - Combine metabolomics data with other omics data for a comprehensive view. |
Creative Proteomics offers several approaches to provide fatty acids analysis service and deliver precise and detailed data and analysis report. If you want to detect other metabolites but have not found them, you can tell us through the inquiry form, and our technicians will communicate with you.
The background of the study revolves around CAD-31, a potential therapeutic candidate for Alzheimer's disease (AD). It originates from a chemical structure derived from curcumin and was selected for its neuroprotective and neurogenic properties. The study aimed to investigate CAD-31's efficacy in a therapeutic AD model, its impact on neuroprotective activities, and its safety profile.
The study primarily involved two sets of samples:
Animal Model: Transgenic mice (APPswe/PS1∆E9) with severe cognitive deficits and AD pathology at an advanced age (13 months) were used as the experimental subjects. These mice were administered CAD-31 to assess its therapeutic effects.
In Vitro Assays: Various in vitro assays were conducted using primary cortical cells, HT22 cells expressing the brain-derived neurotrophic factor receptor, primary cortical neurons, an in vitro ischemia model, and assays related to extracellular and intracellular Aβ toxicity. These assays helped evaluate CAD-31's neuroprotective properties.
Sample Collection: Cortex and plasma samples were collected from CAD-31-treated and control mice to assess CAD-31's impact on metabolite profiles.
Metabolite Extraction: Metabolites were extracted using methods like liquid-liquid or solid-phase extraction to isolate them from the biological samples.
Instrumentation: Advanced analytical instruments like LC-MS or GC-MS were used to analyze the extracted metabolites, detecting and quantifying a wide range of metabolites.
Data Acquisition: Comprehensive data on metabolite abundance, mass spectra, retention times, and peak intensities were generated during analysis.
Data Processing: Data underwent processing, including alignment, peak picking, and normalization to ensure data quality.
Metabolite Identification: Mass spectra and retention times were matched with known metabolites in databases for identification.
Statistical Analysis: Statistical tests like t-tests or ANOVA were used to identify significant changes in metabolite levels between CAD-31-treated and control groups.
Pathway Analysis: Pathway enrichment analysis revealed the impact of CAD-31 on significant metabolic pathways.
Visualization: Results were visualized using graphs and heatmaps to illustrate changes in metabolite profiles.
Interpretation: The study aimed to understand the physiological effects of CAD-31 exposure and identify potential biomarkers or affected metabolic pathways.
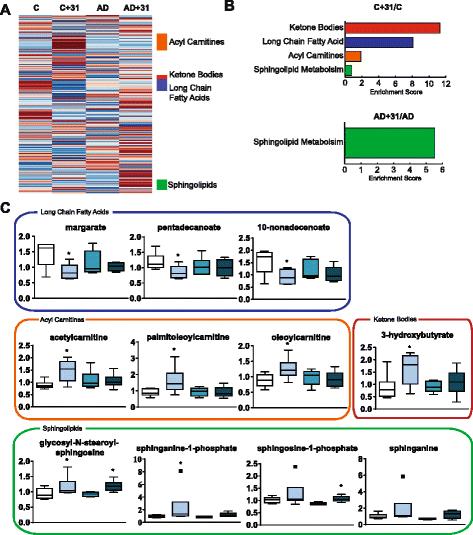 Metabolic analysis of plasma shows effects on lipid metabolism.
Reference
Get Your Custom Quote
Explore the future of metabolomics with Creative Proteomics. Discover cutting-edge solutions for metabolic analysis and research.
Copyright © 2026 Creative Proteomics. All rights reserved.