What Is Animal Metabolomics and Why It Matters for Preclinical & Translational Research
Animal metabolomics is the comprehensive analysis of metabolites — small molecules below 1,500 Da — in biological samples from laboratory and veterinary animal models. Unlike human studies, animal experiments provide controlled genetic backgrounds, defined environmental conditions, access to tissues that cannot be sampled in humans (brain, liver, heart, kidney), and the ability to collect longitudinal samples from the same individual — making animal metabolomics the essential bridge between in vitro mechanistic studies and human translational research.
Our service covers the full analytical pipeline across three complementary modalities — all combinable from the same sample set. Fecal metabolomics captures gut microbial activity, tissue metabolomics reveals organ-level metabolic reprogramming, and biofluid profiling provides systemic readouts of metabolic state. The result is the most complete metabolic picture available for your animal model — from hypothesis generation through publication-ready data.
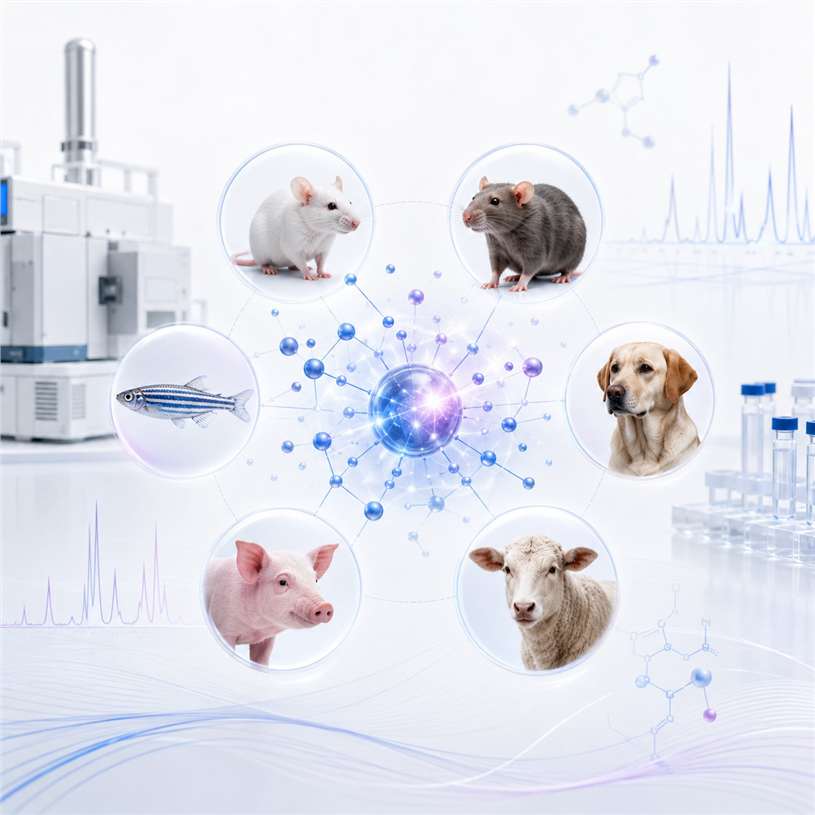
Animal Metabolomics Service Portfolio — Three Complementary Modalities for Complete Metabolic Coverage
Why Choose Our Animal Metabolomics Services
- 15+ Years of Expertise, 500+ Animal Projects Completed
Samples processed from every major laboratory species across oncology, neuroscience, immunology, metabolic disease, cardiovascular, and toxicology models — translating to species- and matrix-specific protocols refined through thousands of experiments.
- Multi-Species, Multi-Matrix, Multi-Platform — One Integrated Service
From a single mouse brain region to a longitudinal NHP study with 500+ samples — standardized protocols per species (9), per matrix (15+), and per platform (LC-MS, GC-MS, NMR) ensure consistent data quality across your entire project portfolio.
- Transparent QC Metrics Published With Every Report
Pooled QC RSD per metabolite class, internal standard recovery per sample, blank carryover, and batch-effect documentation — every QC metric that matters for manuscript reviewers is plotted, tabulated, and delivered.
- End-to-End Service — Experimental Design Through Publication
We engage at study design: species selection, sample size estimation, sampling timepoint optimization, confounder identification (anesthesia, circadian rhythm, diet). Bioinformatics team delivers complete analysis, pathway interpretation, and publication-ready figures.
- Global Sample Logistics & 24-Hour Integrity Verification
Dry ice shipping with temperature loggers worldwide. Sample integrity confirmed within 1 business day. Collection kit protocols provided before your experiment begins.
- Reproducibility by Design
Raw instrument files, complete processing parameters, annotated R Markdown/Jupyter notebooks, and methods documentation delivered alongside processed results — every step traceable and repository-ready (MetaboLights, Metabolomics Workbench).
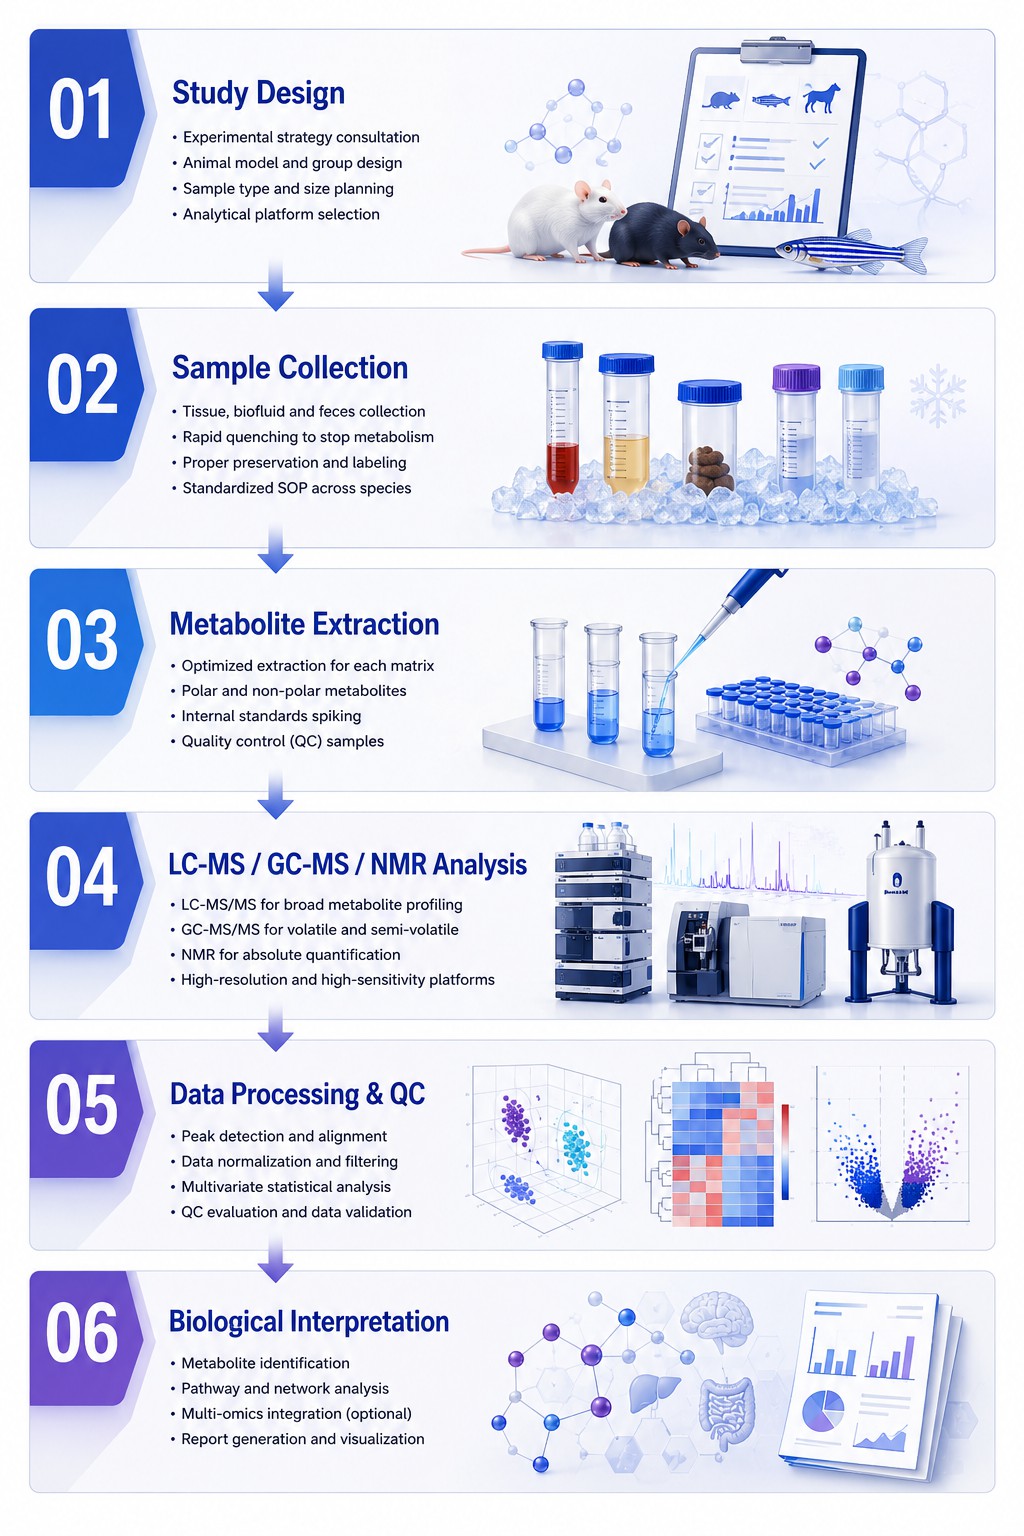
Animal Metabolomics Workflow — From Experimental Design to Biological Insight
Analytical Platform & Instrumentation for Animal Metabolomics Profiling
LC-MS/MS Platforms
SCIEX QTRAP 6500+ — Triple quadrupole/linear ion trap with scheduled MRM for targeted quantification (HILIC and RP C18, both ESI modes). AB SCIEX TripleTOF 5600 — High-resolution Q-TOF for untargeted metabolomics with SWATH DIA (mass accuracy below 2 ppm). Thermo Q Exactive Orbitrap — Resolution 140,000 FWHM with HCD fragmentation for untargeted discovery and isomer resolution.
GC-MS/MS & NMR Platforms
Agilent 7890B-5977A GC-MS — EI source, DB-5MS/DB-FFAP columns, SIM for targeted or full scan for untargeted. Covers organic acids, derivatized amino acids, sugars, fatty acids, sterols. Thermo TSQ 9000 GC-MS/MS — Triple quadrupole with SRM for low-abundance volatile metabolites (EI and CI modes). Bruker Avance 600/800 MHz NMR — 1D 1H-NMR for biofluid profiling without derivatization; 2D NMR for structural elucidation.
Platform Selection Guide — LC-MS vs GC-MS vs NMR
| Parameter |
LC-MS/MS |
GC-MS/MS |
NMR |
| Metabolite Classes |
Polar and non-polar: amino acids, nucleotides, organic acids, lipids, bile acids, acylcarnitines, hormones |
Volatile and derivatizable: organic acids, sugars, fatty acids, sterols, amines, short-chain fatty acids |
High-abundance metabolites: organic acids, amino acids, sugars, amines, creatine, lipoproteins |
| Sensitivity |
Highest — sub-nM to nM LOD in MRM mode |
High — nM to uM (EI); sub-nM with SRM |
Moderate — uM to mM range; top 50-200 metabolites only |
| Sample Prep |
Protein precipitation and/or LLE; minimal for polar metabolites |
Derivatization required (MSTFA/MBTFA/BF3-MeOH), adds 1-2 h |
Minimal — add D2O + internal standard; no derivatization |
| Best For |
Comprehensive profiling, targeted panels, lipidomics, low-abundance biomarker quantification |
Volatilome, organic acid profiling, sugar/polyol analysis, SCFA quantification |
Biofluid fingerprinting, lipoprotein subclasses, non-destructive analysis |
| Throughput |
15-30 min/sample (HILIC or RP); 5-10 min targeted MRM |
30-60 min/sample (gradient + derivatization) |
5-15 min/sample (1D 1H) |
| Reproducibility |
CV 5-15% untargeted; CV below 10% targeted MRM with IS |
CV 5-15% untargeted; CV below 8% targeted SRM with IS |
CV below 5%; excellent inter-lab reproducibility |
Bioinformatics & Statistical Analysis for Animal Metabolomics Data
- Exploratory & Multivariate Analysis
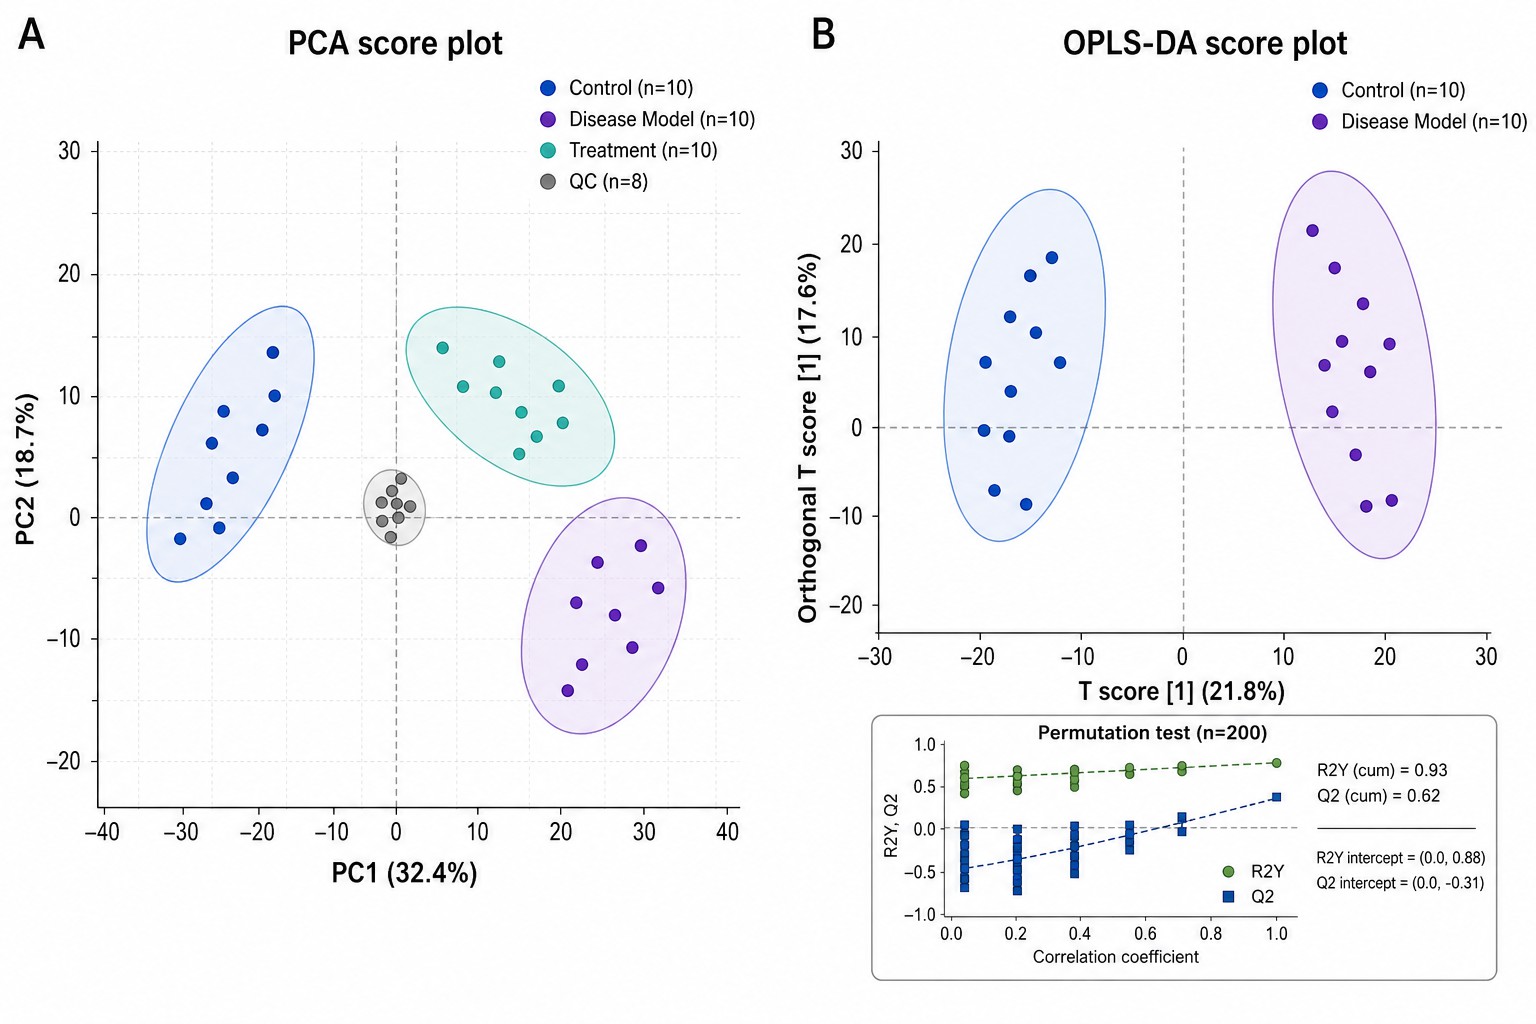
PCA for unsupervised pattern recognition and QC clustering. PLS-DA and OPLS-DA with VIP scoring and permutation testing (n above or equal to 1,000) for robust supervised classification with R2 and Q2 metrics reported against permuted null distributions.
- Univariate Differential Analysis
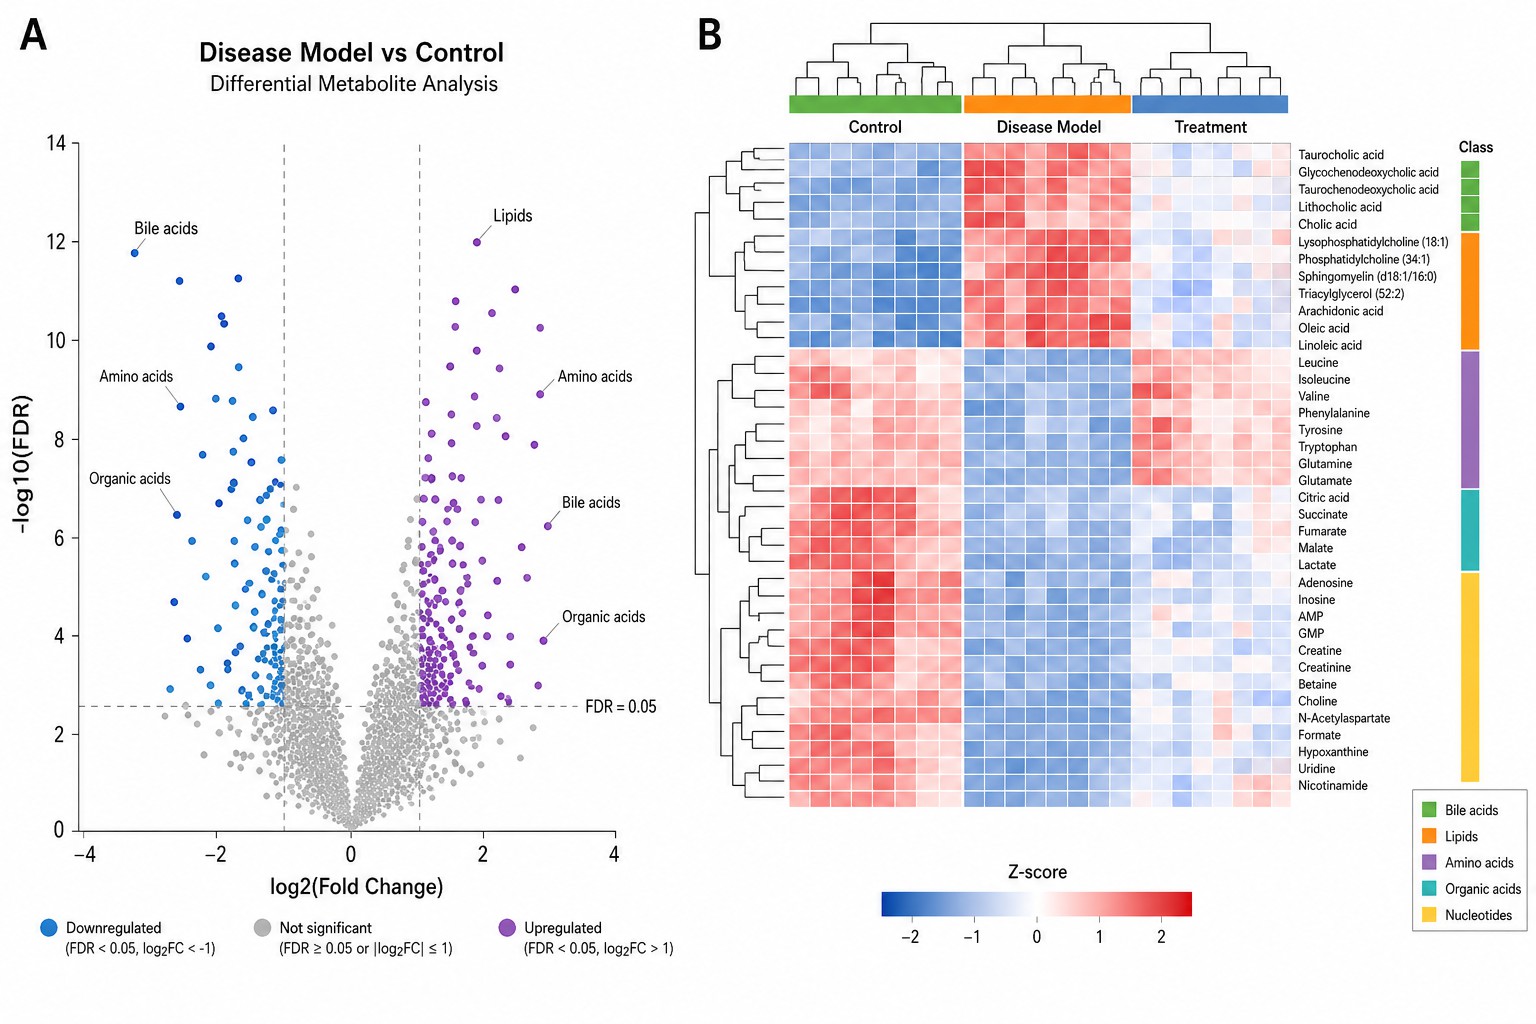
Parametric (t-test, ANOVA with Tukey/Dunnett) and non-parametric (Mann-Whitney, Kruskal-Wallis with Dunn) tests with Benjamini-Hochberg FDR correction. Volcano plots with log2(FC) vs -log10(FDR). Box and violin plots for top differential metabolites.
- Clustering & Pattern Discovery
Hierarchical clustering (Euclidean/Pearson, Ward/complete linkage) with annotated heatmaps. K-means and WGCNA for co-expression network analysis linking metabolite modules to phenotypic traits in time-series and multi-group designs.
- Machine Learning-Based Biomarker Discovery
Random forest, SVM, and XGBoost with recursive feature elimination and LASSO regularization. k-fold cross-validation (k=5 or 10) with independent test set. ROC analysis for single and combined biomarker performance.
- Pathway Enrichment & Network Analysis
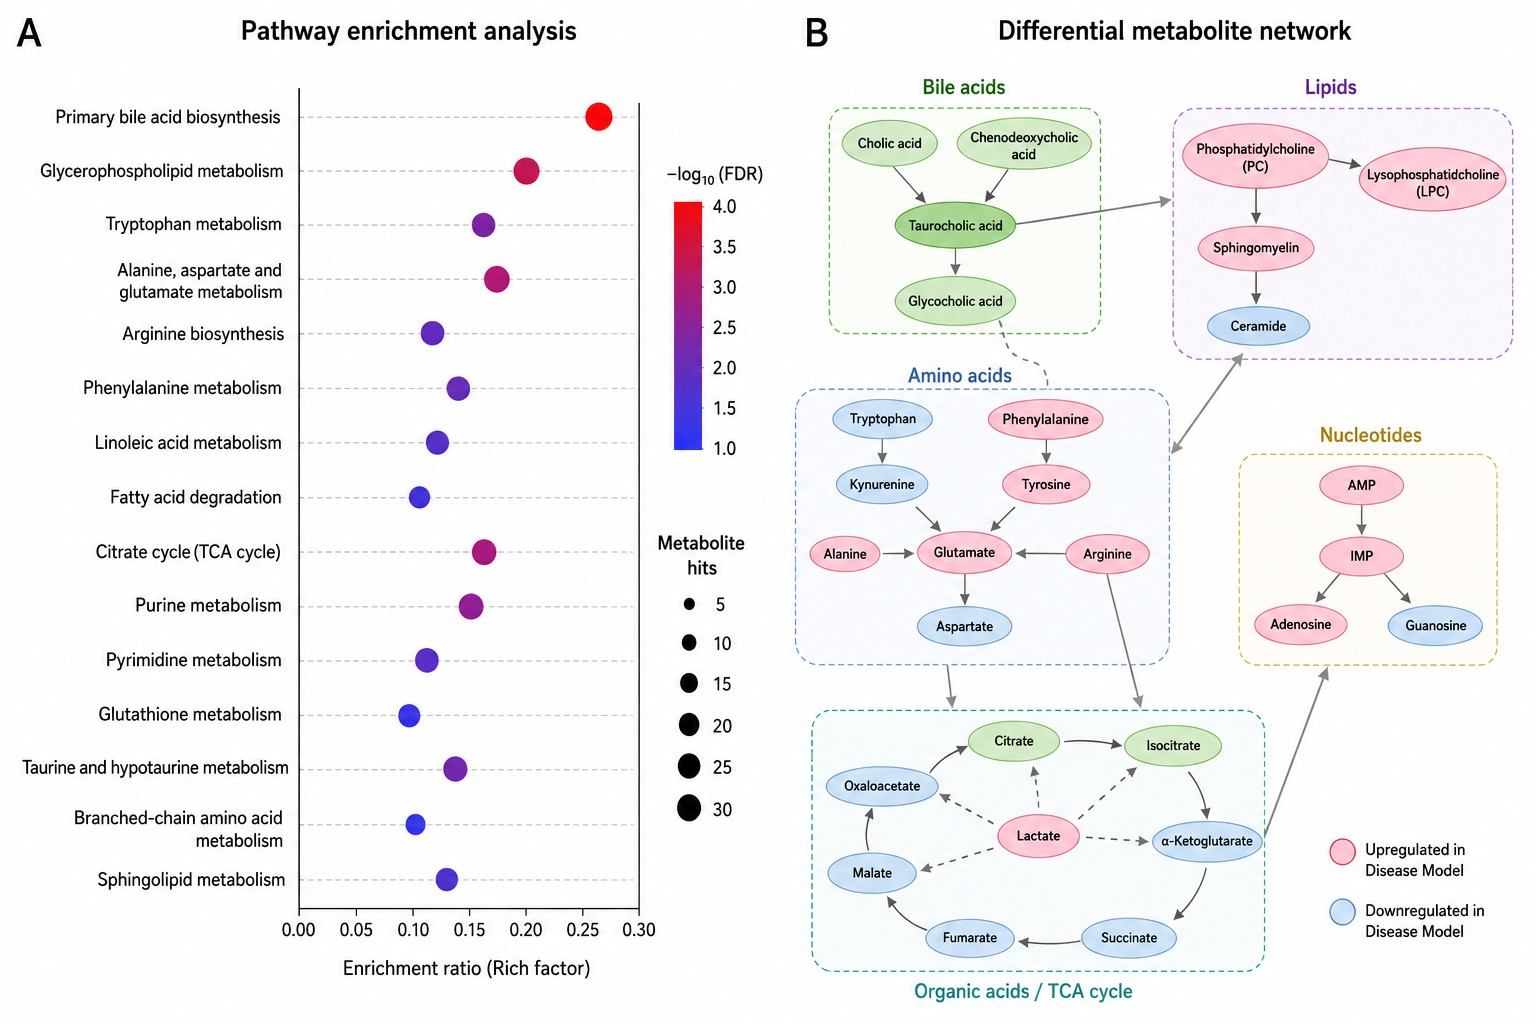
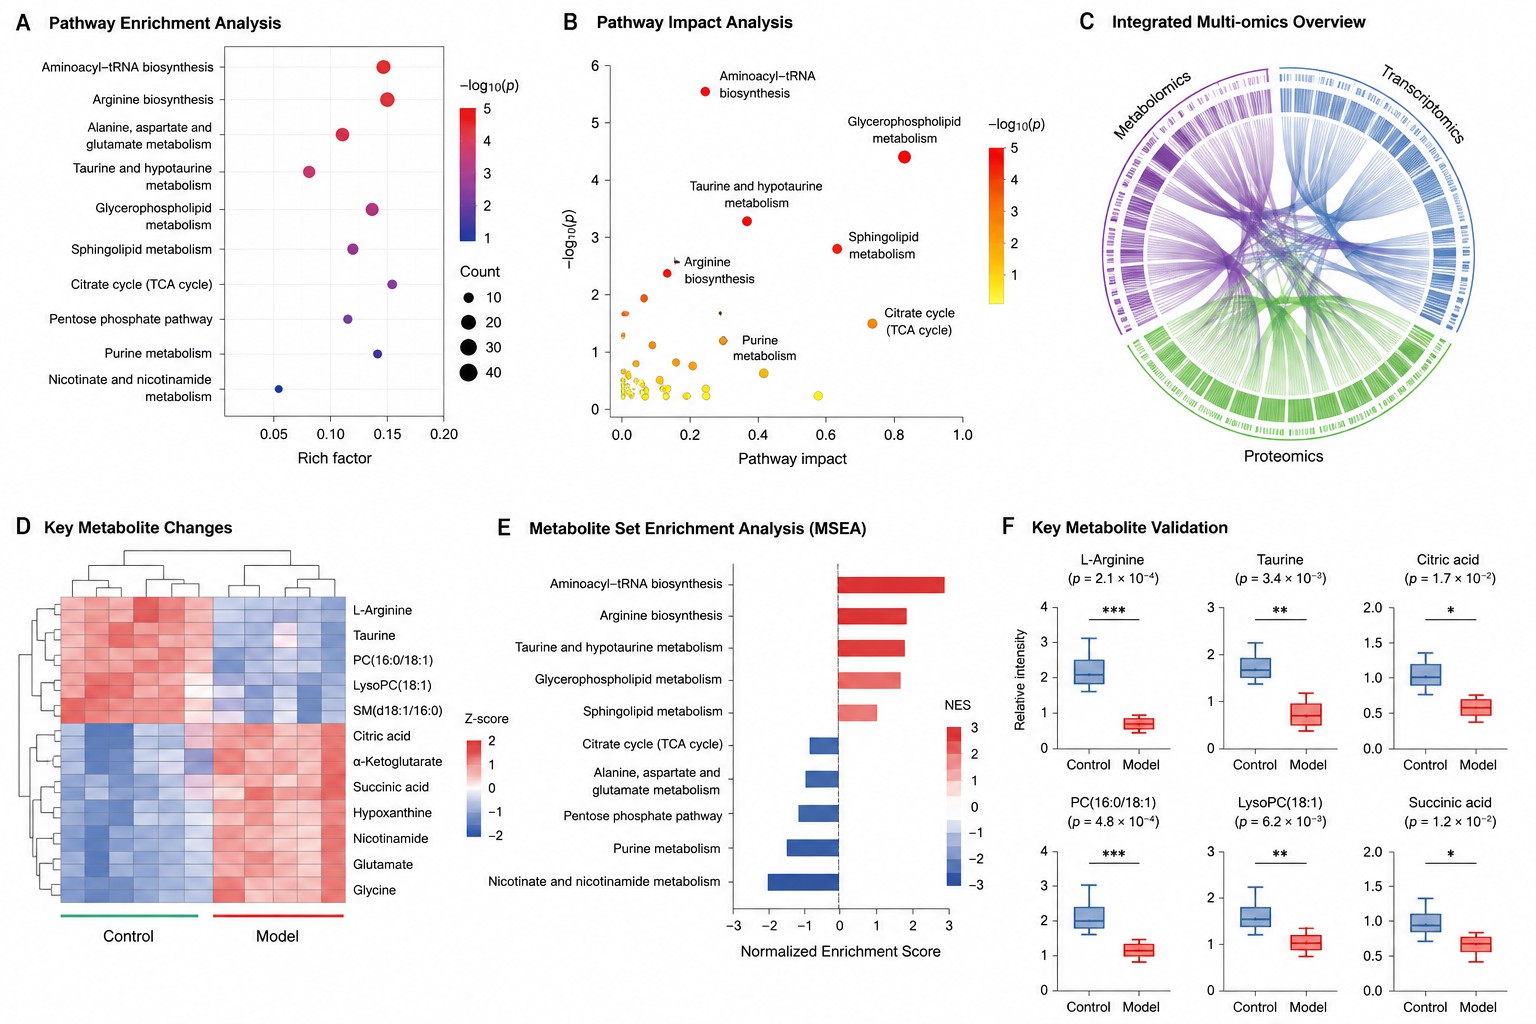
ORA (hypergeometric test) and MSEA (quantitative) against KEGG, Reactome, HMDB, and SMPDB. Integrated KEGG pathway maps with metabolite nodes colored by fold-change. Metabolite-metabolite correlation and metabolite-phenotype association networks.
- Multi-Omics Integration
DIABLO for supervised multi-omics with feature selection. MOFA+ for unsupervised factor analysis. O2PLS for bidirectional metabolomics-transcriptomics modeling. Circos plots, correlation heatmaps, and integrated pathway visualizations. Learn more about multi-omics integration.
- Time-Series & Longitudinal Analysis
Repeated-measures ANOVA and linear mixed-effects models for longitudinal designs. Trend clustering (Mfuzz/STEM) for metabolite trajectory grouping. Paired statistical tests for pre- vs. post-intervention within-animal comparisons.
Species Coverage & Model Systems for Animal Metabolomics Studies
Each laboratory animal species has unique metabolic characteristics — from the high metabolic rate of mice to the ruminant physiology of cattle. Our protocols are optimized per species for sample collection, metabolite extraction, and data normalization. For detailed sample amounts and collection protocols per matrix, see the Sample Matrix Coverage table below.
| Species / Model |
Common Research Applications |
Species-Specific Considerations |
| Mouse (Mus musculus) |
Disease models (cancer, metabolic, neuro), gene knockouts, drug efficacy & safety, microbiome, aging |
Strain-specific metabolic differences (C57BL/6 vs. BALB/c vs. FVB); genetically engineered models widely available; high metabolic rate demands rapid post-mortem processing |
| Rat (Rattus norvegicus) |
Toxicology, cardiovascular disease, neuroscience, behavioral pharmacology, nutritional intervention |
Larger blood volume than mouse enables serial sampling from same animal; well-characterized toxicology and behavioral pharmacology models; strain-specific drug metabolism differences |
| Canine (Canis familiaris) |
Veterinary biomarker discovery, aging research, breed-specific metabolic traits, companion animal drug development |
Breed-specific metabolic reference ranges; valuable spontaneous disease models (cancer, diabetes, heart disease) reflecting human pathophysiology more closely than rodents |
| Zebrafish (Danio rerio) |
Developmental biology, toxicology screening, drug discovery, genetic screens |
Micro-scale metabolomics enabled by genetic tractability and CRISPR-generated mutants; whole-organism phenotype screening; high-throughput toxicology and drug discovery |
| Non-Human Primate |
Translational pharmacokinetics, neuroscience, metabolic disease, vaccine development, aging |
Closest human metabolic physiology among laboratory species; highest translational relevance for pharmacokinetic, neuroscience, and vaccine studies |
| Pig / Swine (Sus scrofa) |
Nutrition and feed science, GI physiology, cardiovascular models, surgical models |
GI anatomy and physiology most similar to human; intestinal segment-specific metabolomics; preferred model for nutrition, gut health, and surgical studies |
| Cattle / Livestock |
Rumen metabolism, milk production, feed efficiency, metabolic health, reproductive biology |
Ruminant physiology — rumen microbial metabolism contributes uniquely to host metabolome; milk metabolomics for dairy science; large inter-individual genetic variation |
| Poultry (Gallus gallus) |
Nutritional metabolomics, egg quality, growth performance, gut health, avian disease models |
Unique lipoprotein-mediated lipid transport; egg as a distinct metabolomics matrix; high body temperature (~41 degree C) affects metabolite stability |
| Sheep (Ovis aries) |
Ruminant nutrition, wool production, reproductive biology, fetal programming, metabolic disease |
Fetal programming studies via maternal-fetal metabolomics; dual-purpose production models (meat + wool); seasonal metabolic variation in grazing animals |
Sample Matrix Coverage — Tissues, Biofluids & Biological Specimens
Our laboratory processes 15+ distinct biological matrices from animal models. Each matrix has validated collection, quenching, extraction, and normalization protocols. All samples shipped on dry ice with temperature monitoring.
| Sample Type |
Minimum Amount |
Collection & Processing |
Storage & Shipping |
| Liver Tissue |
30-50 mg (mouse/rat); 100-200 mg (large animal) |
Snap-freeze in liquid N2 immediately after dissection (warm ischemia less than 30 s). For flux studies: freeze-clamp with liquid N2-cooled Wollenberger tongs |
-80 degree C; dry ice with temperature logger |
| Brain Tissue |
10-20 mg per region (mouse); 30-50 mg (rat) |
Rapid dissection on ice-cold surface, snap-freeze in liquid N2. For regional analysis: dissect and freeze regions separately. Microwave fixation for high-energy metabolites if post-mortem degradation is a concern |
-80 degree C; dry ice with temperature logger |
| Heart Tissue |
20-30 mg (mouse); 50-100 mg (rat) |
Perfuse with ice-cold PBS to remove blood. Rapid excision, blot dry, snap-freeze in liquid N2. Record heart weight for normalization |
-80 degree C; dry ice with temperature logger |
| Kidney Tissue |
20-30 mg (mouse); 50-100 mg (rat) |
Decapsulate, bisect, snap-freeze in liquid N2. Cortex and medulla separable for region-specific analysis. Perfusion recommended |
-80 degree C; dry ice with temperature logger |
| Skeletal Muscle |
20-50 mg (mouse); 50-100 mg (rat/large animal) |
Dissect specific muscle group (gastrocnemius, soleus, tibialis anterior). Freeze-clamp in liquid N2. Record muscle type (oxidative vs. glycolytic) |
-80 degree C; dry ice with temperature logger |
| Adipose Tissue |
50-100 mg (mouse); 100-200 mg (rat) |
Dissect specific fat depot (epididymal, subcutaneous, brown adipose). Flash-freeze in liquid N2. Avoid adjacent tissue contamination |
-80 degree C; dry ice with temperature logger |
| Serum |
25-50 uL (mouse); 100-200 uL (rat); 0.5-1 mL (large animal) |
Serum tube (no additive), clot at room temp 30 min, centrifuge at 1,500 x g 10 min 4 degree C, aliquot. No gel separator tubes |
-80 degree C; dry ice with temperature logger |
| Plasma |
25-50 uL (mouse); 100-200 uL (rat); 0.5-1 mL (large animal) |
EDTA or lithium heparin tubes. Invert 8-10 times. Centrifuge within 30 min at 1,500 x g 10 min 4 degree C, aliquot. Note anticoagulant type. No gel separator tubes |
-80 degree C; dry ice with temperature logger |
| Urine |
50-200 uL (mouse); 0.5-1 mL (rat); 1-2 mL (large animal) |
Metabolic cage collection over ice. Centrifuge to remove particulates. For 24 h collection: add sodium azide (0.02%). Record collection duration and total volume for creatinine normalization |
-80 degree C; dry ice with temperature logger |
| Cerebrospinal Fluid (CSF) |
5-10 uL (mouse); 50-100 uL (rat); 100-200 uL (NHP) |
Cisterna magna puncture (mouse/rat) or lumbar puncture (large animal). Centrifuge at 10,000 x g 5 min 4 degree C, aliquot. Discard if blood-contaminated (pink) |
-80 degree C; dry ice with temperature logger |
| Feces / Stool |
20-50 mg (mouse); 50-100 mg (rat); 100-200 mg (large animal) |
Sterile cryovial, flash-freeze in liquid N2 within 30 min of defecation. For microbiome studies: freeze immediately to arrest microbial metabolism. Fresh or freeze-dried |
-80 degree C; dry ice with temperature logger |
| Bile |
5-10 uL (mouse); 20-50 uL (rat) |
Gallbladder puncture or bile duct cannulation. Flash-freeze immediately. Protect from light (bile pigments are light-sensitive) |
-80 degree C; dry ice with temperature logger |
| Synovial Fluid |
5-10 uL (mouse); 20-50 uL (rat/large animal) |
Aspirate from joint space. Centrifuge at 10,000 x g 5 min 4 degree C, aliquot. Note joint location and disease status. Hyaluronidase may be required for viscous samples |
-80 degree C; dry ice with temperature logger |
| Cell Pellet |
1-5 x 10^6 cells |
Wash 3x with ice-cold PBS, centrifuge at 300 x g 5 min 4 degree C, aspirate completely, flash-freeze dry pellet in liquid N2 |
-80 degree C; dry ice with temperature logger |
| Whole Blood |
20-50 uL (mouse); 100-200 uL (rat) |
Collect directly into extraction solvent for whole-blood metabolomics, or spot 10-20 uL onto DBS card, air-dry 2 h at room temp, store in sealed bag with desiccant |
-80 degree C (liquid); room temp (DBS cards) |
Applications of Animal Metabolomics in Biomedical, Veterinary & Agricultural Research
Animal Metabolomics Deliverables — Complete Data Package for Publication & Repository Deposition
- Quality Control Report — Pooled QC RSD per metabolite class, IS recovery per sample (80-120% acceptance), blank carryover, system suitability, batch-effect documentation. Every QC metric tabulated for manuscript supplementary materials.
- Processed Data Matrix — Normalized, batch-corrected, imputed peak intensity table (untargeted) or absolute concentration table (targeted, uM or nmol/g) in Excel and CSV formats with sample metadata integrated for direct statistical software import.
- Metabolite Identification Table — MSI Level 1-4 confidence for all detected metabolites with m/z, retention time, adduct, MS/MS fragment matches, database IDs (HMDB, KEGG, METLIN, MassBank), isotopic pattern score, and mass error (ppm).
- Statistical Analysis Report — Complete univariate (fold-change, P-value, FDR per comparison) and multivariate outputs (PCA/PLS-DA/OPLS-DA scores, loadings, VIP, permutation test). All test parameters and software versions documented.
- Publication-Ready Figures — PCA scores with QC clustering, PLS-DA/OPLS-DA scores with permutation insets, volcano plots with FDR thresholds, annotated heatmaps, KEGG pathway maps with fold-change coloring — 300 DPI TIFF + vector PDF/AI formatted to journal specifications.
- Pathway Enrichment Report — KEGG and Reactome ORA (hypergeometric, FDR-corrected) and MSEA (quantitative) with enrichment ratios, P-values, and integrated pathway maps with metabolite nodes colored by fold-change direction and magnitude.
- Methods Documentation — Complete sample preparation, acquisition parameters, data processing settings (software, versions, parameter values), and statistical methods — formatted for direct inclusion in manuscript methods section.
- Reproducible Analysis Code & Raw Data — R Markdown/Jupyter notebooks with annotated code for all analyses and figures. Raw instrument files (.mzML, .mzXML, .d) for independent re-analysis. Data structured for MetaboLights or Metabolomics Workbench deposition.
Case Study — Multi-Tissue Metabolomics Uncovers Microbiota-Driven Gut-Brain Metabolic Communication in Mice
High-coverage metabolomics uncovers microbiota-driven biochemical landscape of interorgan transport and gut-brain communication in mice
Lai, Y.J., Liu, Y.L., Tsai, M.L., et al. | Nature Communications, 2021 | IF: 14.7
DOI: 10.1038/s41467-021-26508-2
The Research Question
How does the gut microbiota shape the biochemical landscape across distant host organs? The gut-brain axis is well-established, but the specific metabolites mediating inter-organ communication — and how microbial presence alters their tissue-level distribution — remained poorly characterized. This required a systematic multi-tissue metabolomics comparison between germ-free (GF) and specific-pathogen-free (SPF) mice: quantifying hundreds of metabolites across brain, plasma, liver, and intestine simultaneously, then tracing which metabolites showed microbiota-dependent tissue enrichment.
Key Findings Enabled by Comprehensive Animal Metabolomics
| Analytical Measurement |
Biological Finding |
| Multi-Tissue Untargeted Metabolomics (HILIC + RP C18 LC-MS/MS, GF vs. SPF Mice) |
1,200+ metabolite features detected across four tissues. 346 metabolites showed significant microbiota-dependent differences. Brain tissue alone showed 120+ differential metabolites — demonstrating that microbial metabolism reaches and reshapes the brain metabolome through circulating metabolites. |
| Tissue-Specific Enrichment Analysis with Quantitative Fold-Change Mapping |
Microbiota-dependent metabolites showed tissue-specific accumulation: bile acids and tryptophan derivatives enriched in intestine/plasma; neurotransmitter precursors (serotonin, kynurenine, tryptophan, phenylalanine derivatives) significantly altered in brain of GF mice — revealing that the microbiota systemically controls neurotransmitter substrate availability. |
| Inter-Organ Metabolite Correlation Network Analysis |
Correlation networks identified specific gut-brain communication axes: tryptophan metabolism (intestine-to-brain supply), bile acid signaling (liver-to-brain via TGR5), and SCFA-mediated pathways (gut-to-systemic). The study constructed a microbiota-driven organ-to-organ biochemical transport map. |
Analytical Approach — How Our Service Replicates This Rigor
This study demonstrates the analytical framework that defines rigorous animal metabolomics: (1) multi-tissue design comparing profiles across anatomically distinct compartments rather than a single matrix; (2) dual-chromatography untargeted LC-MS/MS (HILIC + RP C18) for maximum metabolome coverage exceeding 1,200 features; (3) clean binary variable (GF vs. SPF) isolating microbiota effects; (4) inter-organ correlation network analysis identifying specific metabolite transport axes. Our service provides the same analytical depth — multi-tissue, multi-platform profiling with the bioinformatics infrastructure to map inter-organ metabolic communication in your experimental model, using the identical pipeline to this landmark study.
Reference
- Lai, Y.J., Liu, Y.L., Tsai, M.L., et al. High-coverage metabolomics uncovers microbiota-driven biochemical landscape of interorgan transport and gut-brain communication in mice. Nature Communications 12, 6000 (2021).
Selected Publications in Animal Metabolomics Research
High-coverage metabolomics uncovers microbiota-driven biochemical landscape of interorgan transport and gut-brain communication in mice
Lai, Y.J., Liu, Y.L., Tsai, M.L., et al.
Journal: Nature Communications
Year: 2021
DOI: https://doi.org/10.1038/s41467-021-26508-2
B cell-intrinsic epigenetic modulation of antibody responses by dietary fiber-derived short-chain fatty acids
Sanchez, H.N., Moroney, J.B., Gan, H., et al.
Journal: Nature Communications
Year: 2020
DOI: https://doi.org/10.1038/s41467-019-13603-6
Sex modifies the impact of type 2 diabetes mellitus on the murine whole brain metabolome
Norman, J.E., Nuthikattu, S., Milenkovic, D., & Villablanca, A.C.
Journal: Metabolites
Year: 2023
DOI: https://doi.org/10.3390/metabo13091012
Pregnancy specific shifts in the maternal microbiome and metabolome in the BPH5 mouse model of superimposed preeclampsia
Beckers, K.F., et al.
Journal: PLOS ONE
Year: 2024
DOI: https://doi.org/10.1371/journal.pone.0287145
Central biogenic amine deficiency with concomitant exploratory behavioral deficits in Dnajc12 knock-out mice
Deng, I.B., et al.
Journal: NPJ Parkinson's Disease
Year: 2025
DOI: https://doi.org/10.1038/s41531-025-00991-4
The olfactory receptor Olfr78 promotes differentiation of enterochromaffin cells in the mouse colon
Dinsart, G., Leprovots, M., Lefort, A., et al.
Journal: EMBO Reports
Year: 2024
DOI: https://doi.org/10.1038/s44319-023-00013-5
Glucocorticoid-induced osteoporosis is prevented by dietary prune in female mice
Chargo, N.J., Neugebauer, K., Guzior, D.V., et al.
Journal: Frontiers in Cell and Developmental Biology
Year: 2024
DOI: https://doi.org/10.3389/fcell.2023.1324649
Effects of Aronia melanocarpa juice-powder on hindgut function and performance in post-weaned pigs
Pearce, S.C., Anderson, C.L., & Kerr, B.J.
Journal: Journal of Functional Foods
Year: 2024
DOI: https://doi.org/10.1016/j.jff.2024.106196
The brain metabolome is modified by obesity in a sex-dependent manner
Norman, J.E., Milenkovic, D., Nuthikattu, S., & Villablanca, A.C.
Journal: International Journal of Molecular Sciences
Year: 2024
DOI: https://doi.org/10.3390/ijms25063475


 Contact Us



