Proteomics and Metabolomics Integration — Why the Enzyme-Metabolite Link Is the Most
Direct Causal Chain in Multi-Omics
Proteomics measures which enzymes are actually present — the catalytic machinery that executes
biochemistry. Metabolomics measures the substrates and
products of those enzymes — the biochemical output.
Unlike transcriptomics, where mRNA levels are buffered by translation efficiency, protein half-life, and
post-translational modification, the proteome-metabolome relationship is mechanistically tight. If a
rate-limiting enzyme increases in abundance, its downstream metabolite pools shift — directly, measurably,
and without intermediate regulatory layers. This makes proteomics-metabolomics integration the strongest
multi-omics approach for confirming causality: when both the enzyme AND its metabolic products move
together, you have dual-layer evidence that the pathway is genuinely perturbed.
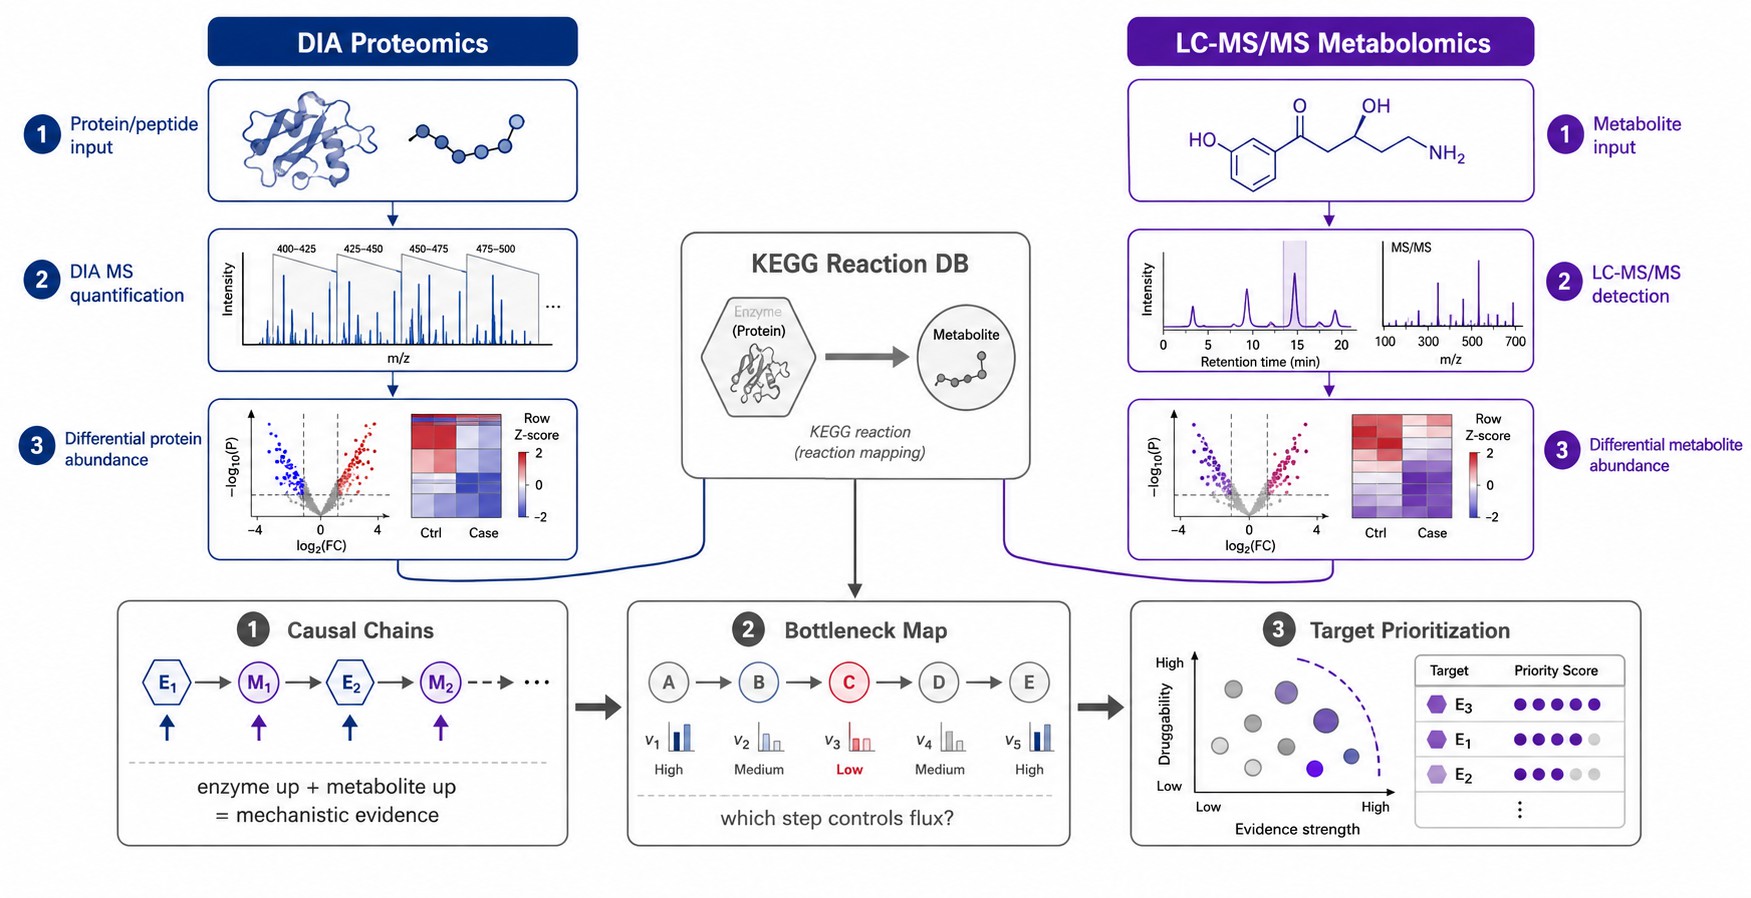
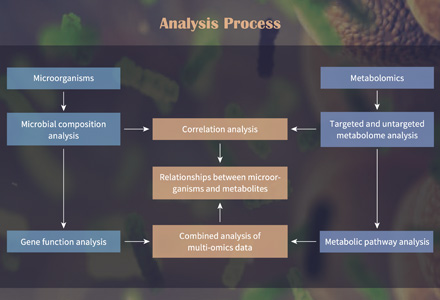
Our integrated analysis connects these two layers through multiple complementary approaches:
- Enzyme-substrate correlation — direct pairwise linkage of differentially abundant
enzymes to their cognate metabolite pools, identifying rate-limiting enzymatic steps where protein-level
changes drive metabolic flux.
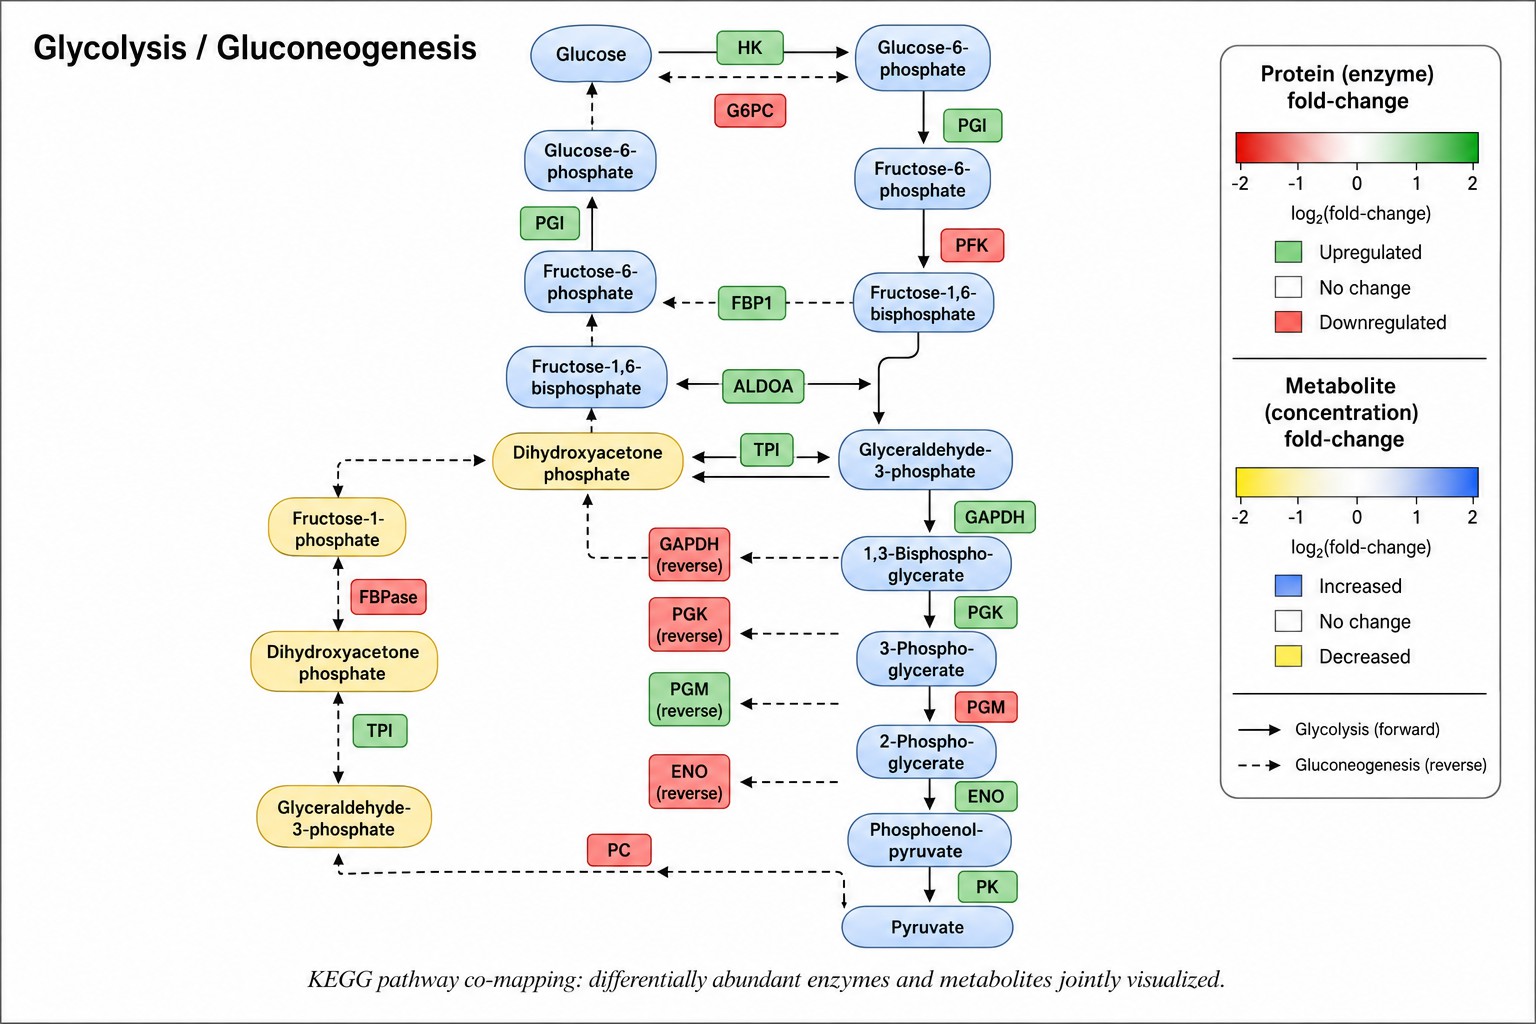
- KEGG pathway co-mapping — both differentially expressed proteins and differentially
accumulated metabolites overlaid onto shared biochemical pathways, identifying convergent regulation at
the enzyme-metabolite level.
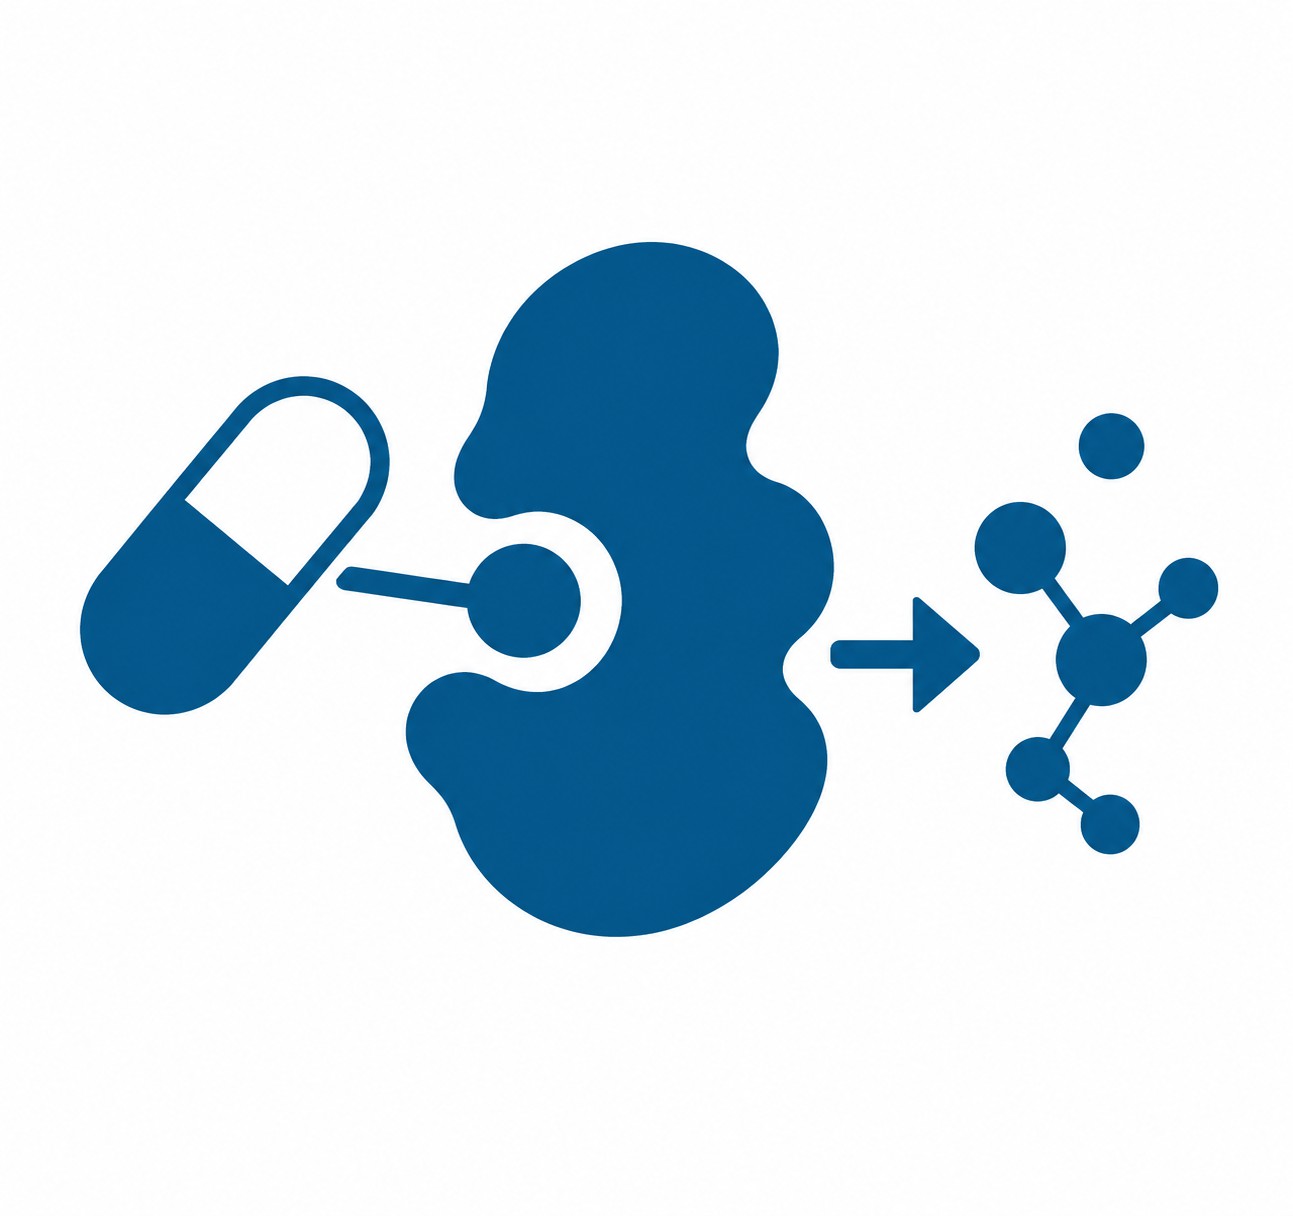
- Target engagement validation — proteomic evidence of target binding combined with
metabolomic evidence of downstream pathway modulation provides orthogonal confirmation that a drug or
genetic perturbation is hitting its intended target.
What Problem Do We Solve?
Most multi-omics studies stop at parallel lists — differentially expressed proteins here, differentially
abundant metabolites there. The mechanistic insight is in the enzyme-metabolite linkage, and that is where
most projects need the most support. Creative Proteomics resolves this with an analysis framework designed
for causal inference:
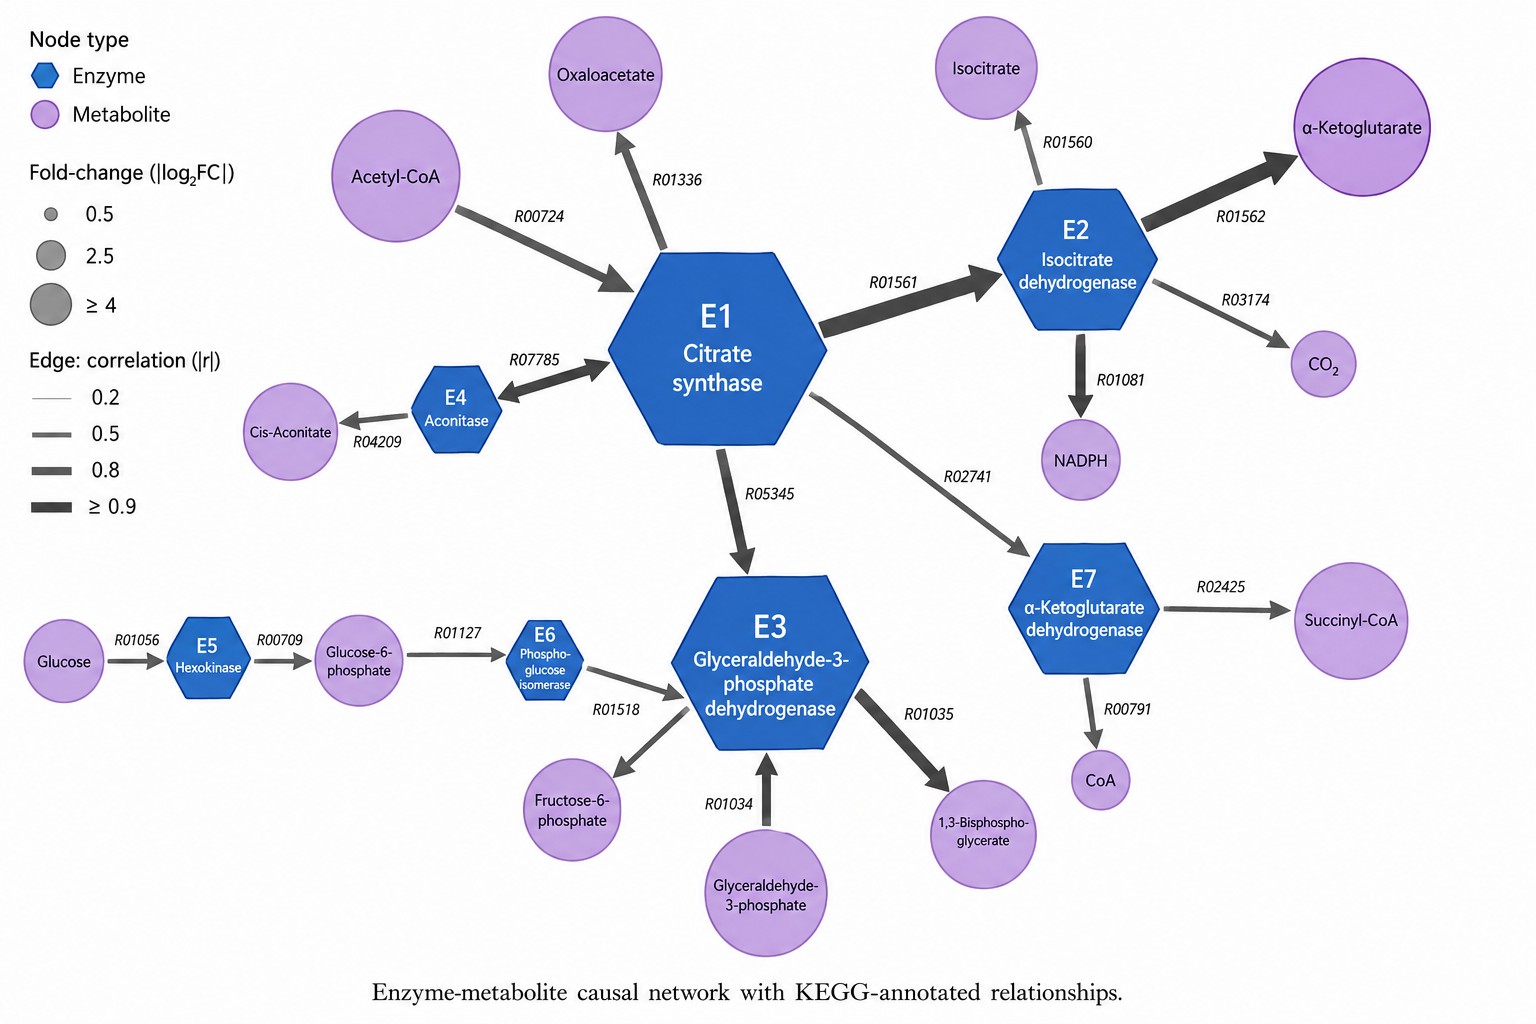
- Enzyme-metabolite causal networks, not just correlation: We map each differentially
abundant enzyme to its KEGG-annotated substrates and products, building directed enzyme→metabolite causal
chains. A correlation without a known biochemical link is flagged as exploratory; a correlation with a
documented enzyme-substrate relationship is treated as mechanistic evidence.
- Pathway bottleneck identification: When multiple enzymes in a pathway change but only
one metabolic step shows a concentration shift, that step is the bottleneck. Our analysis identifies which
enzymatic nodes actually control metabolic flux — actionable information for target prioritization and
metabolic engineering.
- Dual-layer target engagement confirmation: For drug discovery programs, proteomics
confirms that the compound binds its intended target (thermal shift, LiP-MS, or abundance change).
Metabolomics confirms that target engagement produces the expected downstream metabolic consequence. Two
orthogonal lines of evidence, one integrated analysis.
Integration Methods — From Correlation to Causal Network Inference
Different research questions require different integration strategies. The table below summarizes the key
methods we apply and the questions each answers.
| Method |
Question Answered |
Output |
Best For |
| Pearson / Spearman Correlation |
Which individual enzymes and metabolites are quantitatively linked? |
Correlation matrix, ranked enzyme-metabolite pairs, significance-filtered edge lists |
Hypothesis-driven studies with predefined enzyme or metabolite candidates |
| Enzyme-Substrate Causal Mapping |
Which enzyme abundance changes produce predicted metabolite shifts — and which do not? |
Directed enzyme→metabolite causal chains with KEGG reaction annotation, bottleneck identification
|
Drug target validation, metabolic engineering, pathway bottleneck analysis |
| WGCNA |
Which groups of proteins and metabolites co-vary as modules? |
Co-abundance modules, module-trait associations, hub protein/metabolite identification |
Exploratory studies, complex phenotypes with unknown molecular drivers |
| KEGG Pathway Co-Mapping |
Which biochemical pathways are convergently regulated at both the enzyme and metabolite level?
|
Pathview diagrams with overlaid protein abundance and metabolite concentration, enrichment
p-values per layer |
Pathway-centric mechanism studies, drug MoA elucidation |
| MOFA (Multi-Omics Factor Analysis) |
Which latent factors explain coordinated variation across the proteome and metabolome? |
Factor scores, loading matrices, variance decomposition per factor |
Unsupervised discovery of hidden multi-omics drivers |
Not every project requires all methods. During study design, we recommend the strategy that matches your biological question and data structure. Enzyme-substrate causal mapping is recommended for all target validation and MoA studies.
Why Choose Our Integrated Proteomics and Metabolomics Analysis?
- Enzyme-Metabolite Causal Chains — Not Just Correlation
We map differentially abundant enzymes to their KEGG-annotated substrates and products, building directed causal chains. When enzyme abundance and metabolite concentration move together within a documented biochemical relationship, you have dual-layer mechanistic evidence — not just a statistical association.
- Pathway Bottleneck Identification
When multiple enzymes change but only one metabolic step shifts, we identify that step as the flux-controlling bottleneck. This tells you where to intervene — which enzyme to inhibit, activate, or engineer — rather than leaving you with a list of "differentially expressed" candidates.
- Target Engagement Validation with Dual-Layer Evidence
Proteomics confirms your compound binds the target (thermal shift, abundance change, or LiP-MS). Metabolomics confirms the expected downstream metabolic shift. Together they provide orthogonal confirmation that target engagement produced functional consequence — the gold standard for MoA studies.
- End-to-End from One Provider
DIA proteomics, LC-MS/MS metabolomics, and multi-omics integration analysis are all performed in-house on the same sample. No vendor handoffs, no format incompatibilities, no split-sample variability.
Instrumentation — DIA Proteomics and LC-MS/MS Metabolomics Platforms
Proteomics (DIA / TMT)
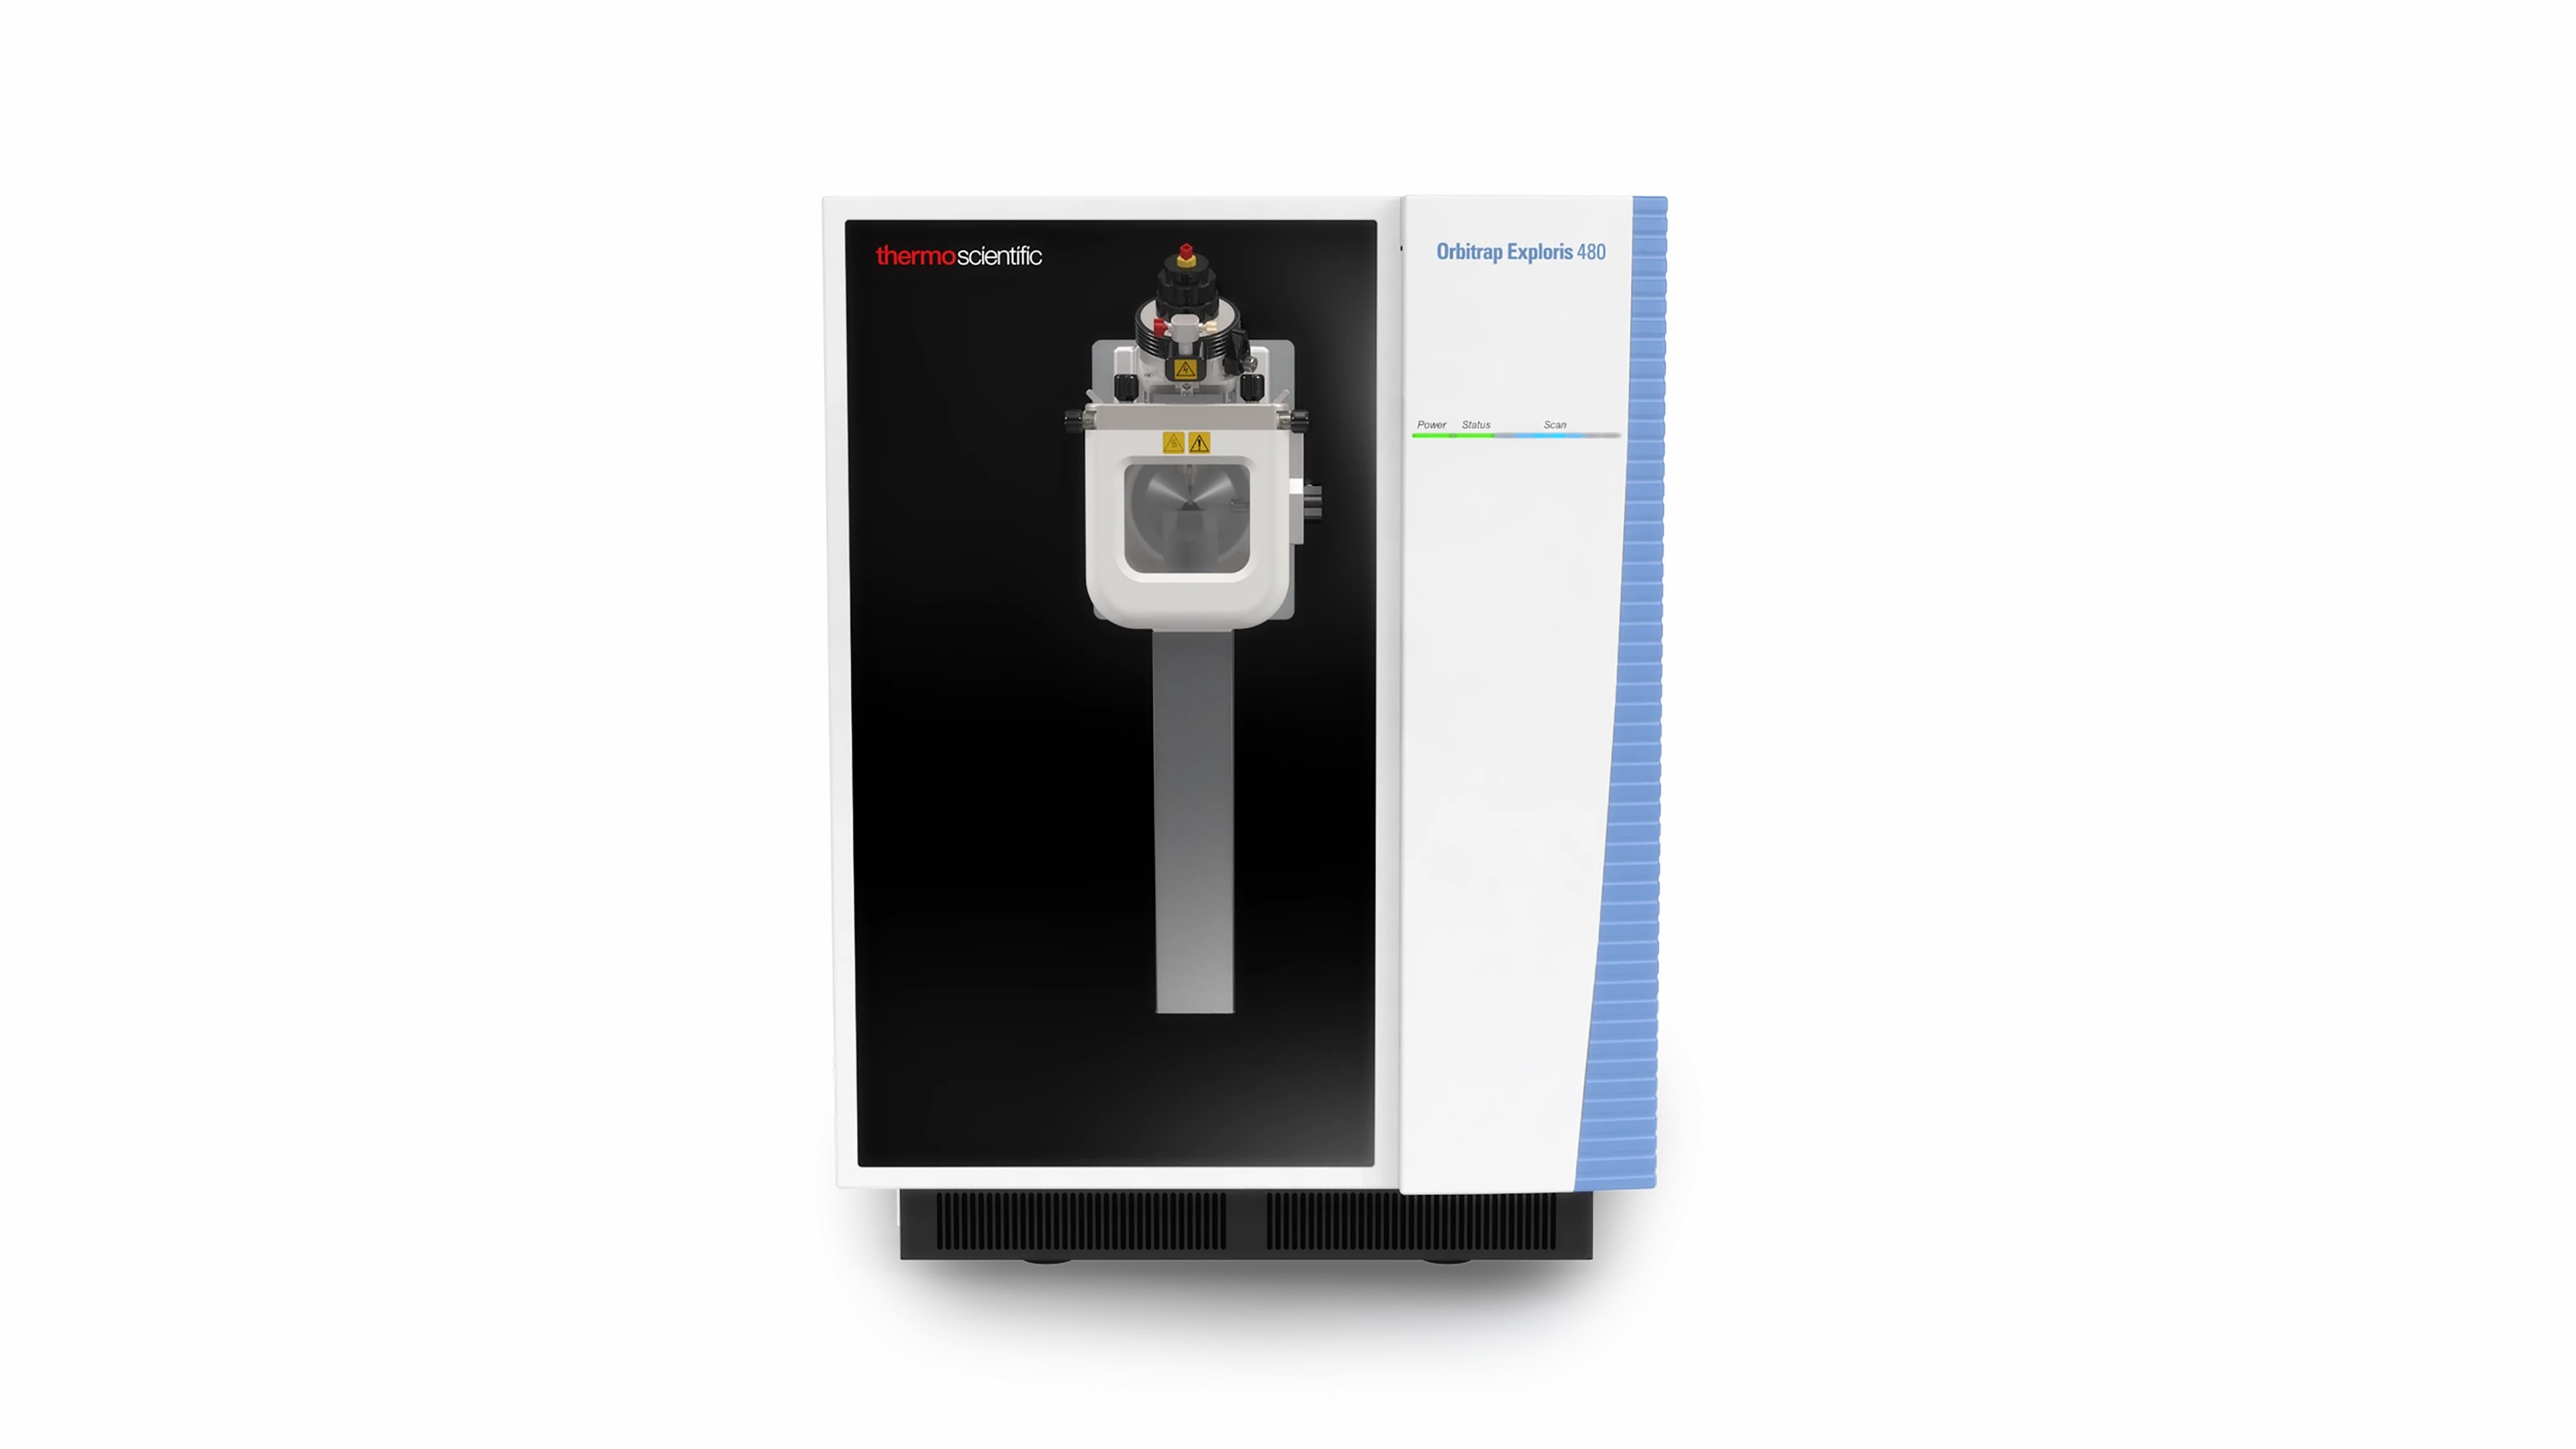
Mass Spectrometer: Thermo Orbitrap Exploris 480 / Fusion Lumos with FAIMS Pro
Acquisition: Data-Independent Acquisition (DIA) for label-free quantification; TMTpro
18-plex for multiplexed studies
LC System: Thermo Vanquish Neo UHPLC with 50 cm EASY-Spray column for deep proteome
coverage
Data Processing: Spectronaut / DIA-NN for DIA; Proteome Discoverer for TMT; FDR < 1%
at protein and peptide level
Typical Coverage: 6,000–8,000+ proteins per run (cell/tissue); 3,000–5,000+
(biofluids)
Metabolomics (LC-MS/MS)
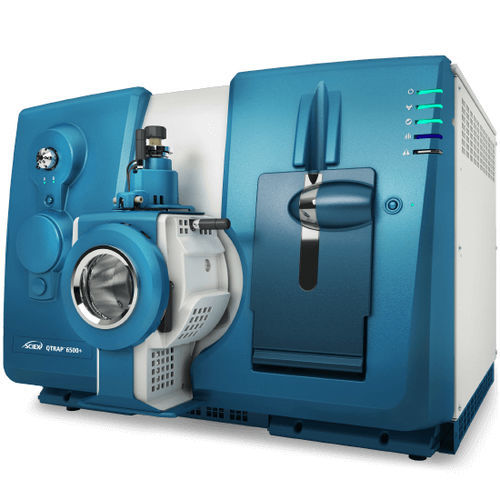
Mass Spectrometer: SCIEX QTRAP 6500+ or Thermo Q Exactive HF-X (HRAM)
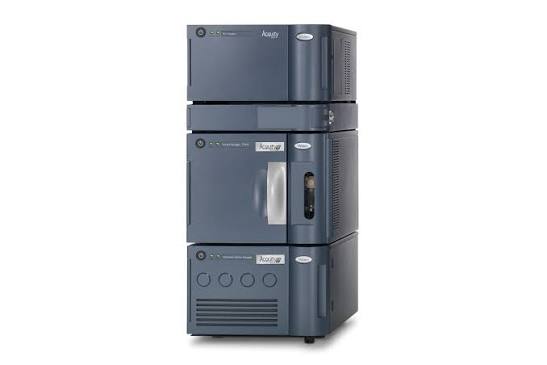
LC System: Waters ACQUITY UPLC with HILIC (polar metabolites) and C18 (lipids,
non-polar) columns
Acquisition: Full-scan MS1 (untargeted, 70–1,050 m/z) + data-dependent MS/MS; polarity
switching; targeted MRM for pathway validation
Data Processing: XCMS/MZmine 3 → CAMERA annotation → MetaboAnalyst / in-house pipeline
→ KEGG/HMDB/METLIN identification
Typical Coverage: 1,500+ annotated metabolites; pooled QC RSD ≤ 20%
Integration Software and Computational Environment
- Correlation and Causal Mapping: R (Hmisc, igraph), Python (NumPy, NetworkX); KEGG REST
API for enzyme-substrate reaction annotation; WGCNA; MOFA2
- Pathway Mapping: KEGG pathview, KEGG mapper, clusterProfiler, ReactomePA, MetaboAnalyst
6.0
- Visualization: ggplot2, ComplexHeatmap, Cytoscape, Pathview (pathway overlay with
protein and metabolite fold-changes)
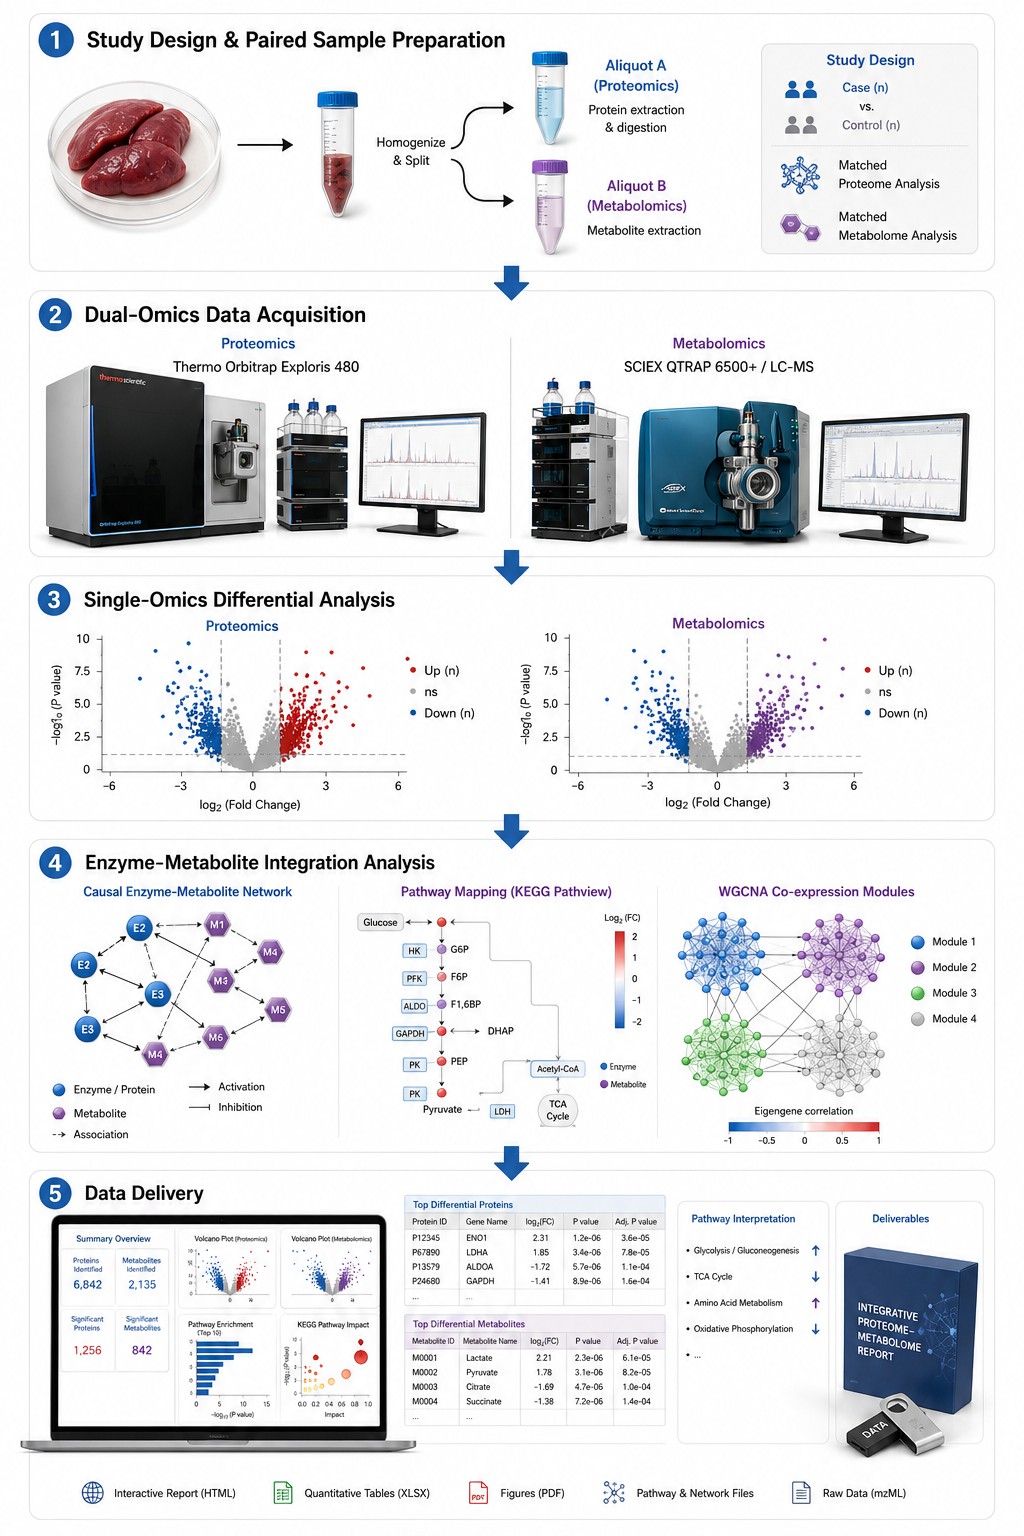
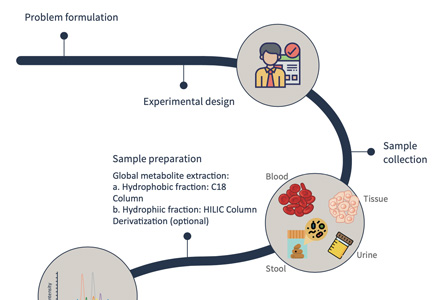
Dual-Omics Integration Workflow — From Sample to Enzyme-Metabolite Causal Networks
Sample Requirements for Proteomics and Metabolomics — Paired Collection Guidelines
| Sample Type |
Amount (Proteomics) |
Amount (Metabolomics) |
Collection Notes |
| Cell Pellets |
≥ 1 × 10⁶ cells (snap-frozen) |
≥ 2 × 10⁶ cells (snap-frozen, separate aliquot) |
Harvest and split from the same culture. Wash twice with cold PBS. For metabolomics: quench with
cold methanol. Include a medium blank. |
| Tissue (animal/plant) |
≥ 30 mg (snap-frozen) |
≥ 30 mg (snap-frozen, separate aliquot) |
Split tissue immediately at collection. For proteomics: snap-freeze. For metabolomics: snap-freeze
in liquid N₂. Do not freeze-thaw — proteolysis and metabolite degradation begin within minutes. |
| Plasma / Serum |
≥ 50 μL (depleted or neat) |
≥ 150 μL (EDTA, fasting) |
Separate plasma within 30 min of collection. For proteomics: add protease inhibitors. For
metabolomics: fasting samples recommended to reduce baseline variability. |
| Biofluid (CSF, urine, synovial) |
≥ 100 μL |
≥ 100 μL |
Centrifuge to remove cells/debris. Add protease inhibitors for proteomics. Aliquot to avoid
freeze-thaw cycles. |
| Subcellular Fractions |
≥ 50 μg total protein |
≥ 100 μg total protein equivalent |
Validate fraction purity by western blot before submission. Include whole-cell lysate as reference
for enrichment analysis. |
Critical Notes for Paired Proteomics-Metabolomics Studies:
- Rapid quenching is essential for metabolomics. Enzyme activity continues
post-collection — metabolite pools shift within seconds. Snap-freeze or cold methanol-quench immediately.
For proteomics, this is less critical (proteins are more stable), but consistent handling between paired
samples is required.
- Consistent collection timing is critical. Diurnal variation affects both the proteome and metabolome.
Collect all samples within a narrow time window.
- Minimum of 4–6 biological replicates per group for robust enzyme-metabolite correlation. Three
replicates is the absolute minimum for differential abundance testing but limits correlation power.
Deliverables — Enzyme-Metabolite Causal Chains, Pathway Maps, and Analysis-Ready
Figures
Single-Omics Results
Differential protein abundance table (.xlsx) with log2FC, FDR, and UniProt/KEGG annotation. Differential metabolite table (.xlsx) with fold-change, FDR, and KEGG/HMDB identifiers. PCA plots, volcano plots, and heatmaps for each omics layer.
Enzyme-Metabolite Causal Chains
Directed enzyme→substrate→product chains with KEGG reaction IDs. Pathway bottleneck report identifying rate-limiting enzymatic steps. Ranked enzyme-metabolite correlation pairs with biochemical link annotation.
KEGG Pathway Co-Mapping
Pathview diagrams with overlaid protein and metabolite fold-changes. Pathway enrichment tables per omics layer. Convergently enriched pathways with joint statistics.
Network and Module Figures
WGCNA module eigengene profiles. Enzyme-metabolite correlation networks (Cytoscape-compatible). MOFA factor score plots. Target engagement summary (for drug studies).
Methods and Data Appendix
Complete methods documentation. Raw data files (.raw for proteomics, .mzML for metabolomics). All processed data tables in .xlsx and .csv formats.
Applications of Integrated Proteomics-Metabolomics Analysis
Our dual-omics integration service supports researchers where connecting protein-level changes to metabolic
consequences drives discovery:
Case Study: Proteomics-Metabolomics Integration Identifies Molecular Signatures and
Drug Targets in Obesity
Integrated Proteomic and Metabolomic Profiling Identifies Distinct Molecular Signatures and Metabolic Pathways Associated with Obesity and Potential Targets for Anti-Obesity Therapies
Li, Y., Yang, H., Zhang, X., He, X., Liuli, A., Li, R., Han, X., Li, Y., and Gao, P. |
Frontiers in Endocrinology, 2025, 16, 1625501
DOI: 10.3389/fendo.2025.1625501
Background
Obesity is a systemic metabolic disorder, but the molecular drivers within adipose tissue — the organ at
the center of energy storage and endocrine dysfunction — remain incompletely characterized. Single-omics
studies identify lists of candidates but cannot link protein-level changes to their metabolic consequences.
Integrating proteomics and metabolomics from the same tissue samples reveals which protein abundance changes
actually translate into metabolic pathway disruption.
Challenge: Characterize the proteomic and metabolomic landscape of visceral adipose tissue
in obesity, identify molecular signatures that distinguish obese from healthy metabolic states, and discover
regulatory proteins whose abundance changes drive downstream metabolic dysfunction — nominating them as
anti-obesity drug targets.
Key Findings
| Metric |
Finding |
| Study design |
Visceral adipose tissue from 10 obese patients (sleeve gastrectomy) vs. 10 healthy controls;
12-month clinical follow-up |
| Differentially abundant proteins |
135 DEPs (57 up, 78 down); hub proteins KRT1/MYH9 and NF1/ATR identified via PPI network analysis
|
| Differential metabolites |
191 DAMs (110 up, 81 down); disrupted pathways: purine/pyrimidine metabolism, AMPK signaling,
cortisol biosynthesis |
| Integrated multi-omics regulatory candidates |
OSBPL10, CUL2, and PRTN3 identified as potential regulators of lipid metabolism and insulin
resistance — validated by concurrent protein and metabolite pathway changes |
| Clinical outcomes (12-month post-surgery) |
BMI: 36.19 to 25.63 kg/m2; MASLD prevalence: 100% to 50%; significant improvement in HDL,
triglycerides, glucose, ALT, AST |
What This Means for Your Dual-Omics Research
- Multi-omics integration identifies regulatory drivers that single-omics misses.
OSBPL10, CUL2, and PRTN3 were identified as key regulatory candidates — not because they were the most
differentially abundant proteins, but because their changes correlated with coordinated metabolite shifts
in lipid metabolism and insulin signaling pathways. Our enzyme-substrate causal mapping pipeline is
designed to detect exactly this kind of convergent multi-omics evidence.
- Pathway-level co-enrichment confirms biological relevance. Purine/pyrimidine metabolism
and AMPK signaling were disrupted in both proteomics and metabolomics layers. Our KEGG pathway co-mapping
visualizes which specific proteins and metabolites within these pathways are jointly perturbed — enabling
target prioritization at the pathway level.
- Clinical follow-up data validates molecular findings. The 12-month post-surgery
metabolic improvements (BMI, MASLD, lipids, liver enzymes) provide phenotypic confirmation that the
identified molecular signatures reflect genuine metabolic dysfunction — not just statistical noise. This
is the level of biological validation that our dual-layer evidence framework is designed to support.
Conclusion
This study demonstrates the power of integrated proteomics-metabolomics to move beyond candidate lists to
mechanistically grounded target nomination. Our dual-omics integration service provides the same analytical
framework — DIA proteomics, LC-MS/MS metabolomics, enzyme-substrate causal mapping, and KEGG pathway
co-mapping — enabling you to identify which protein-level changes drive metabolic dysfunction, and which
represent therapeutic opportunities.
Read the full paper: Li et al., Frontiers in Endocrinology, 2025
Integrated Proteomic and Metabolomic Profiling Identifies Distinct Molecular Signatures and Metabolic Pathways Associated with Obesity and Potential Targets for Anti-Obesity Therapies
Li, Y., Yang, H., Zhang, X., He, X., Liuli, A., Li, R., Han, X., Li, Y., and Gao, P.
Journal: Frontiers in Endocrinology, 2025, 16, 1625501
Case study reference. DIA proteomics (135 DEPs) and LC-MS/MS metabolomics (191 DAMs) in visceral adipose
tissue. Integrated analysis identified OSBPL10, CUL2, and PRTN3 as regulatory candidates for obesity
therapy.
MetaboAnalyst 6.0: Towards a Unified Platform for Metabolomics Data Processing, Analysis and Interpretation
Pang, Z., Lu, Y., Zhou, G., Hui, F., Xu, L., Viau, C., Spigelman, A.F., MacDonald, P.E., Wishart, D.S.,
Li, S., and Xia, J.
Journal: Nucleic Acids Research, 2024, 52(W1), W398–W406
Platform reference for MetaboAnalyst 6.0, supporting joint KEGG pathway enrichment, correlation network
analysis, and multi-omics factor analysis across ~130 species.
MOFA+: A Statistical Framework for Comprehensive Integration of Multi-Modal Single-Cell Data
Argelaguet, R., Arnol, D., Bredikhin, D., Deloro, Y., Velten, B., Marioni, J.C., and Stegle, O.
Journal: Genome Biology, 2020, 21, 111
Method reference for MOFA+ used in our integration pipeline. Reconstructs a low-dimensional
representation of multi-omics data using variational inference, identifying latent factors driving
coordinated variation across proteome and metabolome layers.
Web-Based Multi-Omics Integration Using the Analyst Software Suite
Ewald, J., Zhou, G., Lu, Y., Kolic, J., Ellis, C., Johnson, J.D., MacDonald, P.E., and Xia, J.
Journal: Nature Protocols, 2024, 19, 1467–1497
Protocol for web-based multi-omics integration covering transcriptomics, proteomics, and metabolomics
data. Describes step-by-step workflows for correlation analysis, pathway enrichment, and network
visualization.
Multi-Omics Approaches to Disease
Hasin, Y., Seldin, M., and Lusis, A.
Journal: Genome Biology, 2017, 18, 83
Foundational review of multi-omics integration strategies. Covers proteomics, metabolomics, and
transcriptomics integration for understanding the flow of biological information underlying disease.
Establishes the framework for enzyme pathway validation and regulatory network reconstruction.




 Contact Us



