What Saponin Quantification Answers That Total-Saponin Assays Cannot
A total-saponin value comes from reacting an extract with a colorimetric reagent and reading one
absorbance. Polyphenols, reducing sugars, and pigments react as well, so two extracts can return the same
total while containing different saponins. We quantify named saponins individually instead, each against an
authentic standard, and report per-compound concentrations rather than a single total.
Those named values are what this work is usually commissioned for: separating two cultivars, comparing a
wild accession with a cultivated one, or checking whether an engineered strain accumulated the target
compound. We scope the compound list against the project's own targets, so the comparison is made on the
saponins the study turns on rather than on a bulk response that an interfering extract can inflate.
Where the saponin fraction is one part of a wider secondary-metabolite question, plant targeted metabolomics covers the broader panel
from the same extraction, so the saponin numbers sit inside the larger metabolite picture rather than beside
it.
Triterpenoid and Steroidal Classes We Cover
We support the major triterpenoid and steroidal saponin classes, including ginsenosides, astragalosides,
soyasaponins, saikosaponins, steroidal saponins, and related sapogenins. Analytical conditions are selected
according to aglycone class, glycosylation pattern, matrix, and reference-standard availability.
Within a batch, each compound is quantified and reported on its own: a glycoside is never summed with its
aglycone, and a sugar-chain variant is never merged with its parent. Where a project needs the wider range
beyond the saponin fraction, terpenoid analysis is run on the
same extract.
Key Challenges in Saponin Analysis and How We Solve Them
- Weak UV response — Saponin aglycones carry almost no conjugated system, so UV detection
returns small peaks and no structural information, while evaporative light-scattering or charged-aerosol
detection reports a combined response without saying which compound produced it. We quantify on a triple
quadrupole against authentic standards, keep high-resolution data for identity, and report the transition
used for each compound so that every assignment can be audited.
- Structural isomers and C-20 epimers — Ginsenosides Rb2, Rb3, and Rc share one molecular
formula and differ only in where the sugars attach; Rb1, often grouped with them, is a closely related
higher-mass congener. The 20(S) and 20(R) forms of a single saponin are epimers. A method not built to
resolve them reports one peak. We develop the gradient against the isomeric set, confirm each form by its
fragment ions, and report them separately.
- Malonyl and acetyl forms that convert — Malonylated saponins hydrolyze to their neutral
parent during extraction, drying, or storage, so a rough workflow reports more neutral saponin and less
malonyl saponin than the tissue actually contained. Extraction is kept cold, strongly acidic and alkaline
conditions are avoided, extracts are injected soon after preparation, and spike recovery of the malonyl
form documents whether conversion occurred.
- Aglycone and intact glycoside collapsed into one value — Acid hydrolysis converts
saponins to their aglycones and is often used to simplify quantification, but it merges the intact
glycosides, their partially deglycosylated forms, and the free aglycone into a single number. We quantify
the intact glycosides individually and report the aglycone separately, so the state of the compound in the
sample stays visible.
- Standards that are scarce or expensive — Many saponins have no commercially available
reference material, and a full isomeric set can cost more than the analysis. For compounds without an
authentic standard we report a semi-quantitative value against a structurally related standard, state the
calibration basis in the report, and give the annotation confidence instead of presenting an estimate as
an absolute concentration.
- Matrix that suppresses ionization — Root, leaf, and seed extracts carry pigments,
sugars, and polyphenols that co-elute with saponins and suppress ionization to a different degree in every
sample. Clean-up is chosen for the matrix and applied as solid-phase extraction, defatting, and
decolorization steps, and suppression is monitored with spiked standards rather than assumed to be uniform
across the batch.
Saponins We Quantify — A Representative Panel
The panel below is the standing coverage, and compound lists are extended against the project's own target
list during scoping. Every entry is quantified against an authentic standard where one exists, and by a
stated semi-quantitative basis where none does.
| Saponin Class |
Representative Compounds |
Typical Source Material |
Measurement |
| Dammarane-type, protopanaxadiol series |
Ginsenosides Rb1, Rb2, Rb3, Rc, Rd, Rg3, Rh2,
compound K, F2 |
Panax ginseng, Panax notoginseng, American ginseng, steamed and dried root
products |
Scheduled MRM against authentic standards; high-resolution confirmation in the same batch |
| Dammarane-type, protopanaxatriol series |
Ginsenosides Rg1, Re, Rf, Rh1, Rg2, notoginsenoside R1 |
Ginseng root and rhizome, leaf and flower material, tissue and cell cultures |
Scheduled MRM; the 20(S) and 20(R) forms reported as separate values |
| Cycloartane-type |
Astragalosides I to IV, cycloastragenol |
Astragalus root and rhizome |
Scheduled MRM; glycoside and aglycone quantified separately |
| Oleanane-type |
Glycyrrhizic acid, saikosaponins a to f, escins Ia and IIa, platycodins, soyasaponins Aa, Ab, Ba, Bb, Bd, quillaja
saponins |
Licorice, Bupleurum, horse chestnut seed, Platycodon root, soybean, quinoa,
Quillaja bark |
Scheduled MRM; high-resolution accurate mass for co-eluting congeners |
| Ursane-type saponins and sapogenins |
Asiaticoside and madecassoside (glycosides); asiatic acid, madecassic acid, and corosolic acid
(free aglycones) |
Centella asiatica, Lagerstroemia leaf, Eriobotrya leaf |
Scheduled MRM; the glycoside and its aglycone are quantified as separate compounds |
| Steroidal, spirostanol and furostanol |
Dioscin, protodioscin, protoneogracillin, trillin, digitonin |
Dioscorea rhizome, Paris and Trillium material, Digitalis,
asparagus |
Scheduled MRM plus high-resolution confirmation of both forms |
| Tea and seed saponins |
Theasaponins, assamsaponins, camellia saponins |
Camellia seed cake, tea leaf, oil-tea residues |
Scheduled MRM; bitterness-relevant congeners quantified individually |
Lists are extended to any saponin for which an authentic standard or a characterized reference spectrum is
available. When a target is not on the standing panel, the transition is developed and validated before the
batch is acquired, rather than reporting a peak that has not been authenticated.
Platforms and Acquisition Modes
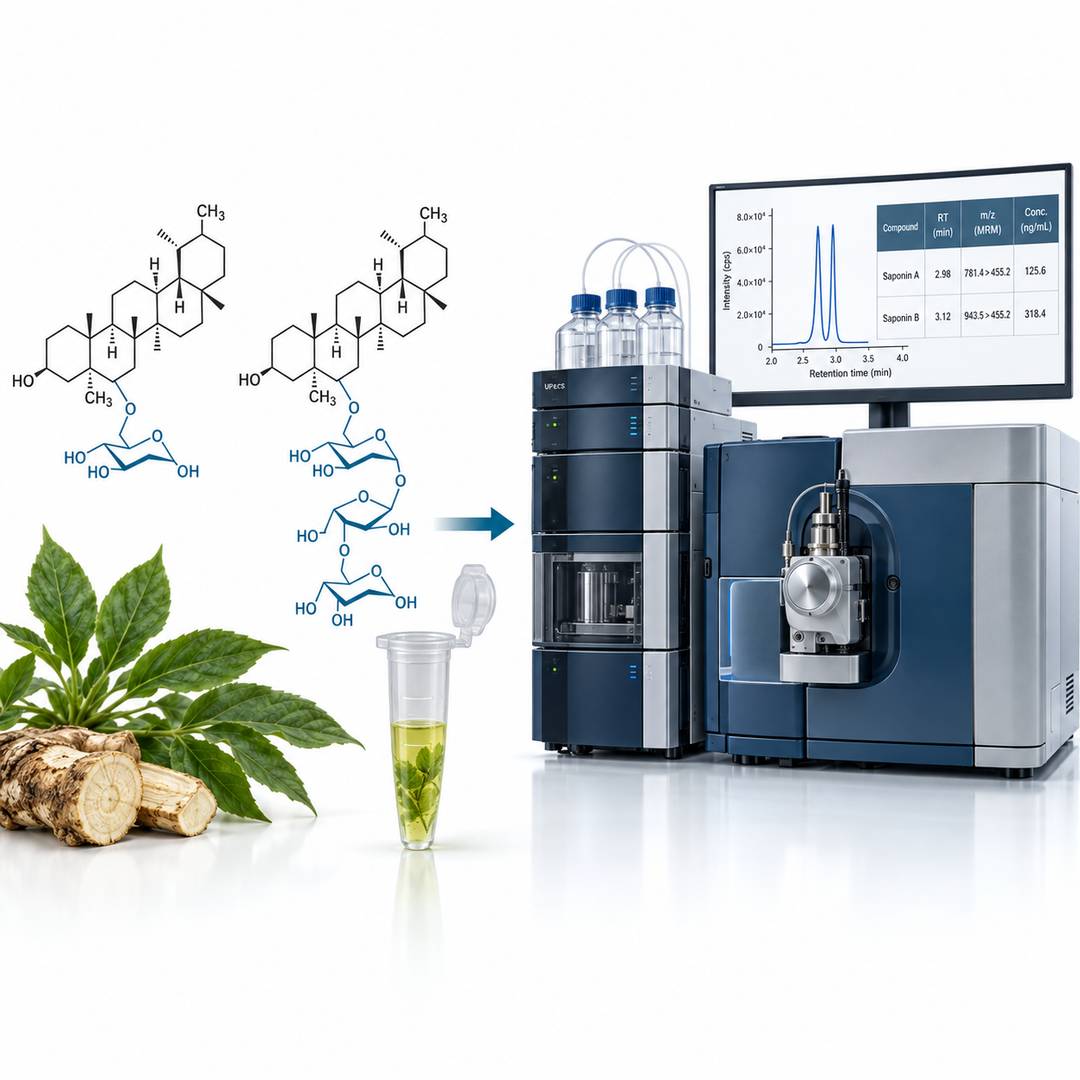
Three systems carry the work, and the choice is made per compound class rather than per project. Where
confirmation is requested, identity is checked on a second instrument from the same extract, so a
concentration and its confirmation come from two independent measurements rather than one.
Instrumentation
| Platform |
Separation and Detection |
Best Suited For |
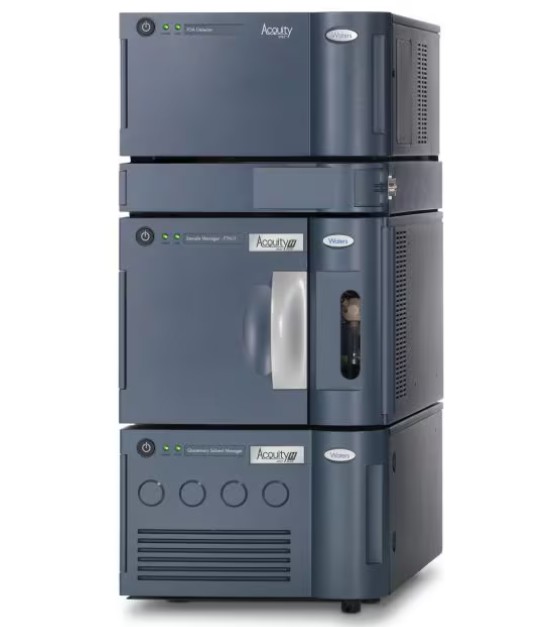
| Waters ACQUITY UPLC |
Sub-2 µm reversed-phase separation with a shallow binary gradient and controlled column
temperature |
Resolving structural isomers, sugar-chain variants, and the 20(S) and 20(R) epimer pairs |
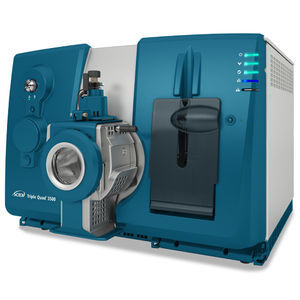
| SCIEX Triple Quad 5500 |
Scheduled multiple reaction monitoring with polarity switching in a single acquisition |
Absolute quantification of a defined saponin panel, including malonyl and acetyl forms |
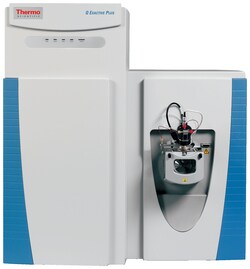
| Thermo Q Exactive Plus |
High-resolution accurate-mass acquisition with data-dependent tandem mass spectra |
Confirming an assignment, characterizing an unknown saponin, and checking co-eluting congeners
|
Quantification and Confirmation
A quantified panel is acquired as scheduled MRM against an isotope-labeled internal standard added before
extraction, so recovery and injection variability are corrected on the sample itself; a structurally related
standard is substituted only for a class where no labeled standard is commercially available, and the
substitution is named in the report. Calibration is built in the sample matrix rather than in solvent,
because pigment and sugar content alter the response; for an endogenous target where an analyte-free matrix
cannot be prepared, the curve is set by standard addition in the same tissue type.
Every reported compound is confirmed on the high-resolution system by accurate mass and fragment pattern,
and the two datasets are reported side by side.
Where a panel has to be comparable across batches and sites, targeted metabolomics workflows provide the same calibration
discipline for larger analyte lists. Where the question is instead which saponins are present at all, untargeted metabolomics acquisition in the same laboratory
produces the candidate list that a scheduled assay is later built from.
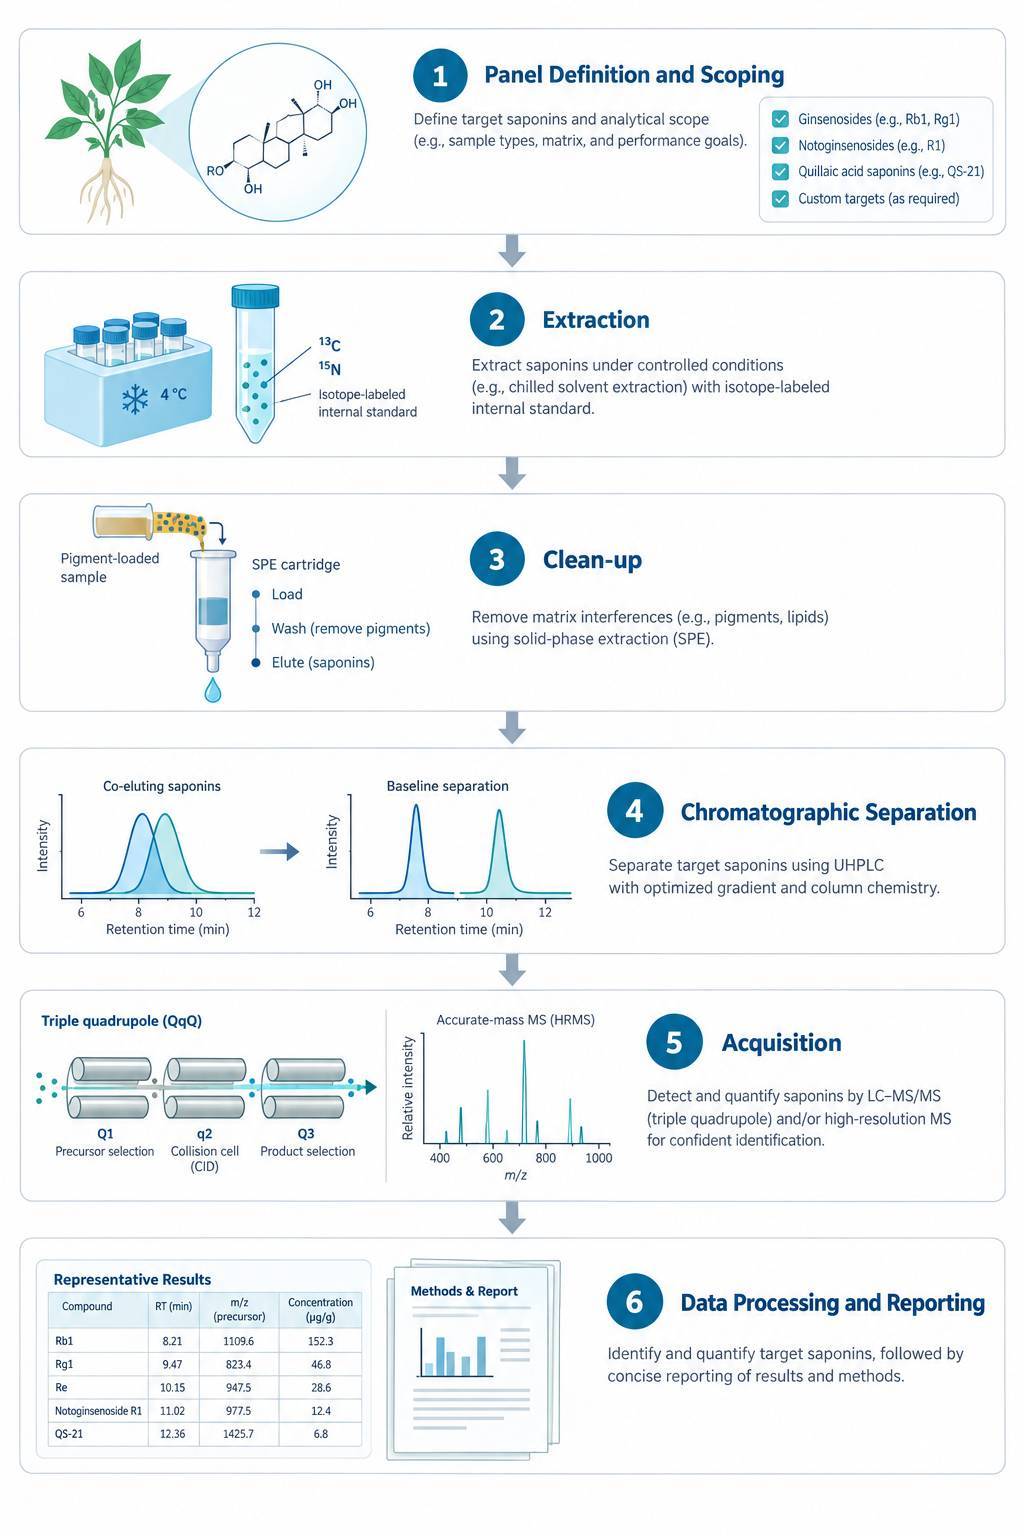
Saponin Analysis Workflow
The steps are sequenced so that the decisions constraining everything downstream — the analyte list and the
extraction chemistry — are fixed before any material is ground. Each step ends with a record that stays with
the sample through to the report.
Sample Types and Preparation Requirements
We accept dried and fresh plant material, prepared extracts, purified fractions, and culture-derived
samples. The quantities below are the general case; a smaller amount can often be assessed, because the
limiting factor is usually the analyte class and its concentration rather than the weight of material alone.
| Sample Type |
Typical Starting Material |
Preparation Notes |
Storage and Shipping |
| Leaves and aerial parts |
10 to 20 g dry weight |
Air-dried or freeze-dried, ground to a uniform powder, and kept away from heat once dried |
Sealed at room temperature with desiccant, or frozen for material with labile acylated forms |
| Roots and rhizomes |
10 to 15 g dry weight |
Washed free of soil, sliced, and dried under controlled temperature, because heat can shift the
balance between steroidal forms |
Room temperature in sealed containers; dry ice for fresh material |
| Seeds and grains |
5 to 8 g dry weight |
Ground whole, with the seed coat included, because saponin content differs between coat and kernel
|
Room temperature; defatted material should be shipped promptly |
| Fruit and whole herb |
10 to 20 g dry weight |
Recorded with the harvest stage, since saponin content changes with maturity |
Dry ice for fresh tissue, or dried and sealed |
| Herbal powder and extracts |
2 to 5 g |
State the extraction solvent and the concentration step already applied, because both alter the
acylated fraction |
Sealed, protected from light and moisture |
| Purified fractions |
10 to 50 mg |
State the approximate purity and the isolation solvent so that the calibration range can be set
|
Sealed under inert gas where the compound is known to be unstable |
| Cell and tissue cultures, fermentation broth |
State volume and cell density |
Separate cells from medium where the compound is retained intracellularly, and send both fractions
|
Dry ice; quench rapidly where acylated forms matter |
- Send fresh material at least five times the listed dry weight — the drying step removes
most of the water, and a fresh sample that looks generous can yield less than half the required dry
equivalent after freeze-drying
- Check the solvent before you ship an extract — acid, alkali, heat, and long storage in
solution drive malonyl and acetyl forms toward their neutral parents; a neutral aqueous extract kept cold
and injected soon after preparation is usually workable. Tell us the solvent, pH, and storage history at
scoping so the handling suits the class being measured
- Record provenance and processing for every sample — origin, cultivation or wild
collection, harvest date, and any drying or steaming step, because these are the variables that most often
explain a compositional difference
- Include the sample metadata sheet — species and cultivar, tissue, treatment arm, and
the comparison the data is meant to support, so that reporting can be organized around it
- Ship on dry ice when acylated or furostanol forms are of interest — repeated
temperature cycling changes exactly the compounds this type of analysis is meant to distinguish
Quality Control That Makes the Numbers Reportable
Each batch is run with a consistent control set, and the control results are reported together with the
concentrations rather than held internally, so the batch performance behind each number stays visible in the
report.
- Isotope-labeled internal standards — added before extraction wherever a labeled
standard exists for the class, so that recovery and injection variability are corrected on the sample
rather than assumed from a reference; classes without one are corrected against a structurally related
standard
- Calibration in the sample matrix — curves built at five to seven levels in a
representative plant matrix, and by standard addition where the target is endogenous and an analyte-free
matrix cannot be prepared, with the coefficient of determination and the weighting applied stated in the
report
- Pooled quality control samples — injected at intervals across the batch so that
instrument drift can be separated from a real difference between samples
- Spike recovery for labile forms — the malonyl or acetyl target spiked into one sample
per batch, which is the evidence that the extraction did not convert it to the neutral parent
- Extraction and solvent blanks — bounding the background contributed by reagents,
consumables, and the clean-up step, which matters most at low concentrations
- Replicate injections — giving the technical spread of the measurement next to the
biological spread between samples, so that a difference smaller than the method can produce is not
reported as a finding
For projects that already hold a saponin dataset and need it interpreted rather than re-measured, metabolomics data analysis can be carried out on the submitted
content table, including normalization, multivariate comparison, and the statistics that go with it.
Deliverables — What You Receive
- Per-compound content table — Every measured saponin with
its concentration, the internal standard used, the transition or accurate mass measured, and the
annotation confidence level, delivered in Excel and CSV.
- Extract chromatograms — The MRM traces for each target from
representative samples, with the integration boundaries marked so that a peak can be checked against the
reported number.
- High-resolution confirmation data — Accurate mass and
fragment spectra for the compounds whose identity requires confirmation, with the comparison against the
standard or reference spectrum that supported the assignment.
- Calibration and quality control report — Calibration curves
with their acceptance parameters, internal standard response per sample, pooled quality control
dispersion, blank levels, and spike recovery for labile forms.
- Sample level comparison — Grouped comparison across the
samples submitted, with the statistical test applied, the correction used, and the fold change for each
compound that passed the criteria.
- Compound class summary — Coverage organized by saponin
class and by sample, which is the view needed when a project has to state how the saponin composition
differs rather than list individual concentrations.
- Methods documentation — Extraction and clean-up procedure,
chromatographic conditions, instrument settings, standards and their sources, and the normalization or
calculation actually applied, written so that the analysis subsection can be assembled from it.
Representative Data
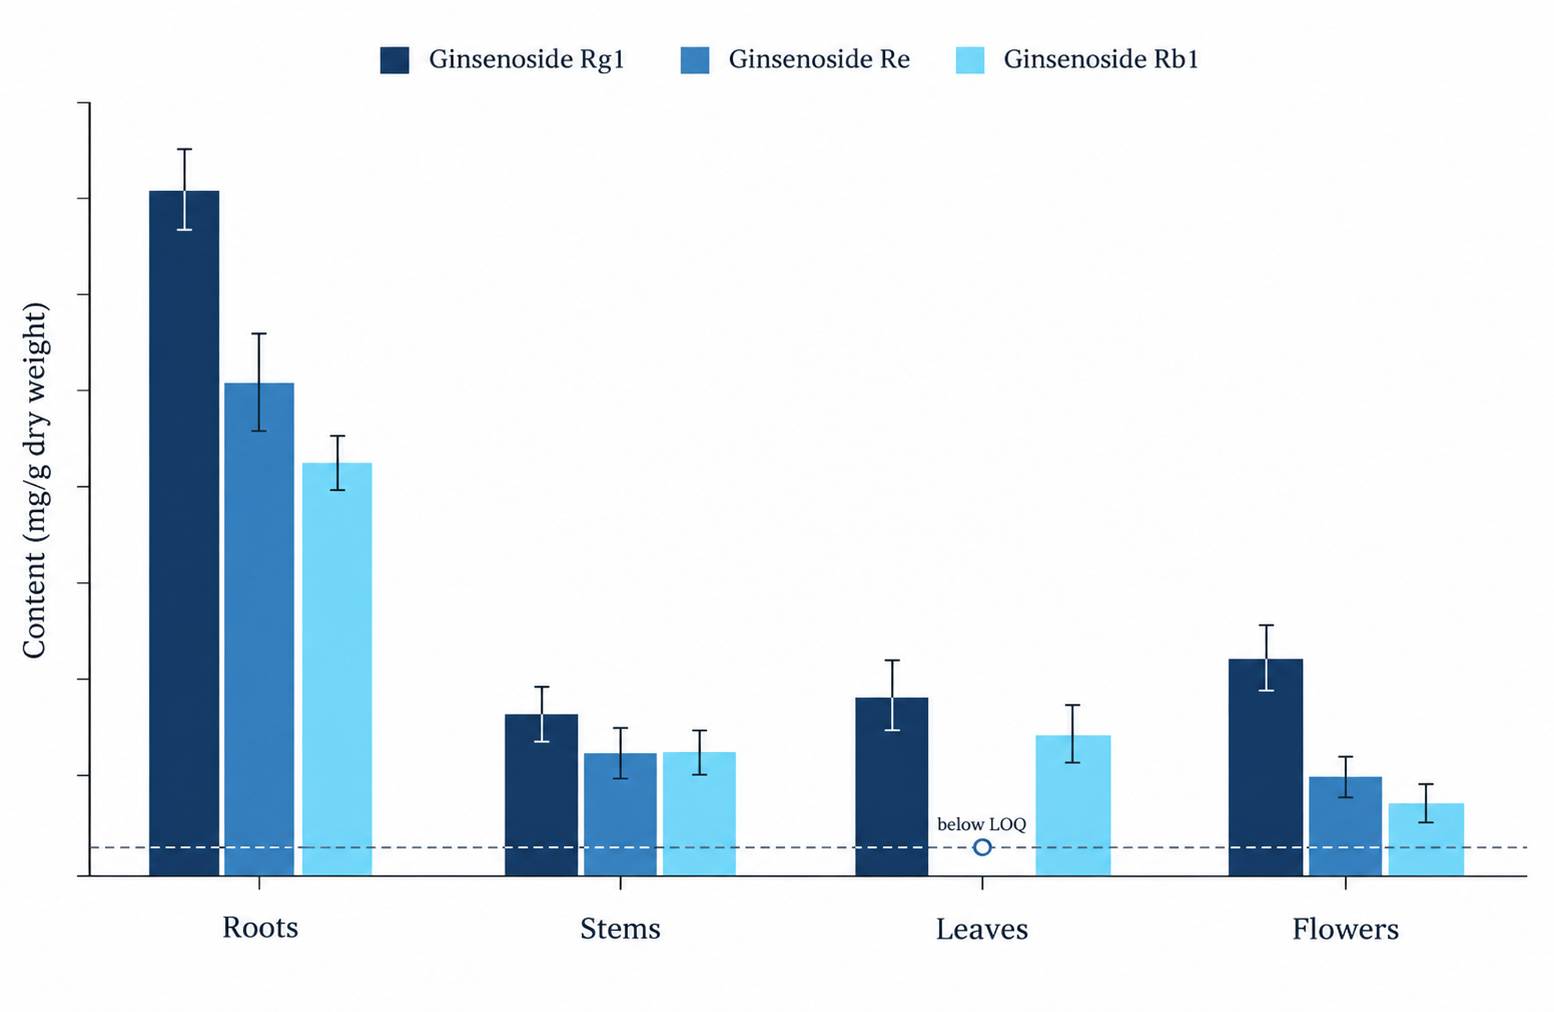
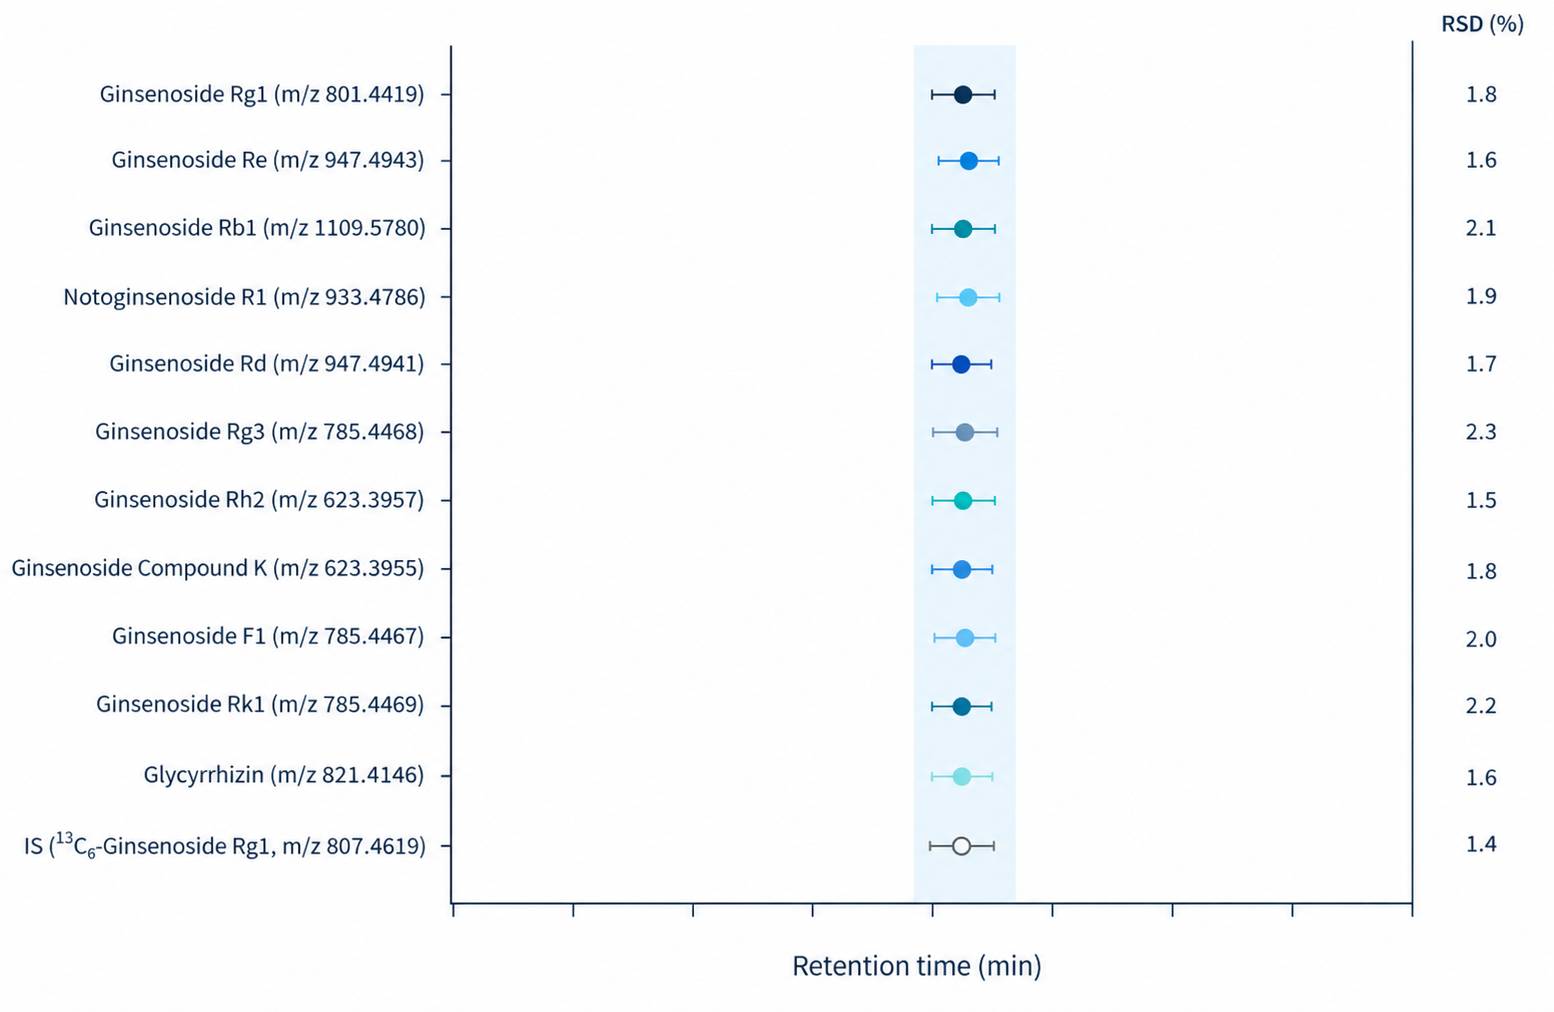
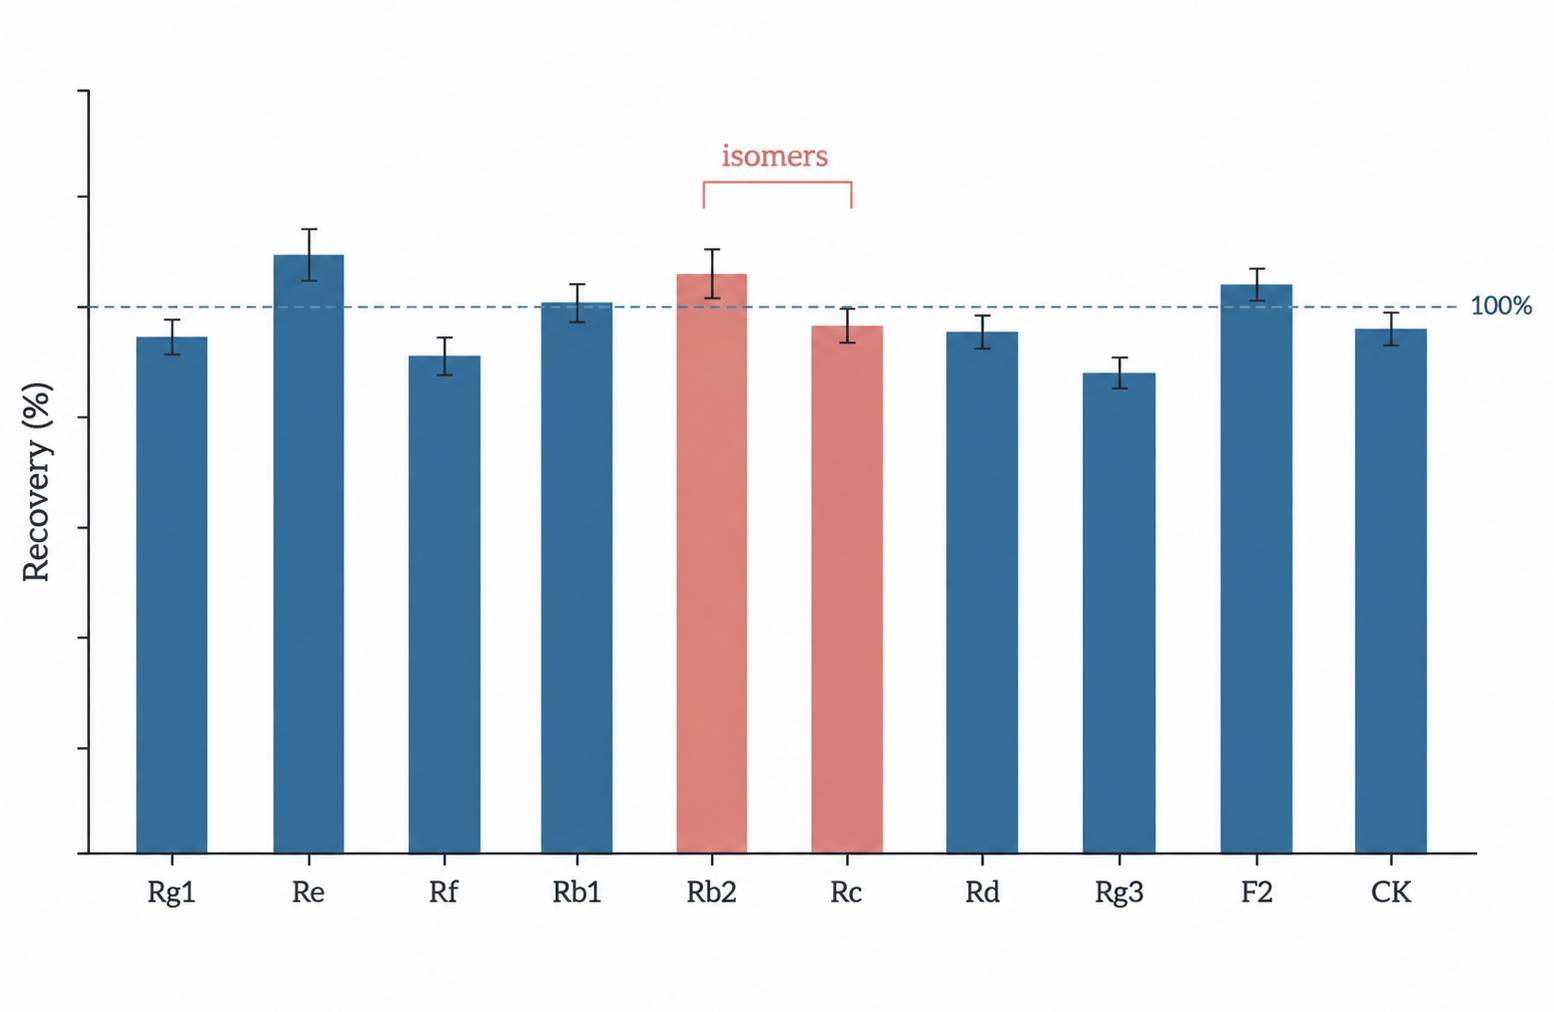
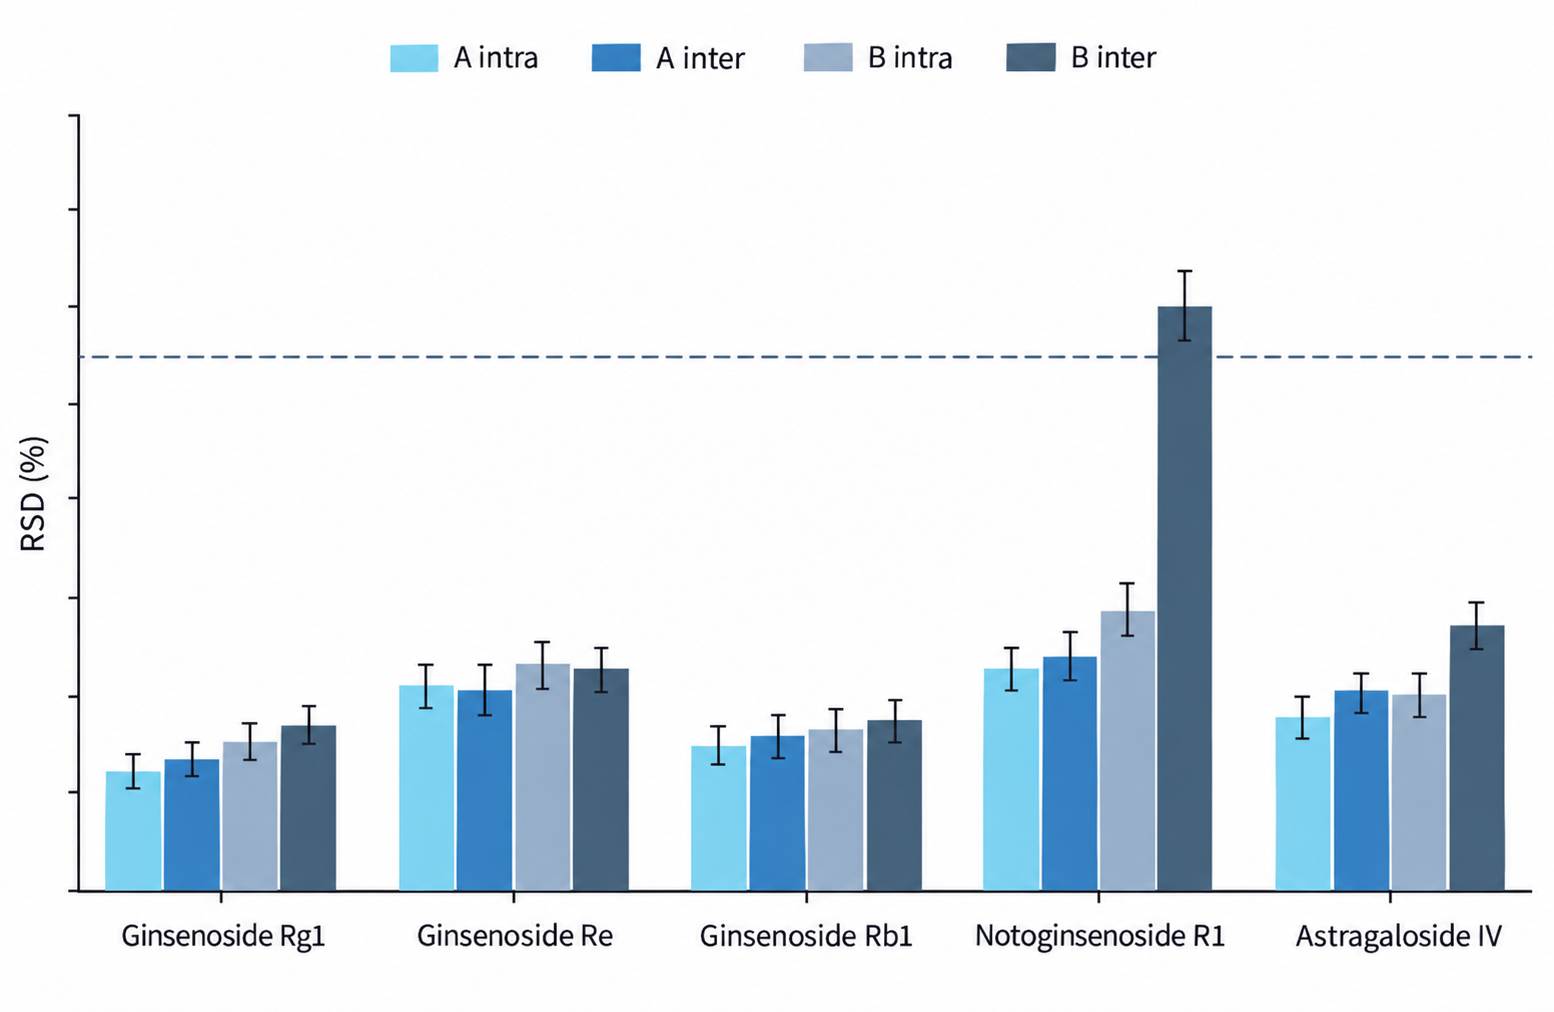
The four panels below show the four views a saponin LC-MS/MS project report is built around: per-compound
content, retention-time control across a crowded elution window, spike recovery, and precision across a
batch. Project reports carry the same views built from your own samples, together with the underlying peak
and concentration tables.
Applications of Saponin Analysis
Projects that need the wider metabolite context around the saponin numbers can pair this work with the rest
of the metabolomics services portfolio, acquired from the same
extract where the analyte classes allow it.
Selected Publications in Saponin Analysis
Differentiation and identification of ginsenoside structural isomers by two-dimensional mass spectrometry combined with statistical analysis
Xiu, Y., Ma, L., Zhao, H., Sun, X., Li, X., Liu, S.
Journal: Journal of Ginseng Research 43, 368–376
Year: 2019
DOI: 10.1016/j.jgr.2017.11.002
Identification and analysis of BAHD superfamily related to malonyl ginsenoside biosynthesis in Panax ginseng
Wang, P., Yan, Y., Yan, M., Piao, X., Wang, Y., Lei, X., Yang, H., Zhang, N., Li, W., Di, P., Yang, L.
Journal: Frontiers in Plant Science 14
Year: 2023
DOI: 10.3389/fpls.2023.1301084
Steroidal saponin profiles and their key genes for synthesis and regulation in Asparagus officinalis L. by joint analysis of metabolomics and transcriptomics
Cheng, Q., Zeng, L., Wen, H., Brown, S.E., Wu, H., Li, X., Lin, C., Liu, Z., Mao, Z.
Journal: BMC Plant Biology 23
Year: 2023
DOI: 10.1186/s12870-023-04222-x


 Contact Us


