What Metabolic Pathway Analysis Adds to Your Metabolomics Data
Statistical testing tells you which metabolites differ between your groups. It does not tell you whether
those differences form a coordinated shift inside one pathway, whether the shift runs in a consistent
direction, or whether the pathway was measured completely enough in your data to support any conclusion at
all. Pathway analysis answers those questions by scoring changed metabolites against curated pathway maps
and against a background set that reflects what your platform could actually detect.
We annotate every differential metabolite to database identifiers, test each pathway for
over-representation against a species-matched background, and report which metabolites carried the
enrichment and which direction each of them moved. Pathways that are statistically significant but
internally contradictory are flagged rather than promoted, because a pathway holding both strongly increased
and strongly decreased metabolites rarely supports a single directional claim.
The output is written for the sections of a manuscript that are hardest to fill: the mechanistic paragraph
of a discussion, and the analysis subsection of a methods section. Where the same pathway readout has to
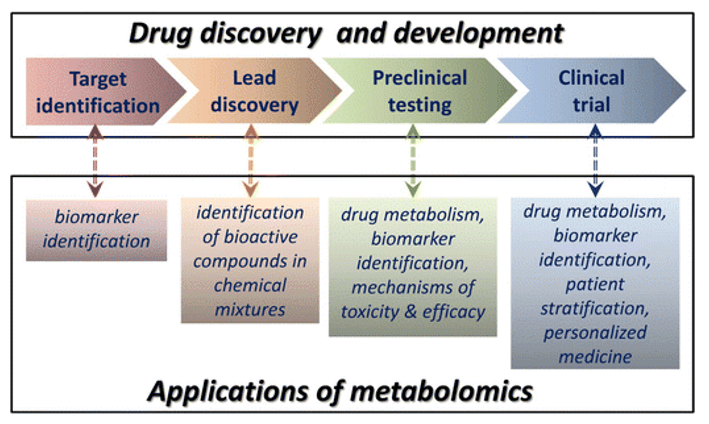
support a pharmacological argument, the interpretation connects to the wider metabolomics in drug development
workflow, which follows pathway findings from target identification through mechanism confirmation.
Service Modules — Pathway Profiling, Flux & Mapping
Pathway questions arrive in different states. Some studies have samples and no data; some have a feature
table and no annotation; some have annotation and no defensible interpretation. The service is organized so
that you can enter at whichever stage matches your project.
Metabolite Profiling and Annotation
Untargeted LC-MS/MS and GC-MS acquisition with MS/MS-based annotation against spectral and compound
libraries, followed by identifier mapping to KEGG, Reactome, HMDB, and PubChem. Annotation confidence is
reported per metabolite — level assigned from an authentic standard, from library-matched fragmentation, or
from accurate mass and class-level evidence — so that weak annotations do not silently carry the same weight
as confirmed identifications.
Enzyme and Cofactor Activity Readouts
Pathway activity is usually inferred from metabolite pools rather than measured enzyme kinetics. We
quantify the substrate, product, and cofactor pairs that make that inference testable — substrate-to-product
ratios, reduced-to-oxidized cofactor ratios, and pathway intermediate distributions — and state explicitly
which steps of the pathway the data constrains and which remain undetermined.
Flux and Isotope Tracing
Labeled precursor experiments with ¹³C, ¹⁵N, or deuterium distinguish a pathway whose throughput changed
from a pathway whose pool size changed for another reason. Isotopologue distributions and label
incorporation are reported per metabolite, which is what separates a genuine flux shift from a concentration
shift caused by supply, export, or dilution.
Pathway Mapping and Interpretation
Changed metabolites are mapped onto pathway diagrams, scored for enrichment and topological impact, and
organized into the routes that share intermediates. The written interpretation reports what the mapping
supports, what it does not, and which conclusions would require an additional experiment.
| Service Module |
Question It Answers |
Typical Readout |
| Metabolite profiling |
Which metabolites changed, and how confidently are they identified |
Annotated feature table with fold change, significance, and per-metabolite annotation confidence
level |
| Activity readouts |
Is a pathway step constrained by substrate and cofactor availability |
Substrate-to-product ratios and reduced-to-oxidized cofactor ratios per sample |
| Flux tracing |
Did the throughput of the pathway change, or only its pool size |
Isotopologue distributions and label incorporation per metabolite per time point |
| Pathway mapping |
Which routes are affected, and how do they connect |
Enrichment table, pathway maps with direction-coded nodes, and cross-pathway shared metabolite
list |
Key Challenges in Pathway Interpretation and How We Solve Them
- Background set that does not match the sample — Enrichment carries meaning only
relative to what the platform could have detected, yet a default human metabolite background is routinely
applied to plant, microbial, and non-model samples. That inflates the hit count and returns pathways that
look significant for purely technical reasons. We build the background from your species annotation, the
coverage of your analytical platform, and your own detected feature list, and we state which background
was used and how large it was.
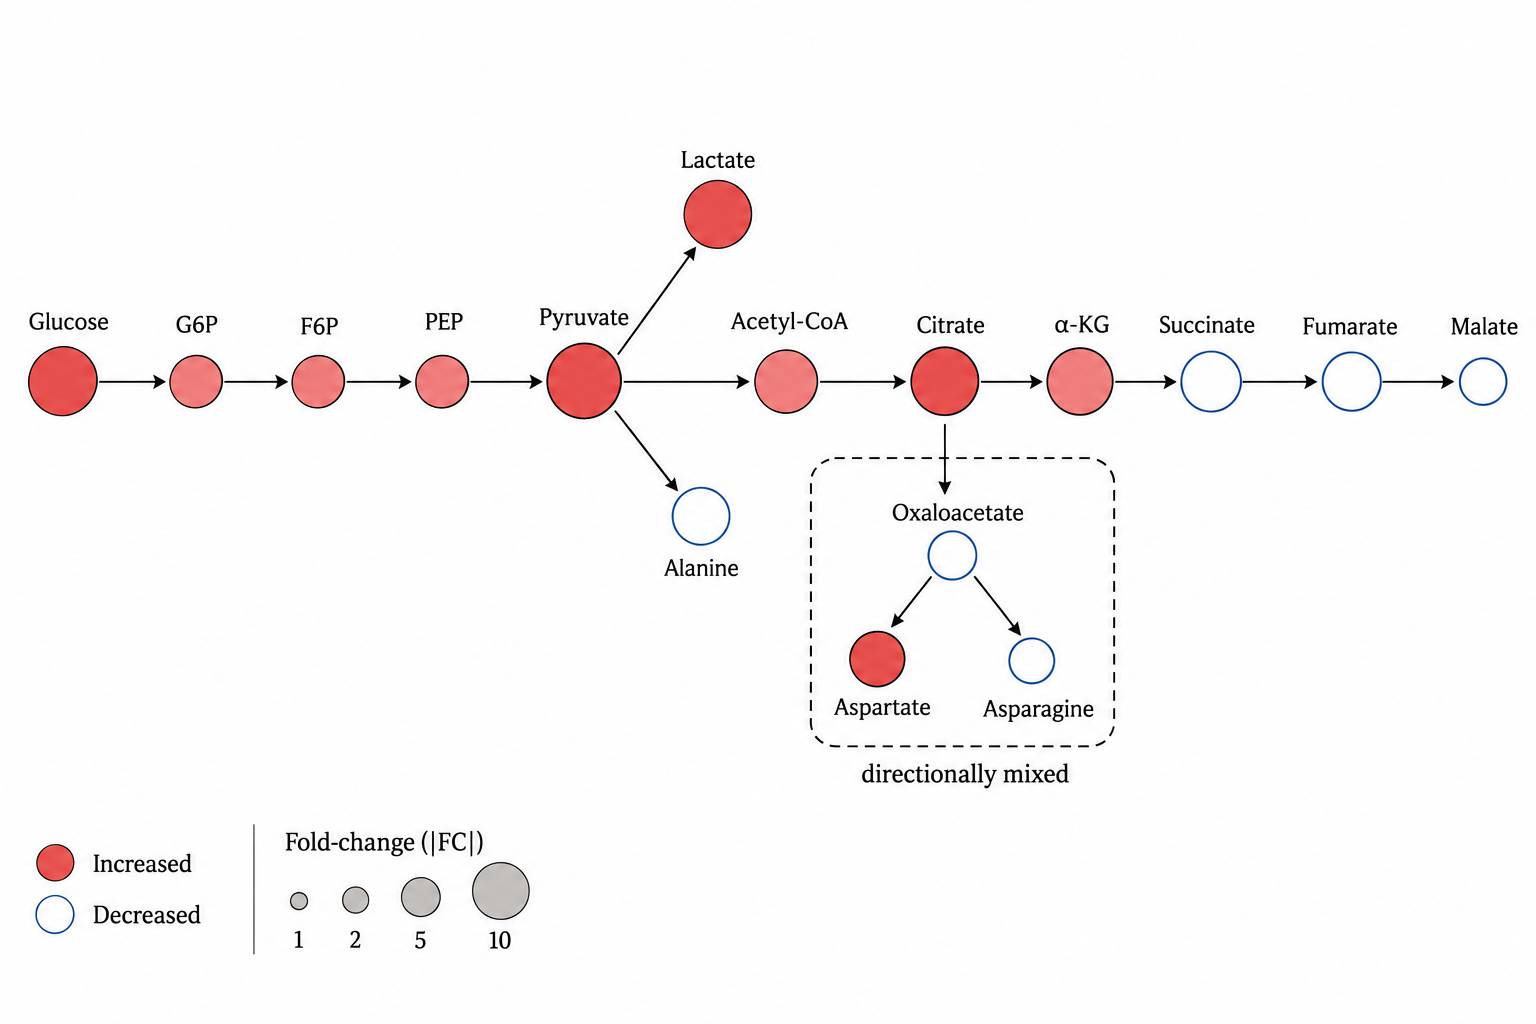
- Enrichment that is statistically significant but directionally mixed — A pathway can
return a small adjusted p-value while containing both strongly increased and strongly decreased
metabolites, and labeling the whole route up- or down-regulated misstates the data. We list the direction
of every contributing metabolite and, where a pathway is internally split, report it as a coordinated but
directionally mixed response, together with which explanation the metabolite pattern supports.
- Annotation coverage that limits what can be claimed — A pathway can appear unenriched
because most of its metabolites were never confidently annotated rather than because it was unaffected,
and the two outcomes look identical in an enrichment table. We report the detected and annotated fraction
per pathway next to the enrichment result, so a below-threshold route can be distinguished from one that
was simply not measured.
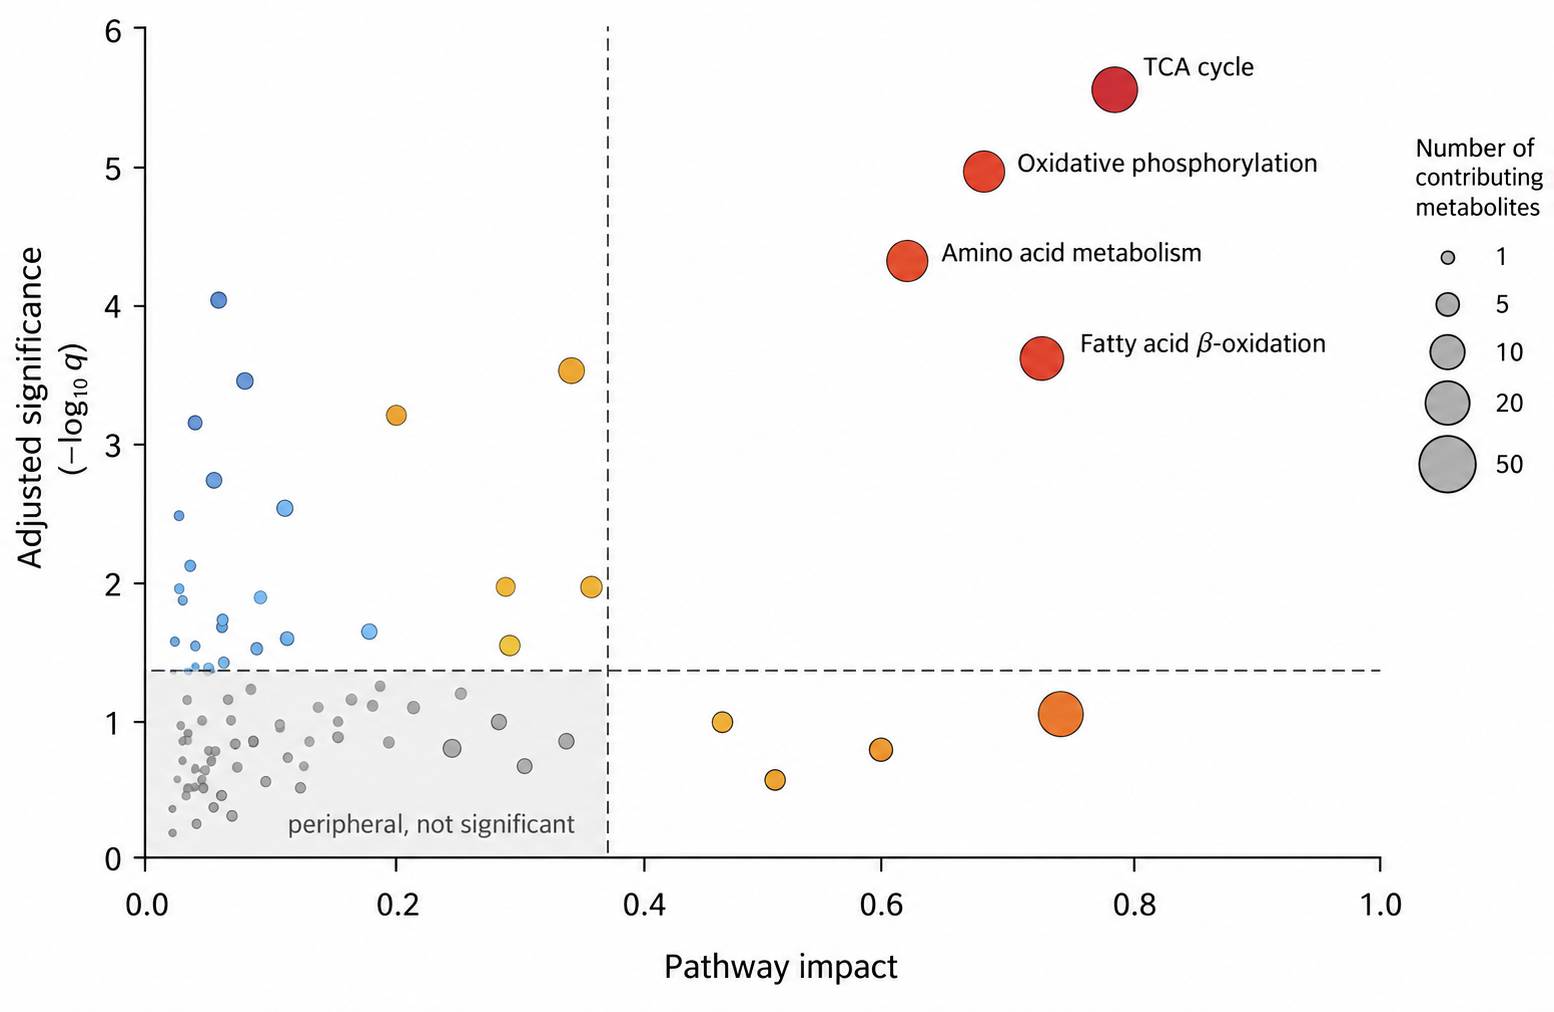
- Significance ranking that ignores pathway structure — Ordering pathways by adjusted
p-value treats each one as an independent list and favors large pathways simply because they contain more
metabolites. We add topological impact scoring, which weights metabolites by their position and
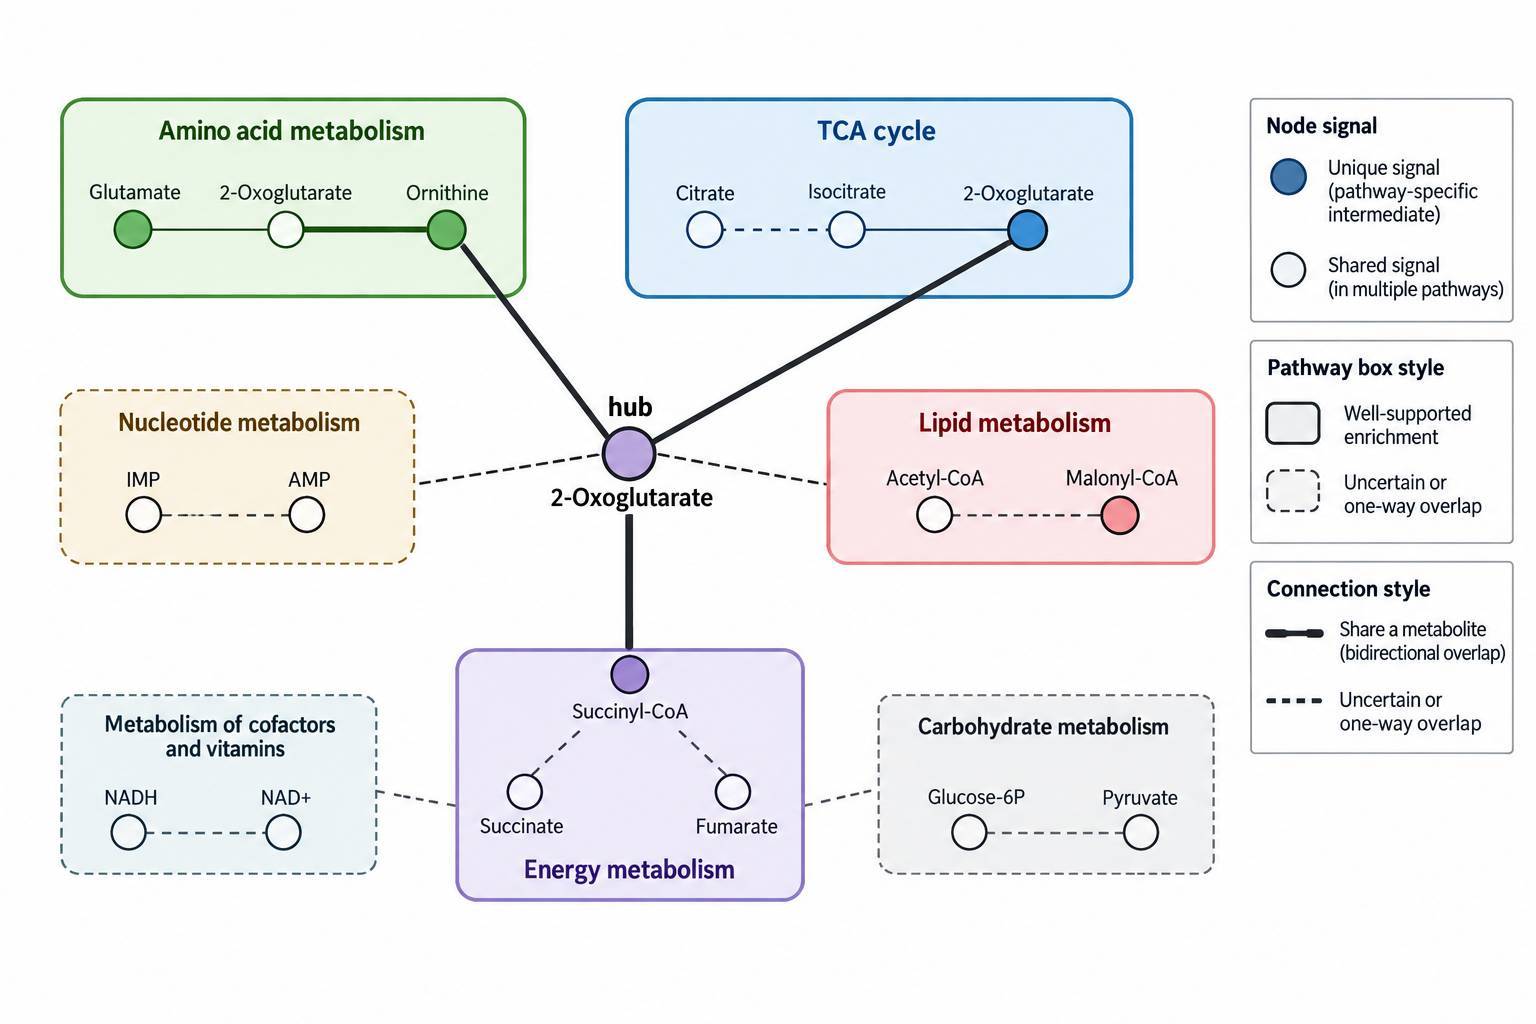
connectivity in the pathway graph, and we identify metabolites shared across co-enriched routes, which is
usually how the driving pathway is separated from a downstream one.
- Results that cannot be reproduced or written into a methods section — An enrichment
figure delivered without its parameters cannot be reproduced, and reviewers ask for the test, the
background, the correction method, and the software version. We record every parameter of the analysis and
hand back a written methods description, so the analysis subsection can be assembled from the report
instead of reconstructed from memory.
Pathway Enrichment and Mapping Methods
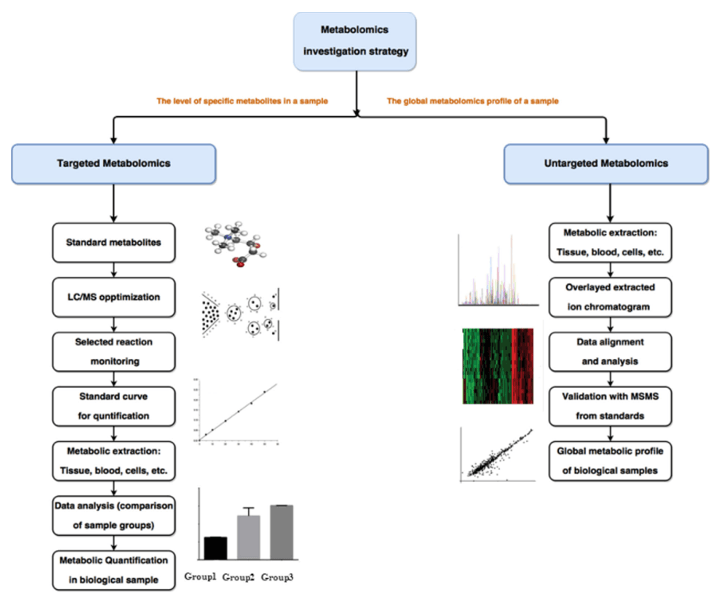
Method choice depends on whether you have a short list of confirmed metabolites, quantitative values for
the whole feature table, or only mass spectral features with no confident identity. Each of those situations
supports a different statistical approach, and using the wrong one is a common source of results that cannot
be reproduced.
| Method |
How It Works |
When It Applies |
| Over-representation (ORA) |
Hypergeometric test comparing the number of changed metabolites in a pathway with the number
expected from the background set, corrected for multiple testing |
A defined list of significantly changed, confidently annotated metabolites |
| Metabolite set enrichment (MSEA) |
Uses quantitative values from all detected metabolites rather than a significance cutoff, so weak
but coordinated shifts remain visible |
Datasets where many metabolites move slightly in the same direction and none survives a strict
cutoff |
| Topology analysis |
Weights each metabolite by its position and connectivity in the pathway graph, producing an impact
score that is not driven by pathway size alone |
Distinguishing a central pathway from a peripheral one when raw hit counts are similar |
| Peak-based functional analysis |
Tests enrichment directly on mass spectral features with their probable annotations, aggregating
over multiple candidate identities |
Untargeted data where annotation is incomplete and discarding unannotated features would lose the
signal |
| Cross-pathway integration |
Identifies metabolites shared between enriched routes and ranks pathways by how much of their
signal is unique to them |
Studies where several related pathways are enriched and the driving route has to be identified
|
Databases are reported by name, release, and version: KEGG for pathway maps and reaction topology, Reactome
for curated reaction networks and cross-species projection, and SMPDB for small-molecule pathway coverage,
with HMDB used for metabolite identifier normalization. Multiple-testing correction is applied with the
method stated — Benjamini-Hochberg by default for pathway-level tests — and the adjusted threshold is
reported rather than left implicit.
Analytical Platform for Pathway-Level Metabolomics
Instrumentation
Untargeted profiling runs on a Thermo Scientific Q Exactive Plus Orbitrap with
data-dependent and data-independent acquisition for broad pathway coverage. Targeted quantification of
pathway intermediates runs on a SCIEX Triple Quad 5500 triple quadrupole using
scheduled MRM with isotope-labeled internal standards. Volatile and thermally stable pathway metabolites
are acquired on an Agilent 7890B-5977A gas chromatography–mass spectrometry system, and
chromatographic separation is developed on Waters ACQUITY UPLC H-Class systems.
Analysis can also start from data you already have. Where a study arrives with a processed feature
table or an annotated metabolite list, the same enrichment and mapping pipeline runs on that input,
provided the species and platform metadata needed to construct a matching background set are available.
What Makes a Pathway Call Defensible
| Parameter |
How It Is Handled |
| Background set |
Built from species annotation, platform coverage, and your detected feature list; the
composition is reported |
| Annotation level |
Reported per metabolite, from authentic standard through library match to class-level
assignment |
| Direction |
Recorded for every contributing metabolite within each reported pathway |
| Coverage |
Detected and annotated fraction reported per pathway alongside the enrichment result |
| Multiple testing |
Benjamini-Hochberg applied at the pathway level by default; the applied threshold is stated
|
| Topological impact |
Reported for each enriched pathway; raw hit count and impact score are given separately |
| Reproducibility |
Database release, software version, and every threshold recorded in the report |
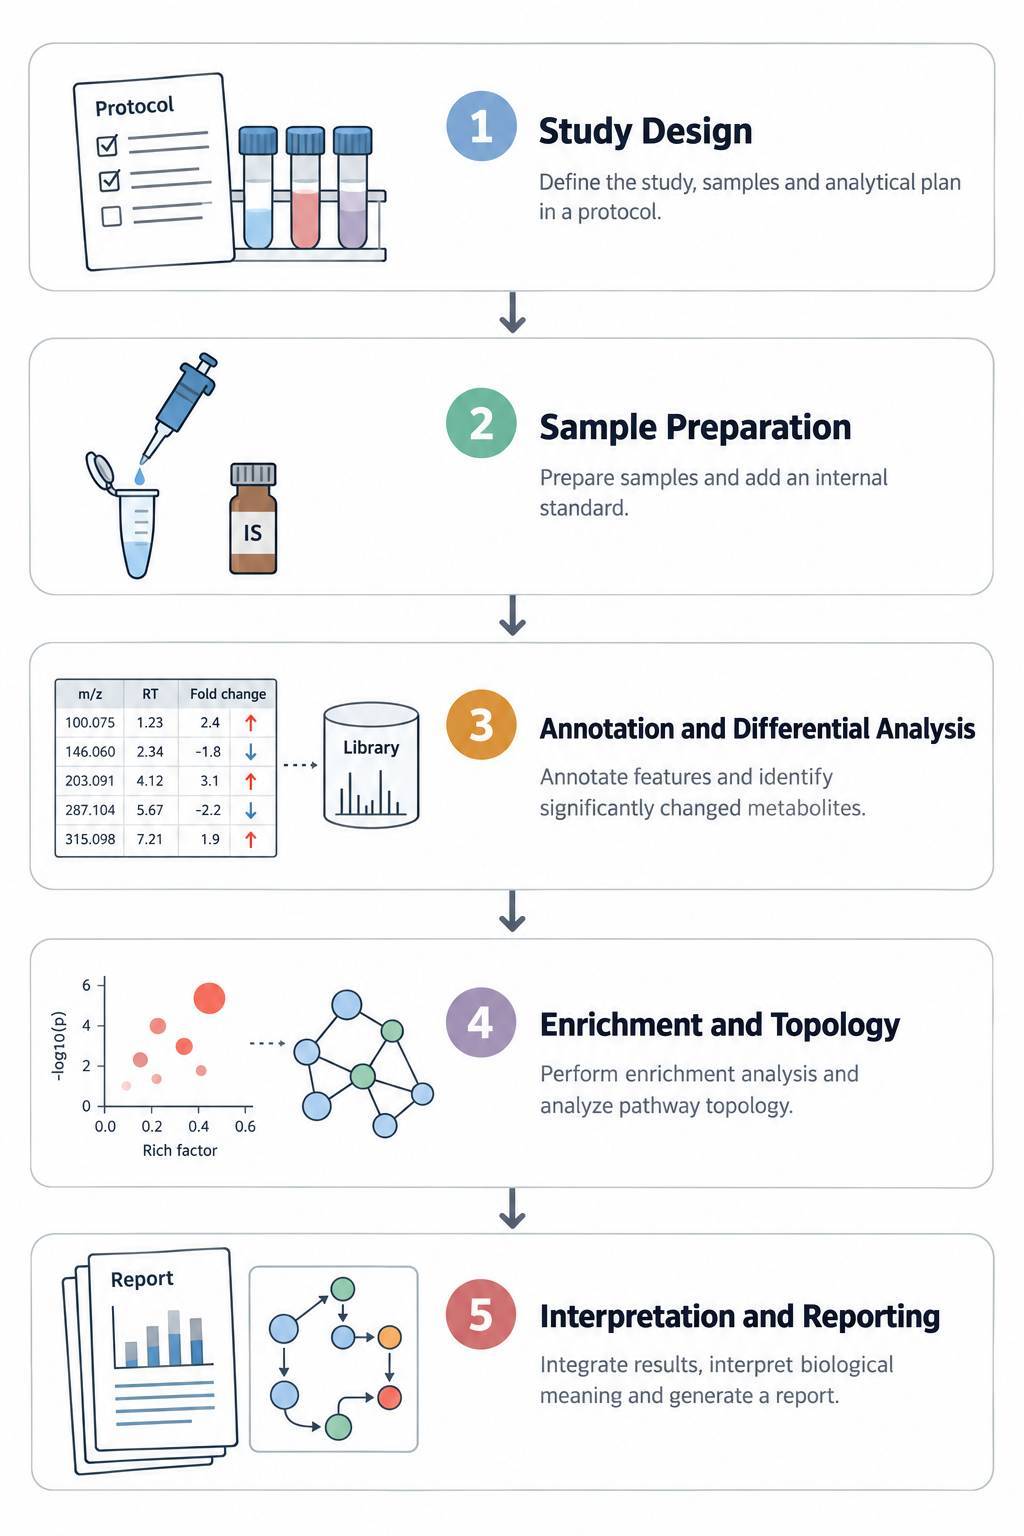
Metabolic Pathway Analysis Workflow
Metabolic Pathways We Analyze
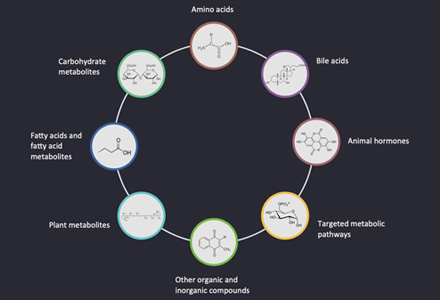
Coverage is organized by pathway class rather than by individual compound, because the class determines
what the enrichment result can support. For each class we report the metabolites detected, their annotation
level, and the direction of change within the pathway.
| Pathway Class |
Representative Routes |
Typical Samples |
| Arachidonic Acid
Metabolism |
Eicosanoid and oxylipin routes; prostaglandin, leukotriene, and hydroxyeicosatetraenoic acid
branches |
Plasma, tissue, cell pellets, culture medium |
| Beta-Alanine Metabolism
|
Carnosine synthesis and beta-alanine to acetate conversion; links to pantothenate and coenzyme A
supply |
Skeletal muscle, plasma, tissue |
| Bile Acid Metabolism |
Primary and secondary bile acid synthesis, conjugation, and microbial transformation routes |
Serum, bile, feces, liver tissue |
| Fatty Acid Metabolism |
Elongation, desaturation, and oxidation routes reported at chain-length and saturation level |
Serum, adipose tissue, liver, cell pellets |
| Ketone Body Metabolism |
Ketogenesis from acetyl-CoA and ketolysis back to acetyl-CoA; between-organ exchange |
Plasma, liver, heart and skeletal muscle |
| Nicotinate and
Nicotinamide Metabolism |
NAD⁺ salvage and de novo routes, including the nicotinamide and nicotinic acid arms |
Blood, tissue, cell pellets |
| One-Carbon Metabolism |
Folate-mediated one-carbon transfer, methionine cycle, and transsulfuration routes including
glutathione precursors |
Plasma, serum, tissue, cell pellets |
| Oxidative
Phosphorylation Metabolism |
Electron transport chain-associated cofactors, nucleotide ratios, and redox couples |
Cells, mitochondria-enriched fractions, tissue |
| Pyrimidine Metabolism |
De novo synthesis, salvage, and catabolism of pyrimidine nucleotides; links to one-carbon supply
|
Cells, tissue, plasma |
| Purine Metabolism |
De novo and salvage purine routes, nucleotide degradation, and uric acid endpoints |
Cells, tissue, plasma, urine |
| Sphingolipid Metabolism
|
Ceramide, sphingomyelin, and sphingosine-1-phosphate routes reported at species level |
Serum, plasma, tissue, cell pellets |
| Tyrosine Metabolism |
Catecholamine synthesis, tyramine and dopamine routes, and tyrosine catabolism to fumarate and
acetoacetate |
Plasma, urine, brain tissue, cell pellets |
Routes most often requested as a defined panel are listed below. Each can be delivered as a targeted
quantification panel, as part of an untargeted dataset interpreted at pathway level, or as a
reinterpretation of data you already hold.
If the route you need is not listed, tell us the pathway name and the species. Coverage is checked against
the databases before the analysis plan is fixed, so we will confirm whether the route can be resolved at
pathway level from your sample type rather than assuming it can.
Sample Requirements & Data You Can Send Us
The analysis can start from samples or from data. Requirements differ slightly between the two, and both
are listed here so that a project can be planned before anything is shipped.
| Sample Type |
Amount Required |
Preparation Instructions |
Storage and Shipping |
| Plasma / Serum |
≥ 50 µL |
Collect in EDTA or heparin tube, centrifuge, aliquot supernatant, avoid hemolysis |
Store at −80°C; ship on dry ice |
| Urine |
≥ 50 µL |
Centrifuge to remove debris, record the collection interval, aliquot |
Store at −80°C; ship on dry ice |
| Tissue |
10–50 mg |
Snap freeze in liquid nitrogen immediately after collection; record wet weight before freezing
where possible |
Store at −80°C; ship on dry ice |
| Cell Pellets |
≥ 1 × 10⁶ cells |
Wash with cold PBS, centrifuge, remove supernatant, freeze the pellet; record cell count per
sample |
Store at −80°C; ship on dry ice |
| Cell Culture Medium |
≥ 100 µL |
Centrifuge, collect supernatant, record time from treatment or dosing to collection |
Store at −80°C; ship on dry ice |
| Feces |
≥ 20 mg |
Aliquot promptly, avoid repeated thawing; relevant where microbial transformation contributes to
the pathway |
Store at −80°C; ship on dry ice |
| Plant Tissue |
50–100 mg |
Freeze in liquid nitrogen, grind to powder, record tissue type and developmental stage |
Store at −80°C; ship on dry ice |
| Microbial Culture |
≥ 1 × 10⁷ cells or 200 µL spent medium |
Quench metabolism immediately, separate cells from medium, record growth phase and OD |
Store at −80°C; ship on dry ice |
| Processed data you already hold |
Feature table or annotated metabolite list |
Submit the abundance matrix with sample metadata, plus species, platform, and acquisition method
|
Secure transfer; metadata must accompany the data matrix |
Notes
- Submit all groups belonging to one comparison together so they can be extracted and acquired in a single
batch
- Include the sample metadata sheet: sample identifier, group, time point, batch, and any covariate
recorded at collection
- For non-model species, state the closest annotated genome or the taxonomy identifier so the background
set can be constructed correctly
- Avoid repeated freeze–thaw cycles; split samples into single-use aliquots before the first freeze
- If you are sending processed data, also send the raw feature list where available — peak-based
functional analysis can recover signal from features that were never confidently annotated
Metabolic Pathway Analysis Deliverables — What You Receive
- Annotated differential metabolite table — Every changed
metabolite with fold change, direction, statistical significance, and its annotation confidence level,
delivered in Excel and CSV with the identifier mapping used.
- Pathway enrichment results — Enriched pathways with raw and
adjusted significance, hit metabolite counts, expected counts from the background set, and the identity of
every contributing metabolite.
- Pathway maps with direction coding — Pathway diagrams with
nodes coded by the direction of change, and internally inconsistent pathways marked rather than smoothed
over.
- Topology and coverage report — Topological impact per
enriched pathway, plus detected and annotated coverage so that unenriched pathways can be separated from
unmeasured ones.
- Cross-pathway integration — Metabolites shared between
co-enriched routes, ranked so the driving pathway can be distinguished from downstream ones.
- Written interpretation — A short narrative on what the
enrichment supports, which conclusions stay open, and which additional experiment would close them.
- Methods documentation — Database names and releases,
statistical tests, multiple-testing correction, thresholds, and software versions, written so the analysis
subsection can be assembled from the report.
Representative Data
Applications of Metabolic Pathway Analysis
Untargeted Metabolomics and Pathway Enrichment
in a Pan-Stress Model
Background
Cellular responses to chronic stress have to be switched off again, and the machinery that resolves a
stress response is less well characterized than the machinery that starts one. In
Caenorhabditis elegans, loss of the caspase ced-3 leaves stress reporters chronically
elevated, which raised the question of what caspase activity does to metabolism in the absence of any
applied stress — and whether a metabolic signature could be detected before the stress response became
visible.
Answering that question required untargeted metabolomics across several genetic backgrounds and several
stress conditions, followed by pathway-level interpretation that could distinguish a coordinated adaptive
shift from a scattered set of changes. The study also needed the analysis to survive a direct comparison
between two mutants, so that a shared route could be separated from a background-specific one.
Findings (from the published study)
- Untargeted metabolomics was performed at Creative Proteomics and compared the caspase null mutant
ced-3(-) and the cleavage-resistant fasn-1(D/E) mutant against wild type at a P <
0.05 cutoff, with n = 6 biological replicates per group.
- 296 metabolites were significantly altered in ced-3(-) and 242 in fasn-1(D/E) relative
to wild type in the absence of stress; 193 metabolites were altered in both, and 191 of those 193 changed
in the same direction.
- The overlap corresponds to 65 percent of the metabolic changes seen in ced-3(-), which is what
established that the two genotypes share a common metabolic program rather than converging by coincidence.
- Principal component analysis of the untargeted data separated the mutants from wild type both without
stress and under ER, osmotic, and ROS stress conditions.
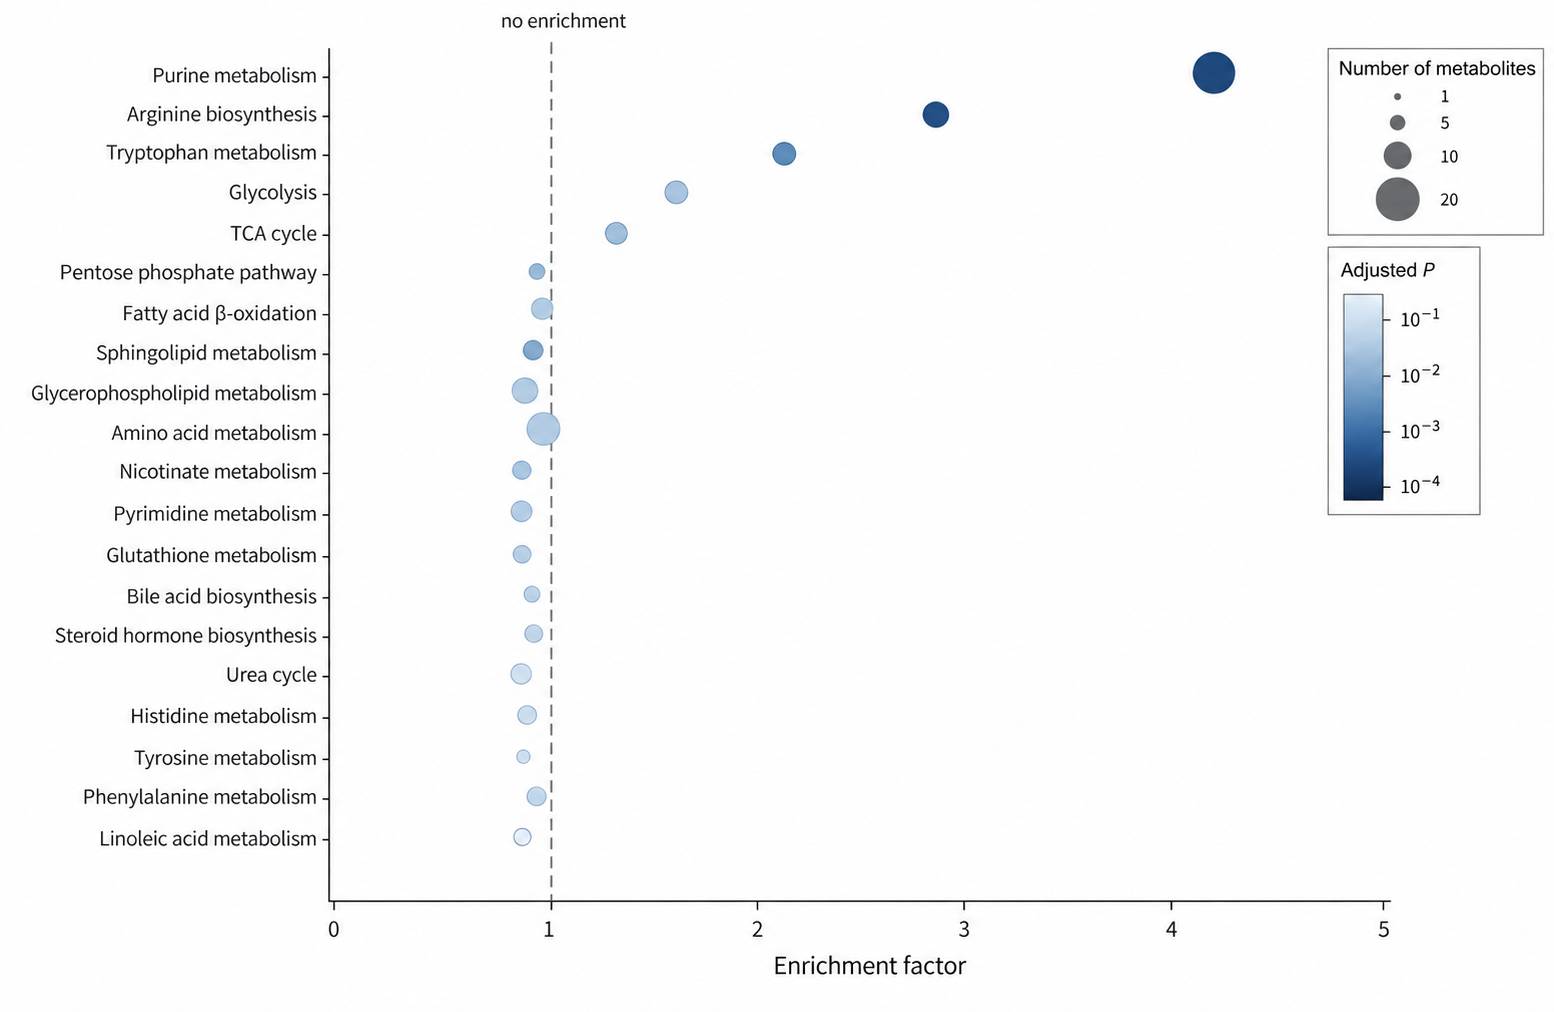
- Pathway enrichment with MetaboAnalyst against the Small Molecule Pathway Database at FDR < 0.1
returned a significant enrichment for redox adaptations in both mutants, in the absence of stress.
- Most detected homocysteine and glutathione metabolites were depleted in both mutants at baseline, and an
independent oxidized-to-reduced glutathione ratio measurement confirmed the redox shift.
- Ectopic expression of the FASN C-terminal fragment in ced-3(-) animals shifted pathway
enrichment toward multiple energy production pathways, connecting the same analytical readout to a second,
distinct metabolic program.
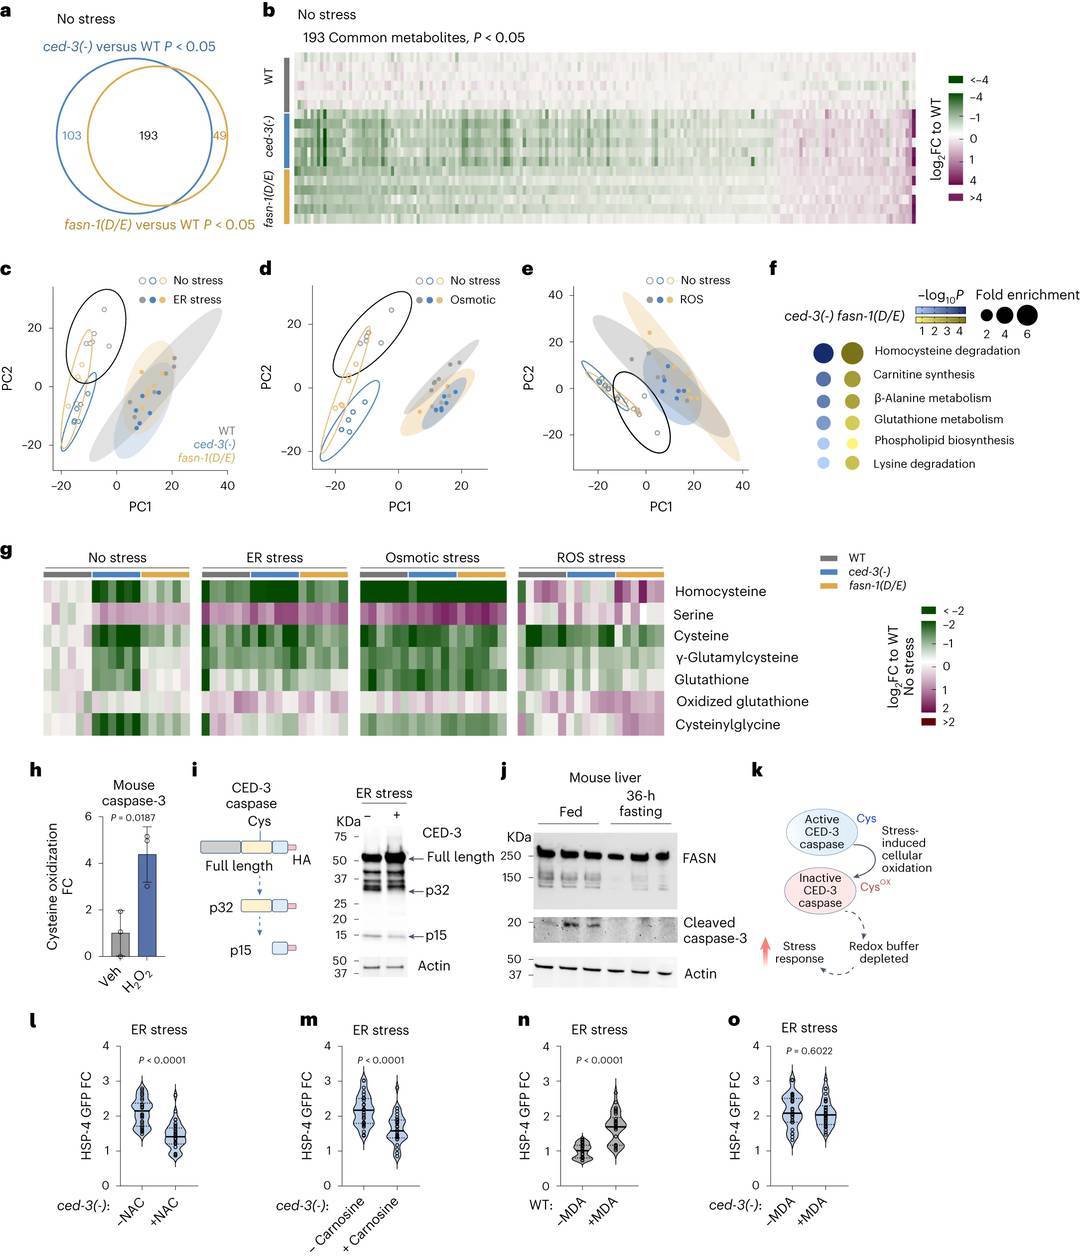 Figure 3. Untargeted metabolomics in the absence of stress, with 193 metabolites altered in both mutants, PCA across ER, osmotic, and ROS conditions, SMPDB pathway enrichment, and the glutathione pathway heat map.
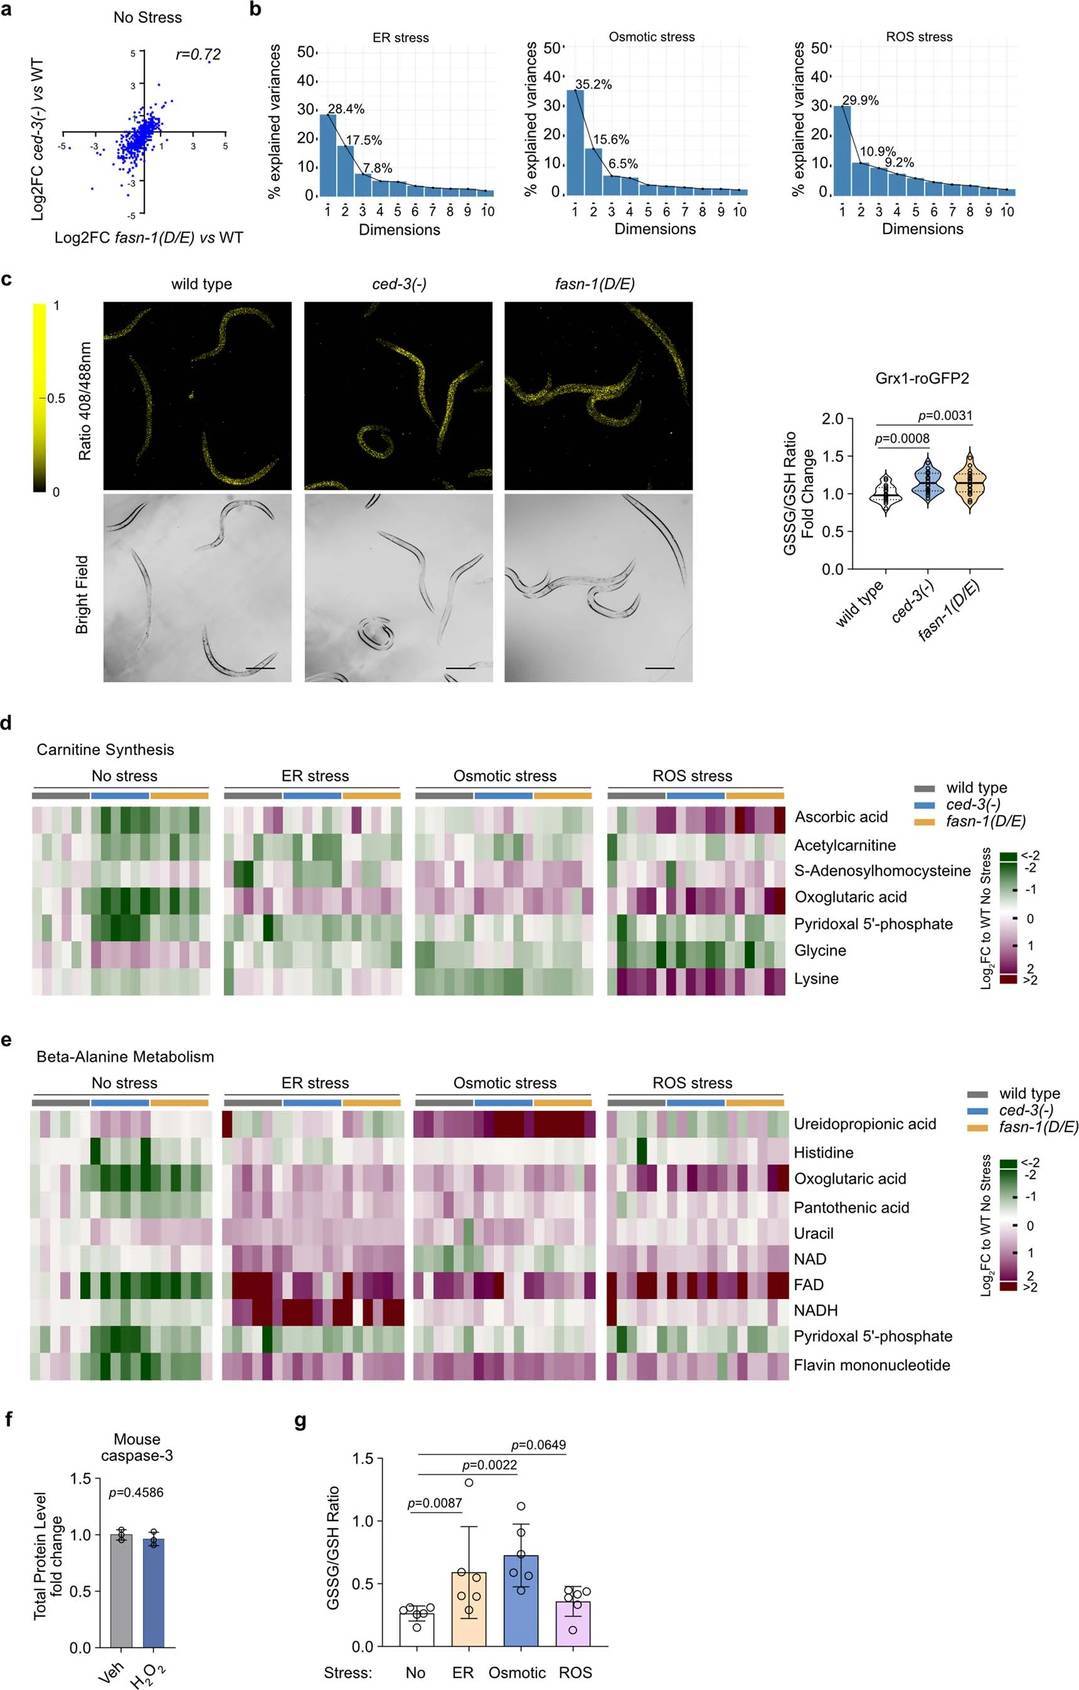 Extended Data Fig. 6. Effect of ced-3 and fasn-1 mutation on metabolism under diverse stressors, including correlation analysis of the metabolites changed in each mutant.
Process Insight
Two features of this analysis are what made the conclusion usable. First, the enrichment was run on a
background built from the detected feature set rather than from a default library, which is what allowed
redox adaptations to stand out instead of being buried under pathways that the platform simply detects more
of. Second, the mutants were compared to each other, not only to wild type: the 193 overlapping metabolites
and the 191 that moved in the same direction turned a pair of separate lists into a single shared program,
which is a stronger claim than either list supports alone. The direction check mattered at the end — the
glutathione and homocysteine metabolites were consistently depleted rather than mixed, which is why the
pathway could be reported as a directional shift and then confirmed by an independent redox measurement.
Where Our Metabolic Pathway Analysis Service Fits
Creative Proteomics performed the untargeted metabolomics in this study, and the same principles apply to
our pathway analysis programs:
- Background set matched to the experiment — the background is built from the species and
the detected feature set, so enrichment reflects the biology rather than differences in what the platform
detects.
- Cross-group comparison built into the design — multiple genetic or treatment arms are
extracted and acquired in the same batch, which is what makes an overlap between mutant signatures
interpretable.
- Direction reported per metabolite — each contributing metabolite carries its direction
of change, so a coherent pathway shift can be separated from a statistically significant but internally
inconsistent result.
- Coverage stated alongside significance — reported detected and annotated coverage shows
whether a pathway was absent from the result because it was unaltered or because it was not measured.
- Independent confirmation supported — pathway calls are delivered with the
metabolite-level evidence needed to design a targeted confirmation, as was done here with a direct
oxidized-to-reduced glutathione ratio measurement.
Reference
- Wei, H., Weaver, Y.M., Yang, C. et al.
Proteolytic activation
of fatty acid synthase signals pan-stress resolution. Nature Metabolism 6(1), 113–126
(2024).


 Contact Us


