Why Quantify Glycolysis in Your Research?
Glycolysis is a central pathway that supports:
- Tumor growth and metabolic reprogramming
- Immune cell activation and effector functions
- Obesity, diabetes, and other metabolic disease models
- Microbial fermentation and strain engineering
- Drug mechanism of action and toxicity studies
Because many glycolytic intermediates are polar, labile, and low-abundance, they are difficult to measure with generic assays. A dedicated, targeted metabolomics platform is needed to move beyond simple glucose or lactate readouts and obtain a pathway-level view of glycolysis.
Glycolysis Targeted Metabolomics Service Overview
Our Glycolysis Targeted Metabolomics Service provides LC–MS/MS–based quantification of key glycolytic intermediates, with optional coverage of related central carbon metabolism nodes (e.g., TCA intermediates).
With this service, you can:
- Quantify glycolytic intermediates across cells, tissues, body fluids, and microbial samples
- Compare metabolic states between control vs. treated, wild-type vs. knockout, responder vs. non-responder
- Assess how drugs, gene perturbations, diet, or process changes reshape glycolytic flux
Glycolysis Targeted Metabolite Panels
We provide several glycolysis-focused targeted metabolite panels that can be used alone or combined, depending on your study design and pathway coverage needs.
Core Glycolysis Metabolite Panel (Standard)
This LC–MS/MS panel is designed for pathway-level profiling of glycolysis and includes isomer-resolved measurement of key intermediates.
| Segment |
Metabolites (examples) |
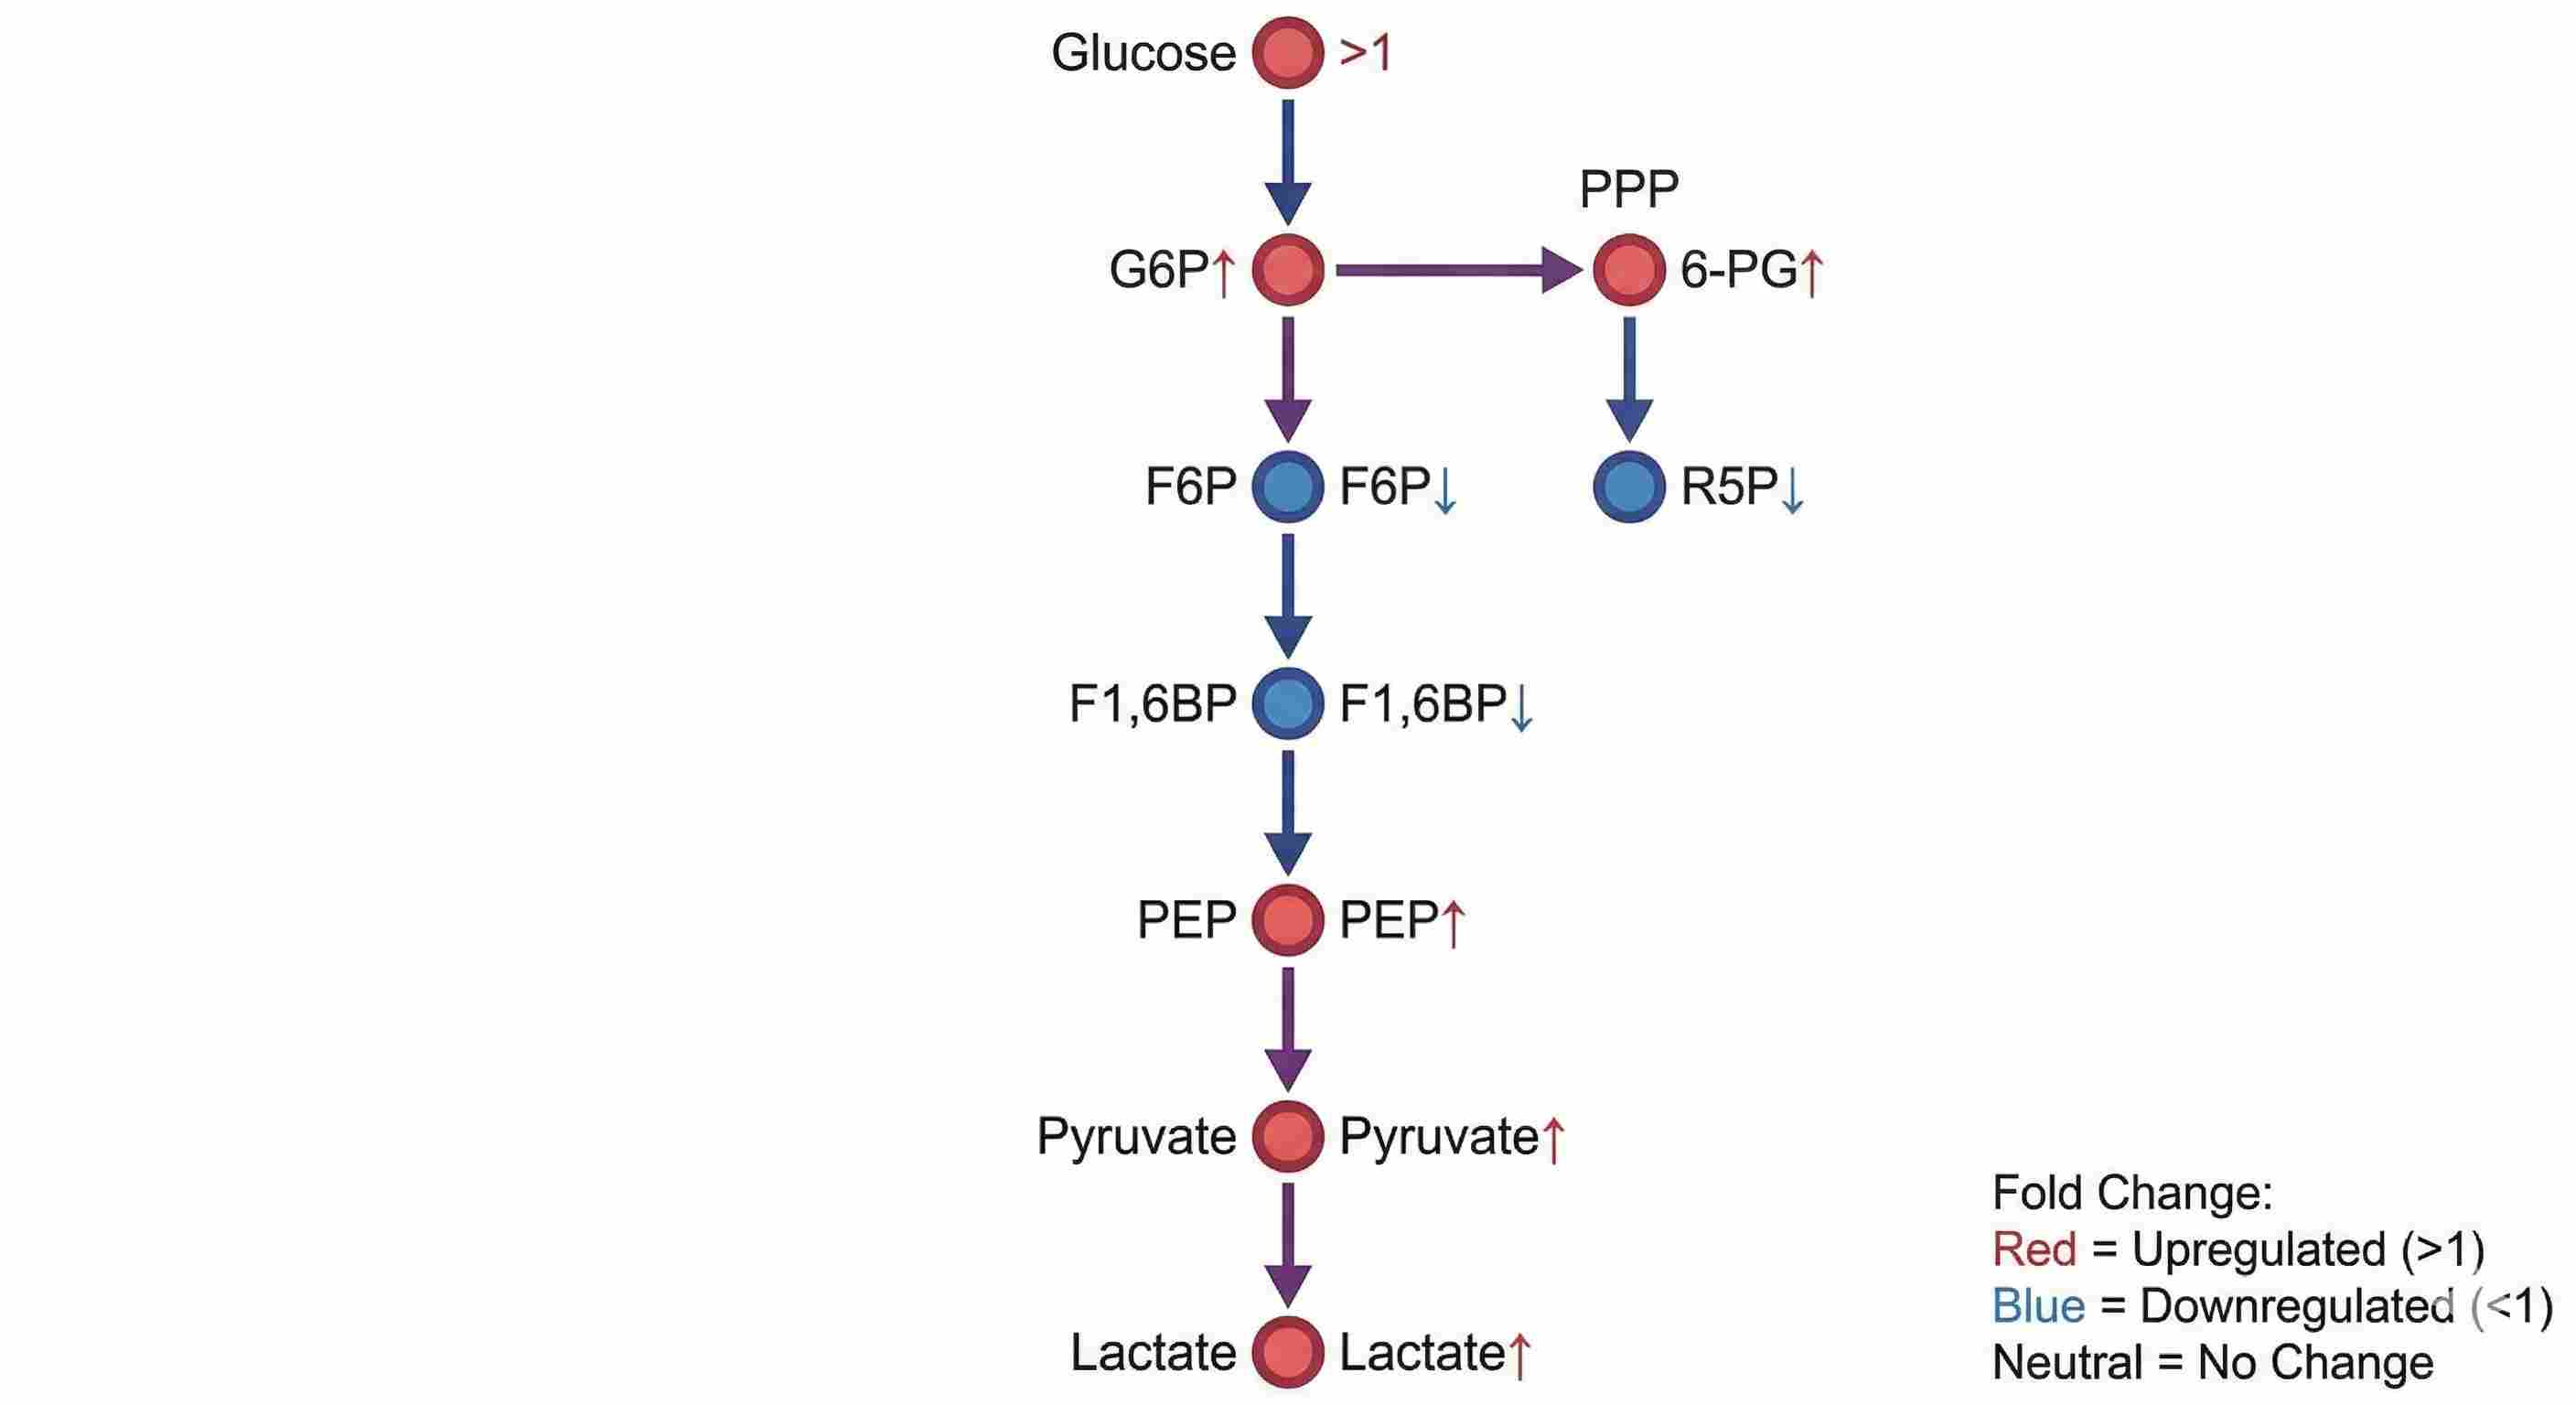
| Upper glycolysis |
Glucose-6-phosphate (G6P)*; Fructose-6-phosphate (F6P)*; Fructose-1,6-bisphosphate (F1,6BP) |
| Mid-pathway |
Glyceraldehyde-3-phosphate (G3P); Dihydroxyacetone phosphate (DHAP); 3-phosphoglycerate (3-PG); 2-phosphoglycerate (2-PG) |
| Late glycolysis/output |
Phosphoenolpyruvate (PEP); Pyruvate; Lactate |
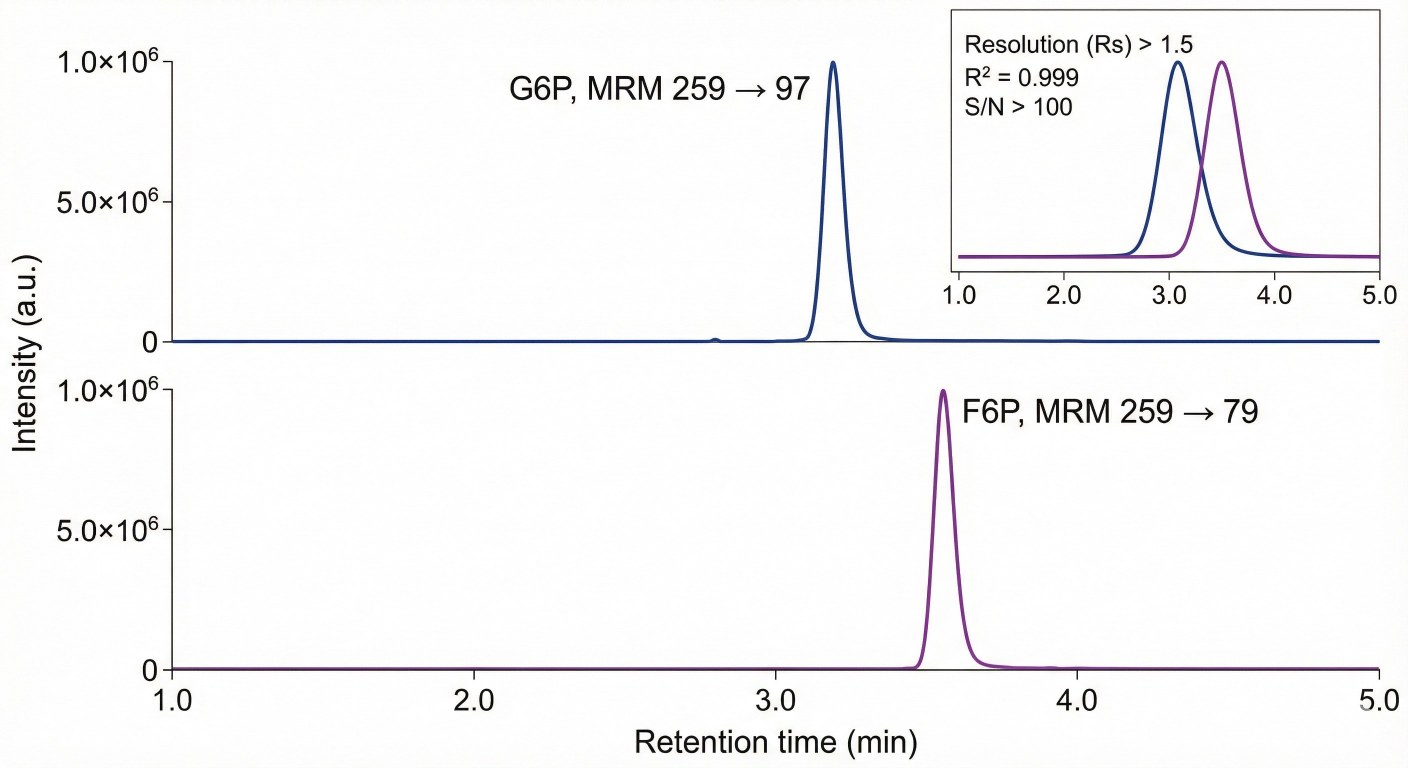
* G6P and F6P are chromatographically separated to distinguish glycolysis from PPP-related flux.
For projects that require a broader view of central carbon metabolism, you can add one or more of the following targeted panels:
| Panel |
Typical Metabolites (examples) |
Typical Use Cases |
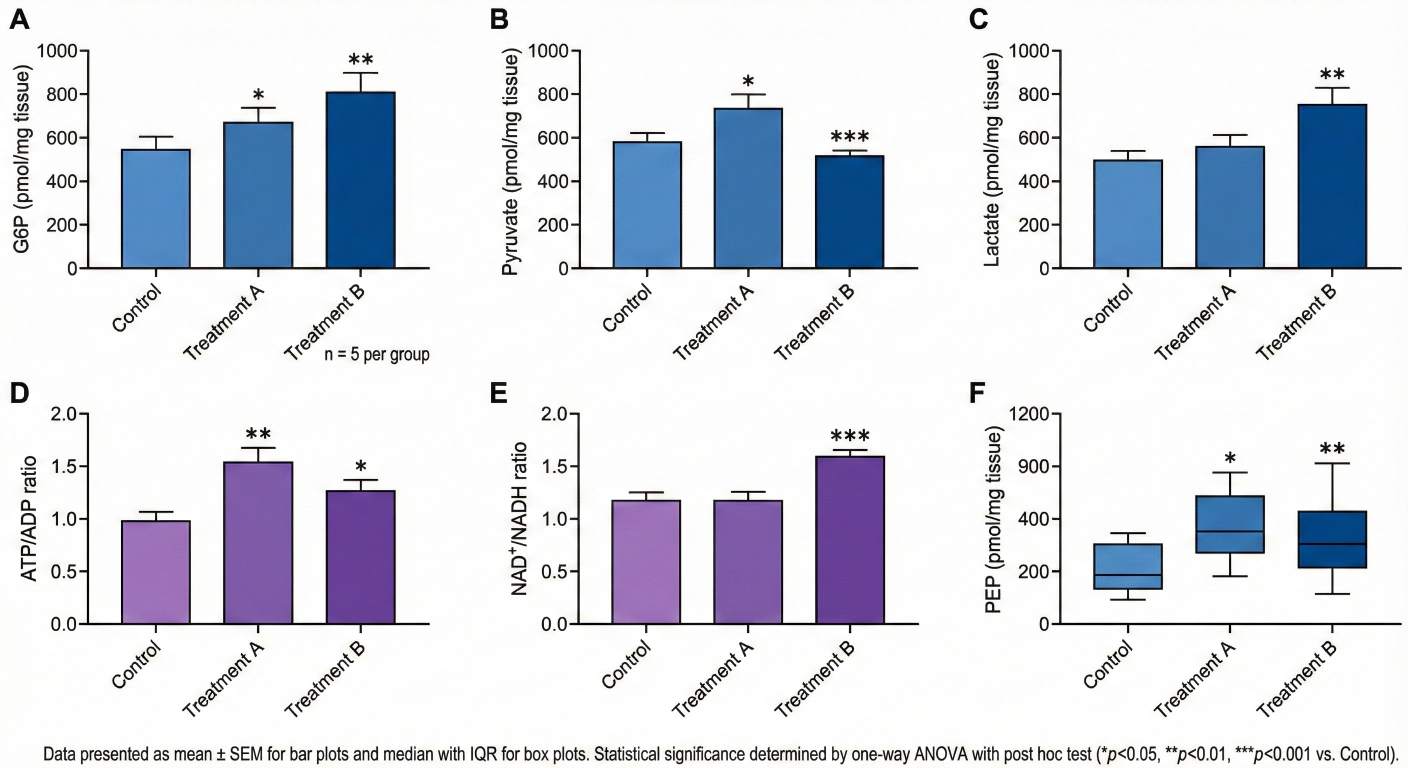
| Glycolysis + Energy Cofactor Panel |
ATP, ADP, AMP, NAD⁺, NADH (measured together with glycolytic intermediates) |
Linking glycolytic flux to cellular energy charge and redox balance |
| Glycolysis + TCA Cycle Panel |
Citrate, cis-aconitate, α-ketoglutarate, succinate, fumarate, malate |
Coordinated analysis of glycolysis and mitochondrial TCA activity |
| Glycolysis + PPP Panel |
6-phosphogluconate (6-PG), ribose-5-phosphate (R5P), sedoheptulose-7-phosphate |
Investigating NADPH production, oxidative stress, nucleotide synthesis |
| Glycolysis + Hexosamine Pathway Panel |
Glucosamine-6-phosphate (GlcN6P), UDP-N-acetylglucosamine (UDP-GlcNAc) |
Studying protein glycosylation, signaling, and nutrient sensing |
Panels can be combined or customized, enabling you to build a glycolysis-focused targeted metabolomics panel that matches your specific pathway and flux questions.
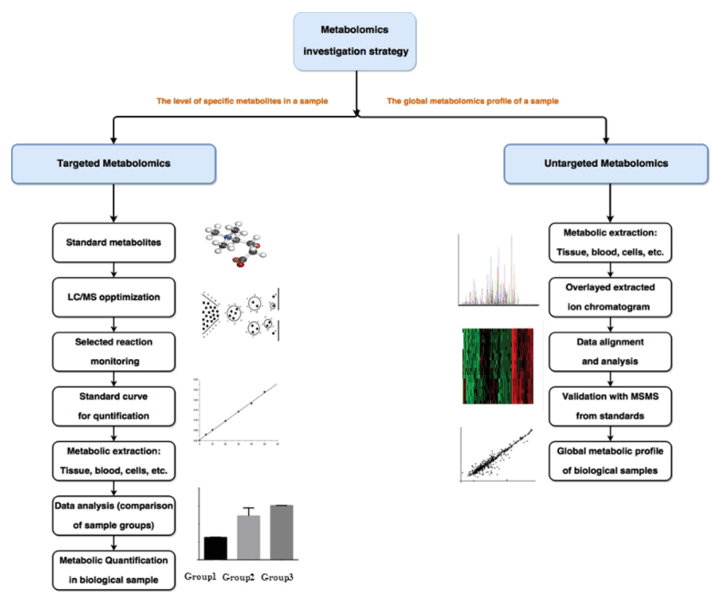
Targeted vs. Untargeted Metabolomics for Glycolysis
| Aspect |
Untargeted Metabolomics |
Targeted Glycolysis Metabolomics |
| Purpose |
Discovery-driven; Global metabolic profiling |
Quantitative, pathway-level analysis of glycolysis |
| Best For |
Identifying unknown metabolic changes, early-stage studies |
Validating metabolic hypotheses, mechanism-of-action studies |
| Metabolite Coverage |
Broad, covering many metabolic pathways |
Focused on key glycolytic intermediates and related pathways |
| Glycolytic Metabolite Resolution |
Limited; possible poor resolution of glycolytic isomers (e.g., G6P/F6P) |
High-resolution; G6P/F6P separation for precise pathway flux |
| Energy Co-Factors |
Not typically measured in untargeted workflows |
ATP, ADP, AMP, NAD⁺, NADH can be included alongside glycolytic intermediates |
| Pathway Depth |
Limited; may miss key branches like PPP, HBP |
Comprehensive, covering glycolysis, PPP, TCA, and more |
| Data Confidence |
Lower reproducibility for specific metabolites |
High reproducibility and quantification |
| Typical Use Case |
Exploration phase: Identifying broad metabolic shifts |
Validation phase: Targeted analysis of glycolysis and energy metabolism |
Recommended Approach
For discovery-focused studies, you can use untargeted metabolomics to identify key metabolic changes across pathways, and then use targeted glycolysis metabolomics to validate and quantify specific intermediates of interest. This two-step approach provides both global insights and detailed pathway analysis.
Key Advantages of Our Glycolysis Metabolism Service
- Accurate Quantification of Unstable Metabolites
Optimized LC–MS/MS methods ensure reliable detection of polar, low-abundance glycolytic intermediates.
- Isomer Separation of G6P and F6P
We resolve key isomers like glucose-6-phosphate and fructose-6-phosphate, enabling clear analysis of glycolysis vs. PPP flux.
- Integrated Detection of Energy Cofactors
ATP, ADP, AMP, NAD⁺, and NADH can be analyzed alongside glycolytic metabolites in a single workflow.
- Coverage of Glycolysis-Linked Pathways
Optional inclusion of pentose phosphate pathway metabolites (e.g., 6-PG, R5P) and other central carbon nodes.
- Support for Low-Input and Precious Samples
Extraction protocols support small tissue samples and limited cell numbers, including sorted immune cell subsets.
- Validated Rapid Quenching & Sample Handling SOPs
We offer expert guidance on rapid quenching to preserve labile intermediates in cells and tissues.
- Pathway-Level Biological Insight
Results include statistical analysis, visualizations, and interpretation support to reveal metabolic rewiring.
LC–MS/MS Platform for Glycolysis Metabolite Quantification
Instrumentation
LC–MS/MS platform: Triple quadrupole mass spectrometer
Separation methods:
- HILIC (hydrophilic interaction chromatography) for polar metabolites
- Reverse-phase LC for energy cofactors and hydrophobic metabolites
Detection mode: Multiple Reaction Monitoring (MRM/SRM)
Quantification & QC
| Item |
Details |
| Quantification method |
Internal-standard–based normalization, with multi-point calibration curves for key metabolites |
| LOD / LOQ |
Typically in the low nanomolar (nM) to high micromolar (μM) range, depending on metabolite and sample type |
| Reproducibility |
Intra- and inter-batch coefficient of variation (CV) typically <10–15% for most metabolites |
| QC strategy |
Includes pooled QC samples, blanks, random injection order, technical replicates, and signal drift checks |
| Batch capacity |
Flexible batch sizes, suitable for both pilot studies and large-cohort projects |
| Data output formats |
Raw MS files (optional), integrated peak areas, normalized data, and concentration tables where applicable |
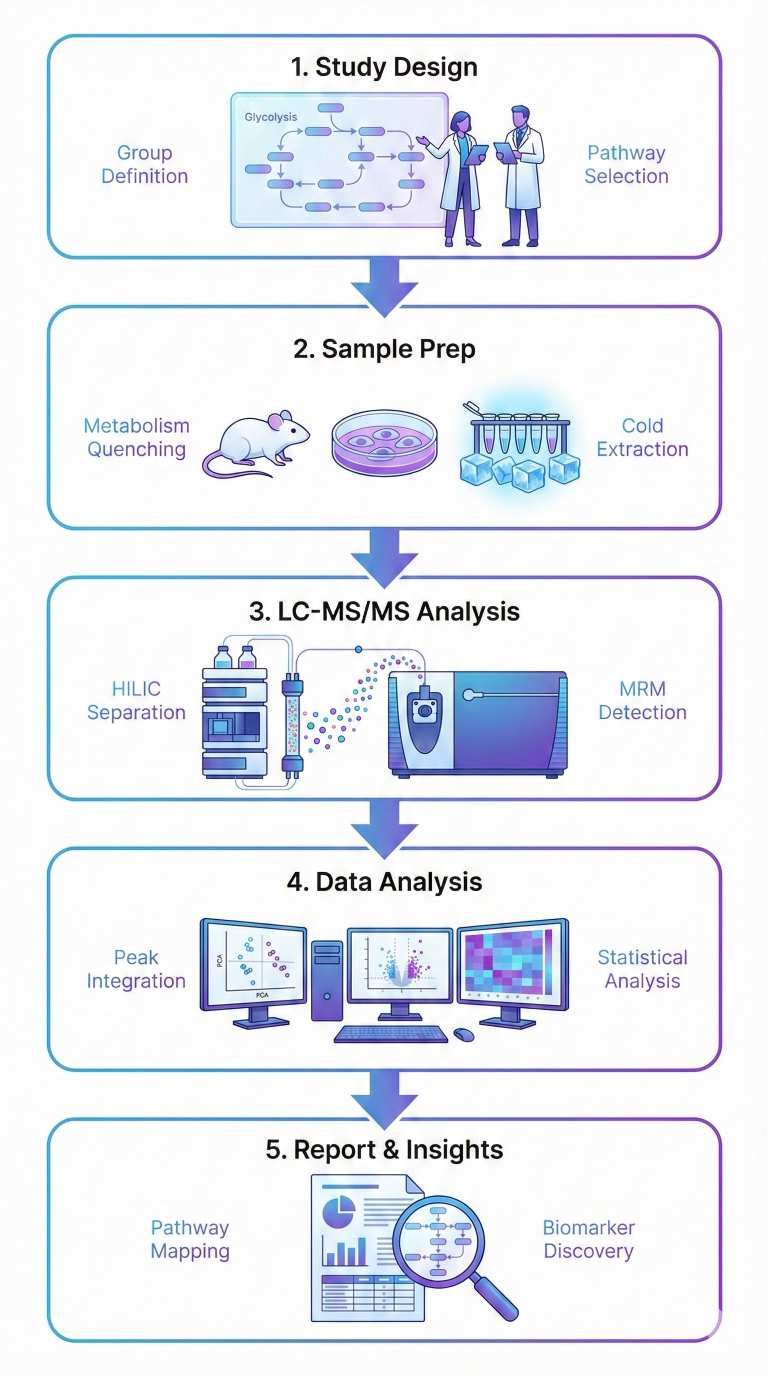
How Our Glycolysis Metabolomics Service Works
1. Consultation & Custom Panel Design
We clarify your research questions (e.g., glycolytic flux, PPP involvement, energy status) and recommend or customize a glycolysis-focused panel accordingly.
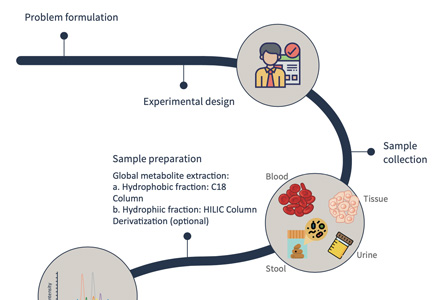
2. Sample Preparation
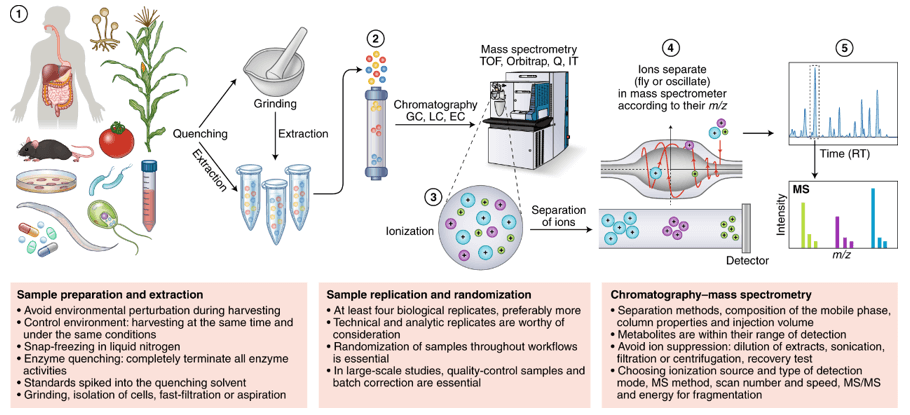
You collect tissues, cells, body fluids, or microbial samples following our SOPs; rapid quenching, snap-freezing, and storage at −80 °C are required to preserve labile glycolytic intermediates.
3. LC–MS/MS Analysis
Samples are analyzed by targeted LC–MS/MS with chromatographic separation of key isomers (e.g., G6P/F6P), internal standards, and MRM methods to ensure sensitive and reproducible quantification.
4. Data Processing & Statistical Analysis
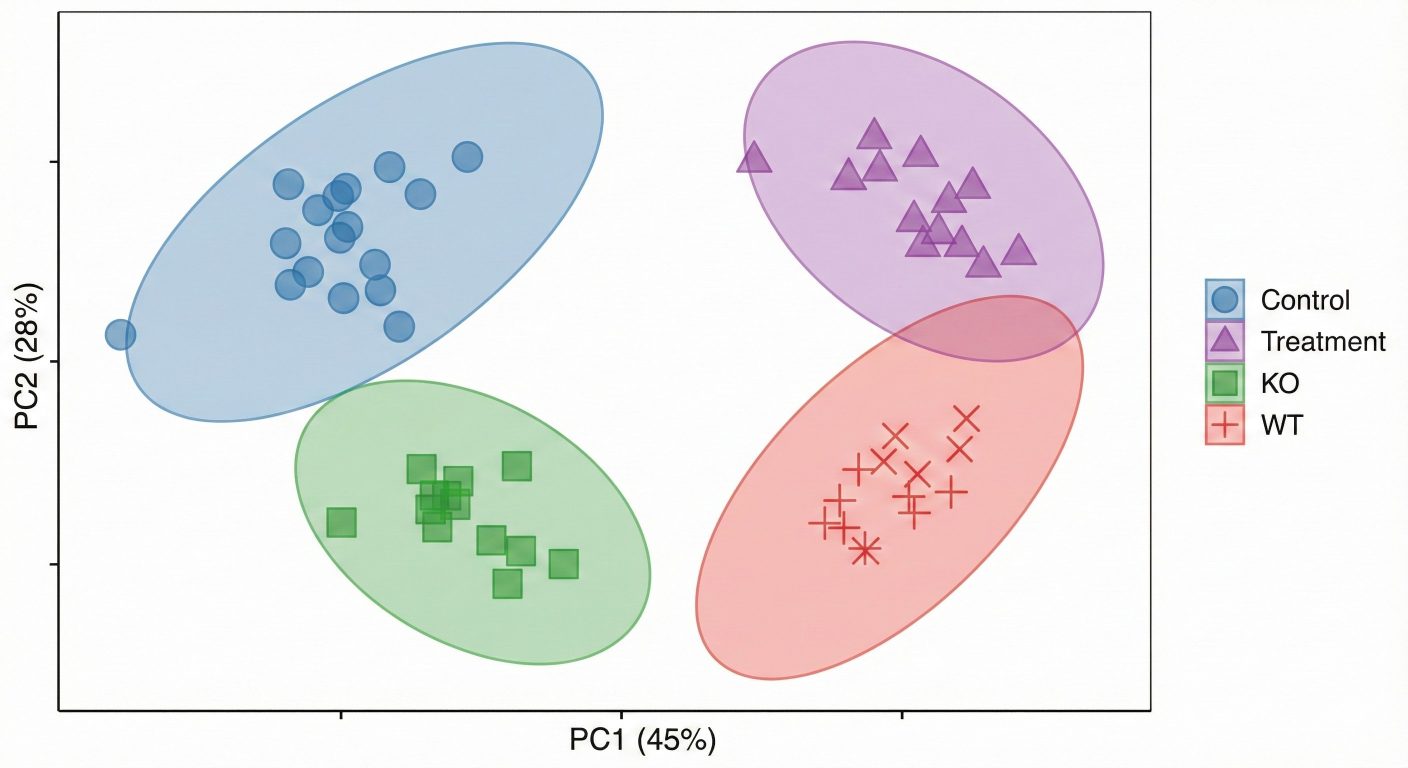
We integrate peaks, normalize data, and perform statistical and pathway analysis (e.g., group comparisons, PCA/PLS-DA) to reveal glycolysis- and PPP-related metabolic shifts.
5. Results & Reporting
You receive processed data, key figures, and a concise methods and QC summary, with optional discussion to help link metabolic changes to your experimental model.
Typical Research Applications of Glycolysis Metabolism Analysis
Sample Submission Guidelines for Glycolysis Metabolomics Service
| Sample Type |
Recommended Amount |
Container Requirements |
Storage Conditions |
Special Notes |
| Tissue |
≥ 20 mg wet weight per sample |
1.5 mL or 2.0 mL microcentrifuge tube (pre-chilled) |
Immediately snap-freeze in liquid nitrogen; store at −80 °C |
Avoid blood contamination; DO NOT use formalin-fixed or paraffin-embedded tissue |
| Adherent cells |
≥ 1 million cells per sample (cell pellet) |
1.5 mL microcentrifuge tube |
Snap-freeze pellet after washing with cold PBS; store at −80 °C |
Provide cell count and treatment info; avoid serum carryover |
| Suspension cells |
≥ 1 million cells per sample (pelleted) |
Same as above |
Same as above |
Pre-wash with cold PBS to remove media components |
| FACS-sorted cells |
≥ 50,000–100,000 cells (depending on target) |
Low-retention microtube |
Freeze immediately in dry ice or liquid nitrogen |
Consult us in advance; ultra-low volume protocol available |
| Serum / Plasma |
≥ 100 μL per sample |
0.5–1.5 mL cryovial (low-binding recommended) |
Aliquot and freeze at −80 °C immediately after separation |
Avoid repeated freeze–thaw cycles |
| Urine |
≥ 500 μL |
Same as above |
Store at −80 °C |
First-morning urine preferred; avoid preservatives |
| CSF |
≥ 50 μL |
Low-binding cryovial |
Store at −80 °C |
Handle with care; avoid hemolysis |
| Microbial pellets |
From OD600 ~1.0 culture, ≥ 1 mL culture volume |
1.5 mL tube |
Pellet cells, wash once in cold PBS, freeze at −80 °C |
Indicate strain, media, and growth phase |
| Fermentation broth / culture supernatant |
≥ 1 mL (filtered or centrifuged) |
Cryovial |
Store at −80 °C |
Clarify time point and medium used |
Deliverables: What You Receive from GAG Analysis
- Normalized metabolite data (peak areas, optional concentrations)
- Group comparisons with fold change and p-values
- PCA, PLS-DA, heatmaps, volcano plots
- Pathway maps for glycolysis and related routes
- Technical summary and QC metrics
- Sample metadata (ID, type, treatment info)
- Optional: raw MS files and custom visualizations
Macrophage-associated lipin-1 promotes β-oxidation in response to proresolving stimuli
Schilke, R. M., Blackburn, C. M., Rao, S., Krzywanski, D. M., Finck, B. N., & Woolard, M. D.
Journal: Immunohorizons
Year: 2020
DOI: https://doi.org/10.4049/immunohorizons.2000047
Mechanisms underlying neonate-specific metabolic effects of volatile anesthetics
Stokes, J., Freed, A., et al.
Journal: eLife
Year: 2021
DOI: https://doi.org/10.7554/eLife.65400
Insulin resistance does not impair mechanical overload-stimulated glucose uptake, but does alter the metabolic fate of glucose in mouse muscle
Weyrauch, L. A., McMillin, S. L., & Witczak, C. A.
Journal: International Journal of Molecular Sciences
Year: 2020
DOI: https://doi.org/10.3390/ijms21134715
YAP mediates compensatory cardiac hypertrophy through aerobic glycolysis in response to pressure overload
Kashihara, T., Mukai, R., Oka, S. I., Zhai, P., Nakada, Y., Yang, Z., ... & Sadoshima, J.
Journal: The Journal of Clinical Investigation
Year: 2022
DOI: https://doi.org/10.1172/JCI150595
Resting natural killer cell homeostasis relies on tryptophan/NAD+ metabolism and HIF‐1α
Pelletier, A., Nelius, E., Fan, Z., Khatchatourova, E., Alvarado‐Diaz, A., He, J., ... & Stockmann, C.
Journal: EMBO Reports
Year: 2023
DOI: https://doi.org/10.15252/embr.202256156