Untargeted metabolomics yields insight into ALS disease mechanisms
Background
Amyotrophic Lateral Sclerosis (ALS) is a neurodegenerative disorder, and understanding its metabolic profile can offer insights into disease mechanisms and identify novel therapeutic opportunities. Metabolomic analyses provide a comprehensive view of endogenous and exogenous influences on ALS, allowing the identification of biomarkers and potential drug targets.
Samples:
The study included 125 ALS and 71 control participants, matched for key demographics. ALS cases represented a typical population with median diagnostic age, symptom onset-to-diagnosis interval, and distribution across onset segments. Metabolite profiling involved the identification of 1051 metabolites, with 144 excluded due to high missingness. A total of 899 metabolites were used for downstream analysis.
Technical Methods
Metabolite Profiling: 1051 metabolites were identified, and 144 with >60% missingness were excluded.
Drug Metabolite Exclusion: Eight drug metabolites were removed from analysis due to weak correlations and high missingness.
Differential Analysis: Wilcoxon rank-sum tests identified 303 significant metabolites. Logistic regression models, adjusted for sex, age, and BMI, further identified 300 metabolites. Partial Least Squares Discriminant Analysis (PLS-DA) and Group Lasso methods were also employed.
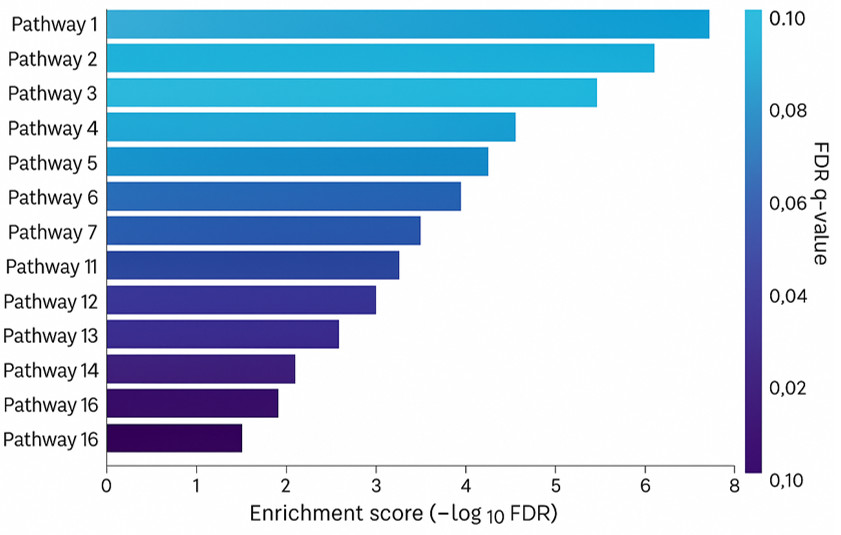
Pathway Enrichment Analysis: Identified significantly over-represented sub-pathways among differential metabolites.
Machine Learning Classification: Seven algorithms were applied to predict ALS cases using 259 Group Lasso-selected metabolites.
Results
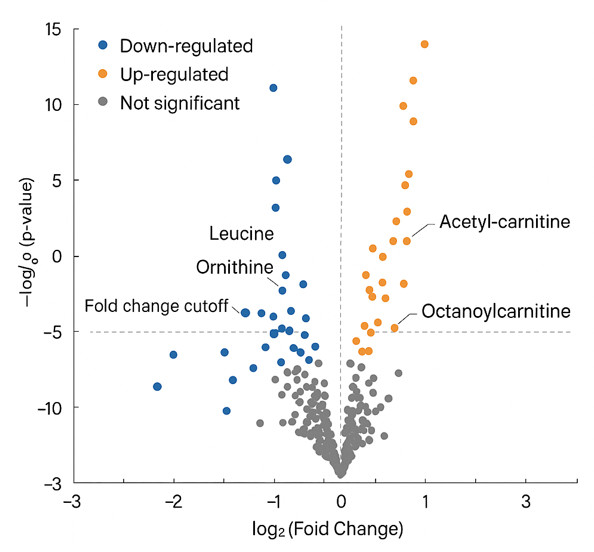
Differential Metabolites: 303 metabolites were identified as differentially expressed in ALS, with overlaps across various analytical methods.
Pathway Enrichment: Shared sub-pathways, including 'sphingomyelins,' 'ceramides,' 'benzoate metabolism,' and 'fatty acid metabolism,' were enriched across different models. Group Lasso uniquely identified 'diacylglycerol,' 'chemical,' and other sub-pathways.
Metabolite Correlations: Interconnections between significant metabolites and their sub-pathways were visualized, revealing associations in sphingolipid metabolism, polyamine metabolism, and more.
Diagnostic Potential: Machine learning models using 259 Group Lasso-selected metabolites demonstrated high diagnostic potential, with Receiver Operating Characteristic (ROC) analysis showing an AUC of 0.98.
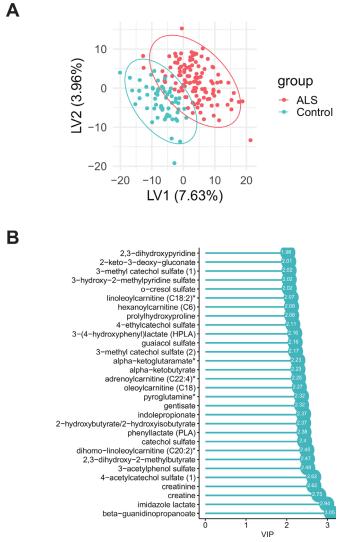 Partial least squares-discriminant analysis (PLS-DA) analysis of amyotrophic lateral sclerosis (ALS) cases versus controls. (A) PLS-DA score plot of ALS cases (red) versus controls (blue); each dot represents an individual subject. (B) The variable importance in projection (VIP) score plot of the top 30 PLS-DA metabolites, which most significantly separate cases from controls.
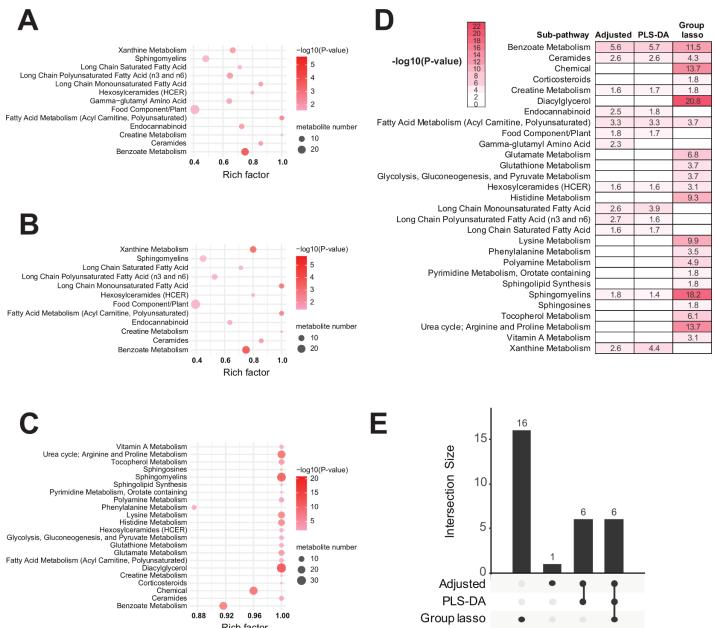 Pathway enrichment of adjusted logistic regression-selected, partial least squares-discriminant analysis (PLS-DA)-selected and group lassoselected metabolites
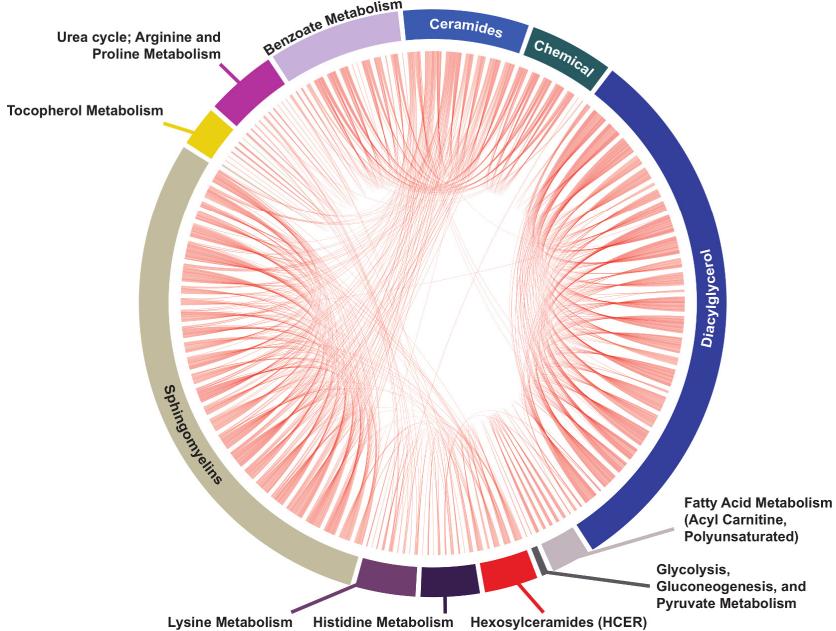 Metabolite correlation analysis of group lasso-selected metabolites
Reference
- Goutman, Stephen A., et al. "Untargeted metabolomics yields insight into ALS disease mechanisms." Journal of Neurology, Neurosurgery & Psychiatry 91.12 (2020): 1329-1338.
MS-CETSA functional proteomics uncovers new DNA-repair programs leading to Gemcitabine resistance
Nordlund, P., Liang, Y. Y., Khalid, K., Van Le, H., Teo, H. M., Raitelaitis, M., ... & Prabhu, N.
Journal: Research Square
Year: 2024
DOI: https://doi.org/10.21203/rs.3.rs-4820265/v1
High Levels of Oxidative Stress Early after HSCT Are Associated with Later Adverse Outcomes
Cook, E., Langenberg, L., Luebbering, N., Ibrahimova, A., Sabulski, A., Lake, K. E., ... & Davies, S. M.
Journal:Transplantation and Cellular Therapy
Year: 2024
DOI: https://doi.org/10.1016/j.jtct.2023.12.096
Multiomics of a rice population identifies genes and genomic regions that bestow low glycemic index and high protein content
Badoni, S., Pasion-Uy, E. A., Kor, S., Kim, S. R., Tiozon Jr, R. N., Misra, G., ... & Sreenivasulu, N.
Journal: Proceedings of the National Academy of Sciences
Year: 2024
DOI: https://doi.org/10.1073/pnas.2410598121
The Brain Metabolome Is Modified by Obesity in a Sex-Dependent Manner
Norman, J. E., Milenkovic, D., Nuthikattu, S., & Villablanca, A. C.
Journal: International Journal of Molecular Sciences
Year: 2024
DOI: https://doi.org/10.3390/ijms25063475
UDP-Glucose/P2Y14 Receptor Signaling Exacerbates Neuronal Apoptosis After Subarachnoid Hemorrhage in Rats
Kanamaru, H., Zhu, S., Dong, S., Takemoto, Y., Huang, L., Sherchan, P., ... & Zhang, J. H.
Journal: Stroke
Year: 2024
DOI: https://doi.org/10.1161/STROKEAHA.123.044422
Pan-lysyl oxidase inhibition disrupts fibroinflammatory tumor stroma, rendering cholangiocarcinoma susceptible to chemotherapy
Burchard, P. R., Ruffolo, L. I., Ullman, N. A., Dale, B. S., Dave, Y. A., Hilty, B. K., ... & Hernandez-Alejandro, R.
Journal: Hepatology Communications
Year: 2024
DOI: https://doi.org/10.1097/HC9.0000000000000502
Comparative metabolite profiling of salt sensitive Oryza sativa and the halophytic wild rice Oryza coarctata under salt stress
Tamanna, N., Mojumder, A., Azim, T., Iqbal, M. I., Alam, M. N. U., Rahman, A., & Seraj, Z. I.
Journal: Plant‐Environment Interactions
Year: 2024
DOI: https://doi.org/10.1002/pei3.10155
Teriflunomide/leflunomide synergize with chemotherapeutics by decreasing mitochondrial fragmentation via DRP1 in SCLC
Mirzapoiazova, T., Tseng, L., Mambetsariev, B., Li, H., Lou, C. H., Pozhitkov, A., ... & Salgia, R.
Journal: iScience
Year: 2024
DOI: https://doi.org/10.1016/j.isci.2024.110132
Physiological, transcriptomic and metabolomic insights of three extremophyte woody species living in the multi-stress environment of the Atacama Desert
Gajardo, H. A., Morales, M., Larama, G., Luengo-Escobar, A., López, D., Machado, M., ... & Bravo, L. A.
Journal: Planta
Year: 2024
DOI: https://doi.org/10.1007/s00425-024-04484-1
A personalized probabilistic approach to ovarian cancer diagnostics
Ban, D., Housley, S. N., Matyunina, L. V., McDonald, L. D., Bae-Jump, V. L., Benigno, B. B., ... & McDonald, J. F.
Journal: Gynecologic Oncology
Year: 2024
DOI: https://doi.org/10.1016/j.ygyno.2023.12.030
Glucocorticoid-induced osteoporosis is prevented by dietary prune in female mice
Chargo, N. J., Neugebauer, K., Guzior, D. V., Quinn, R. A., Parameswaran, N., & McCabe, L. R.
Journal: Frontiers in Cell and Developmental Biology
Year: 2024
DOI: https://doi.org/10.3389/fcell.2023.1324649
Proteolytic activation of fatty acid synthase signals pan-stress resolution
Wei, H., Weaver, Y. M., Yang, C., Zhang, Y., Hu, G., Karner, C. M., ... & Weaver, B. P.
Journal: Nature Metabolism
Year: 2024
DOI: https://doi.org/10.1038/s42255-023-00939-z
Quantifying forms and functions of intestinal bile acid pools in mice
Sudo, K., Delmas-Eliason, A., Soucy, S., Barrack, K. E., Liu, J., Balasubramanian, A., … & Sundrud, M. S.
Journal: bioRxiv
Year: 2024
DOI: https://doi.org/10.1101/2024.02.16.580658
Elevated SLC7A2 expression is associated with an abnormal neuroinflammatory response and nitrosative stress in Huntington's disease
Gaudet, I. D., Xu, H., Gordon, E., Cannestro, G. A., Lu, M. L., & Wei, J.
Journal: Journal of Neuroinflammation
Year: 2024
DOI: https://doi.org/10.1186/s12974-024-03038-2
Thermotolerance capabilities, blood metabolomics, and mammary gland hemodynamics and transcriptomic profiles of slick-haired Holstein cattle during mid lactation in Puerto Rico
Contreras-Correa, Z. E., Sánchez-Rodríguez, H. L., Arick II, M. A., Muñiz-Colón, G., & Lemley, C. O.
Journal: Journal of Dairy Science
Year: 2024
DOI: https://doi.org/10.3168/jds.2023-23878
Glycine supplementation can partially restore oxidative stress-associated glutathione deficiency in ageing cats
Ruparell, A., Alexander, J. E., Eyre, R., Carvell-Miller, L., Leung, Y. B., Evans, S. J., ... & Watson, P.
Journal: British Journal of Nutrition
Year: 2024
DOI: https://doi.org/10.1017/S0007114524000370
Untargeted metabolomics reveal sex-specific and non-specific redox-modulating metabolites in kidneys following binge drinking
Rafferty, D., de Carvalho, L. M., Sutter, M., Heneghan, K., Nelson, V., Leitner, M., ... & Puthanveetil, P.
Journal: Redox Experimental Medicine
Year: 2023
DOI: https://doi.org/10.1530/REM-23-0005
Sex modifies the impact of type 2 diabetes mellitus on the murine whole brain metabolome
Norman, J. E., Nuthikattu, S., Milenkovic, D., & Villablanca, A. C.
Journal: Metabolites
Year: 2023
DOI: https://doi.org/10.3390/metabo13091012
A human iPSC-derived hepatocyte screen identifies compounds that inhibit production of Apolipoprotein B
Liu, J. T., Doueiry, C., Jiang, Y. L., Blaszkiewicz, J., Lamprecht, M. P., Heslop, J. A., ... & Duncan, S. A.
Journal: Communications Biology
Year: 2023
DOI: https://doi.org/10.1038/s42003-023-04739-9
Methyl donor supplementation reduces phospho‐Tau, Fyn and demethylated protein phosphatase 2A levels and mitigates learning and motor deficits in a mouse model of tauopathy
van Hummel, A., Taleski, G., Sontag, J. M., Feiten, A. F., Ke, Y. D., Ittner, L. M., & Sontag, E.
Journal: Neuropathology and Applied Neurobiology
Year: 2023
DOI: https://doi.org/10.1111/nan.12931
Sex hormones, sex chromosomes, and microbiota: identification of Akkermansia muciniphila as an estrogen-responsive bacterium
Sakamuri, A., Bardhan, P., Tummala, R., Mauvais-Jarvis, F., Yang, T., Joe, B., & Ogola, B. O.
Journal: Microbiota and Host
Year: 2023
DOI: https://doi.org/10.1530/MAH-23-0010
Living in extreme environments: a photosynthetic and desiccation stress tolerance trade-off story, but not for everyone
Gajardo, H. A., Morales, M., López, D., Luengo-Escobar, M., Machado, A., Nunes-Nesi, A., ... & Bravo, L.
Journal: Authorea Preprints
Year: 2023
DOI: https://doi.org/10.22541/au.168311184.42382633/v2
Resting natural killer cell homeostasis relies on tryptophan/NAD+ metabolism and HIF‐1α
Pelletier, A., Nelius, E., Fan, Z., Khatchatourova, E., Alvarado‐Diaz, A., He, J., ... & Stockmann, C.
Journal: EMBO Reports
Year: 2023
DOI: https://doi.org/10.15252/embr.202256156
Function and regulation of a steroidogenic CYP450 enzyme in the mitochondrion of Toxoplasma gondii
Asady, B., Sampels, V., Romano, J. D., Levitskaya, J., Lige, B., Khare, P., ... & Coppens, I.
Journal: PLoS Pathogens
Year: 2023
DOI: https://doi.org/10.1371/journal.ppat.1011566