Glucosinolates — Why Targeted Profiling Matters for Plant, Food, and Nutrition Research
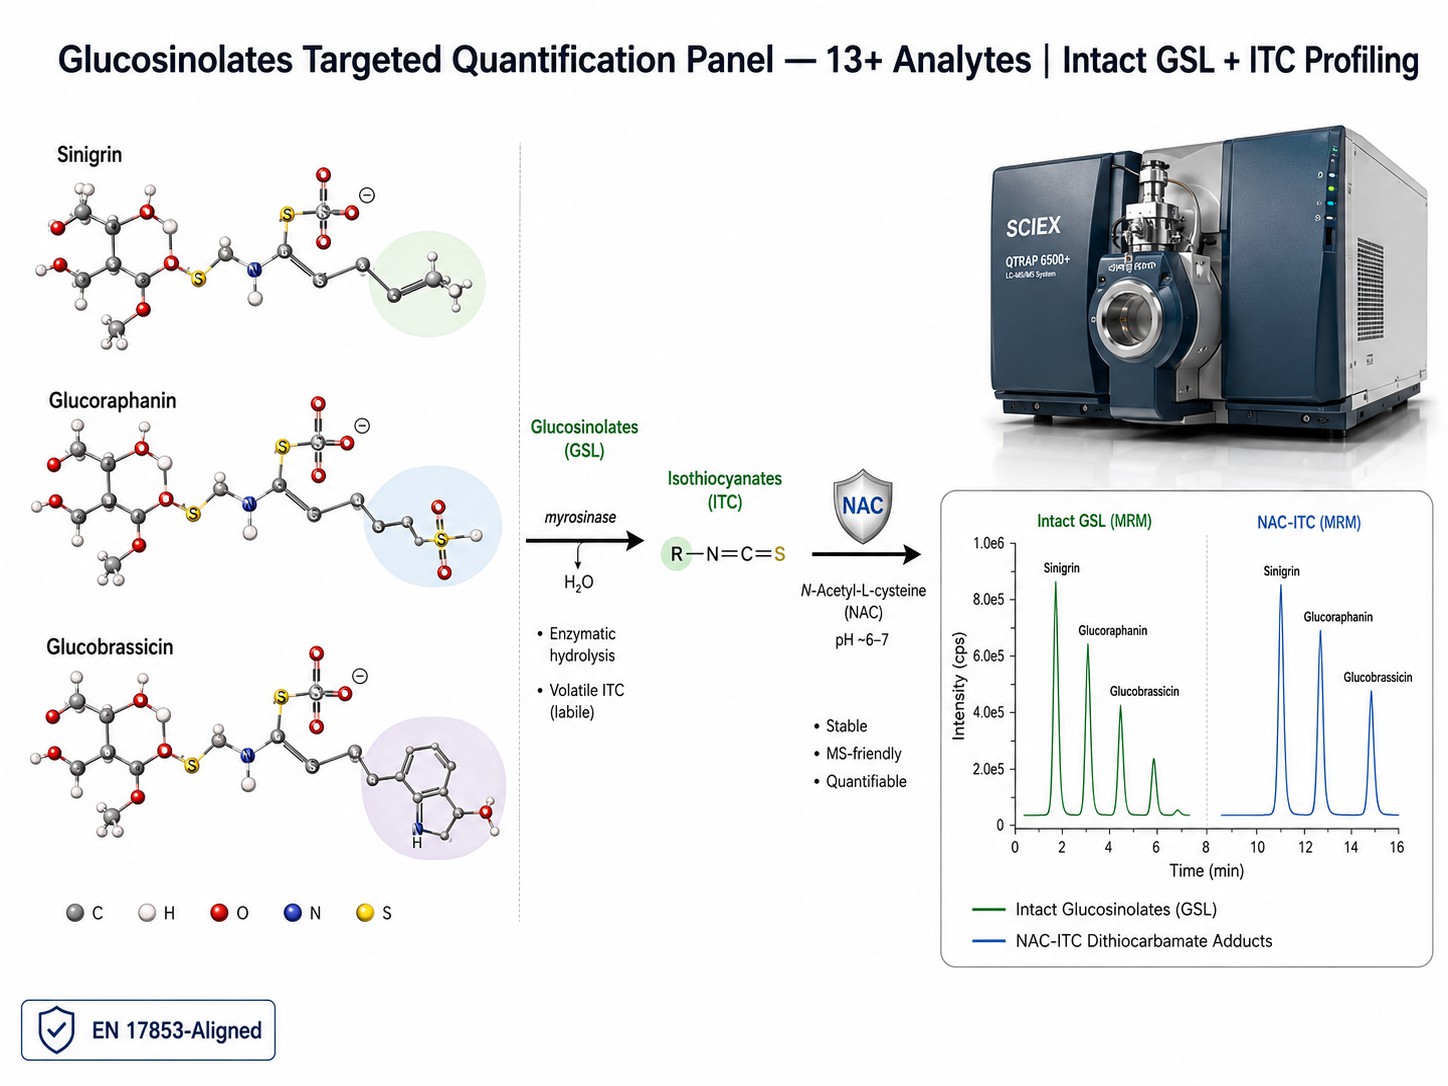
Glucosinolates are β-thioglucoside N-hydroxysulfates with a variable side chain (R-group) that determines
their biological activity. Over 130 GSLs have been identified across Brassicaceae species. Upon tissue
disruption — harvesting, chewing, or processing — the enzyme myrosinase hydrolyzes GSLs into
isothiocyanates, nitriles, and other bioactive degradation products that mediate plant defense, human health
effects, and food flavor profiles. The specific profile of GSLs and ITCs in a sample reflects genotype,
tissue type, developmental stage, and environmental conditions — but capturing this profile quantitatively
requires a method designed for both compound classes simultaneously.
Targeted glucosinolate panel metabolomics via LC–MS/MS provides the most reliable approach for accurate GSL
and ITC quantification. It enables you to:
- Isomer-resolved separation across all three GSL structural classes — distinguishing
glucoiberin from glucoibervirin, which differ by a single methylene group but have distinct biological
activities.
- Simultaneous ITC detection — including sulforaphane, allyl-ITC, benzyl-ITC, and phenethyl-ITC —
in the same analytical run, without separate sample preparation or instrument time.
- Absolute quantification across genotypes, tissues, developmental stages, and dietary
interventions — delivering concentration data (nmol/g or μmol/g), not relative peak areas.
What Problem Do We Solve?
Myrosinase-mediated degradation, fragmented GSL-ITC workflows, and unreliable surrogate calibration make it
difficult to get complete, trustworthy glucosinolate data from generic metabolomics services. Creative
Proteomics resolves these with a targeted service that is:
- Myrosinase-inhibited: Cold methanol/water extraction (4°C, 70% MeOH) with liquid
nitrogen snap-freezing denatures myrosinase before it can act — preserving the in vivo GSL profile, not
sample handling artifacts.
- GSL + ITC simultaneous: Single-injection NAC-derivatization captures intact GSLs and
bioactive ITC hydrolysis products in one run — no separate workflows, no doubled sample consumption.
- Per-analyte calibrated — not surrogate: Surrogate GSL calibration — using a single
calibrant for all analytes — produces unreliable results because ionization efficiency varies
significantly even among structurally similar GSLs. We use isotopically labeled internal standards and
multi-point curves for each target analyte, aligned with EN 17853:2023.
Glucosinolate Detection Panel — Analyte Coverage by Chemical Class
Creative Proteomics offers a targeted LC–MS/MS panel covering glucosinolates across three structural
classes and their key ITC hydrolysis products. The panel can be deployed as a standard configuration or
customized to your specific analyte list, matrix, and throughput needs. Each analyte is quantified against
its own multi-point calibration curve with isotopically labeled internal standards — not surrogate
calibration.
Standard Glucosinolate Coverage
| GSL Class |
Representative Analytes |
Typical Source Plants |
| Aliphatic (methionine-derived) |
Glucoraphanin,
Sinigrin, Progoitrin, Glucoiberin,
Glucoerucin, Gluconapin, Glucoalyssin, Glucoibervirin |
Broccoli, Brussels sprouts, mustard, canola |
| Indole (tryptophan-derived) |
Glucobrassicin, 4-Hydroxyglucobrassicin, 4-Methoxyglucobrassicin, Neoglucobrassicin,
1-Hydroxyglucobrassicin |
Broccoli, Arabidopsis, cabbage, kale |
| Aromatic (phenylalanine-derived) |
Gluconasturtiin (2-phenylethyl GSL) |
Watercress, horseradish |
Isothiocyanate Hydrolysis Products
| ITC Product |
Precursor GSL |
Biological Relevance |
| Sulforaphane |
Glucoraphanin |
NRF2 activation, anti-cancer research, phase II enzyme induction |
| Allyl isothiocyanate |
Sinigrin |
Antimicrobial activity, pungent flavor compound, TRPA1 channel activation |
| Benzyl isothiocyanate |
Glucotropaeolin |
Anti-proliferative activity, apoptosis induction |
| Phenethyl isothiocyanate |
Gluconasturtiin |
Chemopreventive studies, CYP enzyme modulation |
The analyte list is continuously expanding. Contact us for custom panel requests including rare GSLs (e.g., glucoselenoerucin in selenium-treated plants), sinalbin, methyl glucosinolate, or additional ITC time-course monitoring.
Why Choose Our Glucosinolates Analysis Service?
- Simultaneous GSL + ITC Detection in One Run
Our panel captures both intact glucosinolates and their biologically active isothiocyanate hydrolysis products in a single LC-MS/MS acquisition — using NAC derivatization to capture volatile ITCs as stable, ionizable adducts alongside intact GSLs in a single injection. You receive the complete metabolic picture: what GSLs are present, at what concentrations, and what ITCs they produce — without running two separate workflows.
-
EN 17853-Aligned Method with Published Validation Lineage
Our protocol follows the framework of EN 17853:2023, the European standard for intact glucosinolate determination by HPLC-MS/MS, validated across 8 matrix types and 21 individual GSLs in an interlaboratory collaborative trial. Documented method performance: calibration linearity R² ≥ 0.994, intraday/interday precision ≤15% RSD, and recovery 80–110%.
- Per-Analyte Calibration — Not Surrogate Quantification
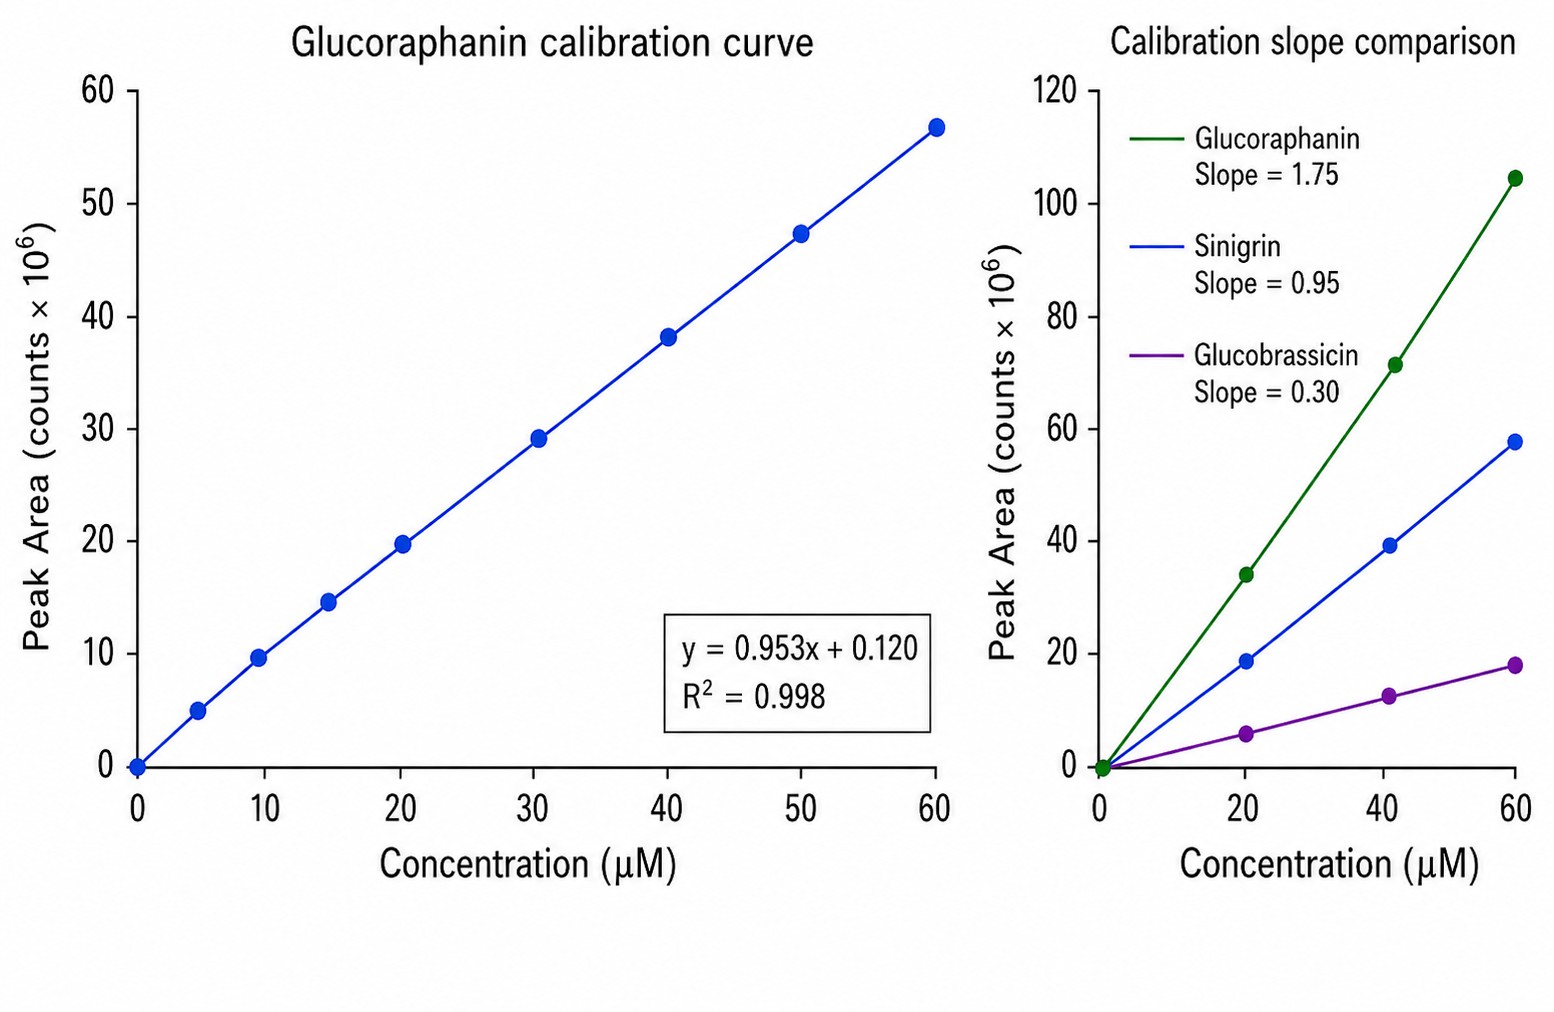
Using a single GSL as a surrogate calibrant for all analytes produces unreliable results — ionization efficiency varies significantly even among structurally similar GSLs. We use isotopically labeled internal standards and multi-point calibration curves for each target analyte, so your glucoraphanin data is calibrated against a glucoraphanin standard curve, not estimated from a sinigrin curve.
- Complete GSL Class Coverage with Isomer Resolution
Aliphatic, indole, and aromatic GSLs are separated at baseline or near-baseline — enabling distinction of isomers like glucoiberin vs. glucoibervirin that differ by a single methylene group. This resolution is critical for plant biologists studying GSL pathway regulation and for food scientists evaluating dietary GSL exposure by class.
- Professional Data Package with Methods Appendix
Every delivery includes quantitative tables (.xlsx), QC metrics summary, calibration documentation, raw data files (.wiff/.mzML), and a methods appendix — extraction protocol, LC gradient, MRM transitions, MS parameters — fully documented for traceability and reproducibility. We do not deliver a black-box peak list.
Method Comparison: Why LC-MS/MS for Glucosinolate Analysis
Researchers have three options for glucosinolate analysis — but only one delivers absolute quantification
of both intact GSLs and their bioactive ITC hydrolysis products in a single run. The table below compares
the key differences.
| Dimension |
Targeted LC-MS/MS Panel |
Traditional Desulfation-GC / UPLC-UV (ISO 9167) |
Generic Untargeted Metabolomics |
| What is measured |
Intact GSLs (no desulfation) + ITC hydrolysis products simultaneously |
Desulfo-GSL derivatives only; ITCs not detected |
Features tentatively annotated as GSLs based on m/z; no ITC detection |
| Quantification |
Absolute (nmol/g or μmol/g) with per-analyte isotope-labeled internal standards |
Relative to a single calibrant (sinigrin equivalents); no internal standard per analyte |
Relative peak area; no absolute concentration |
| Isomer resolution |
Yes — baseline or near-baseline separation by MRM transitions |
Partial — co-elution of desulfo-derivatives is common |
No — isobaric GSLs annotated as a single feature |
| Regulatory alignment |
Aligned with EN 17853:2023 (EU standard for intact GSL by HPLC-MS/MS) |
Aligned with ISO 9167:2019 (desulfation-HPLC-UV) |
None — not a validated quantitative method |
| Sample prep time |
~2 h (cold extraction + NAC derivatization for ITCs) |
~4–6 h (requires overnight enzymatic desulfation on DEAE columns) |
~1 h (standard metabolite extraction) |
| Variability source |
Instrument-controlled (MRM acquisition, internal standard correction) |
Desulfation efficiency varies by GSL structure — introduces compound-specific bias |
Feature alignment, adduct formation, matrix effects — high run-to-run variability |
| Best for |
Studies requiring absolute GSL concentrations, ITC bioactivity data, publication-grade
quantification, and regulatory-comparable results |
Total GSL screening in breeding programs; labs with established ISO 9167 workflows |
Hypothesis generation; discovering novel GSL-like features in uncharacterized species |
| Typical throughput |
50–200 samples per batch with pooled QC |
20–50 samples per batch due to desulfation step |
50–100 samples per batch; less QC rigor |
If your research requires knowing not just which glucosinolates are present but their absolute concentrations — and the ITC products that actually mediate biological activity — targeted LC-MS/MS is the appropriate platform. If you are transitioning from a desulfation-based workflow, we can run a bridging study to demonstrate comparability between methods for your specific matrix and analytes of interest.
Instrumentation and Method Performance for Glucosinolate Quantification
Analytical Platform
LC–MS/MS (Primary Platform)
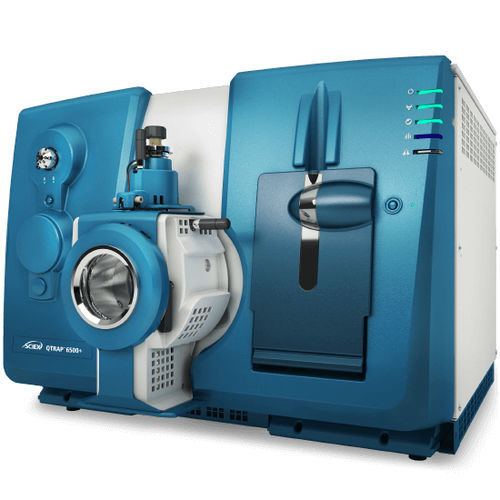
Mass Spectrometer: SCIEX QTRAP 4500/5500/6500 (Triple Quadrupole/Linear Ion Trap)
Ionization Mode: Electrospray Ionization (ESI), Negative Mode for GSLs and NAC-derivatized ITCs
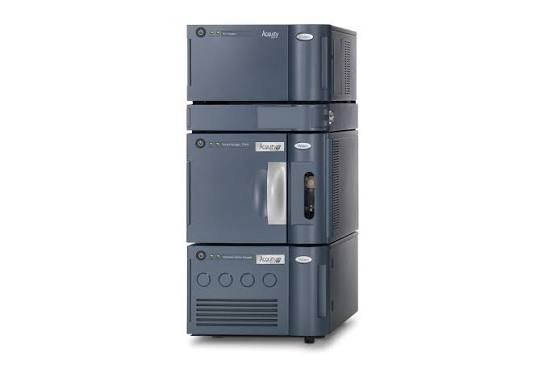
LC System: Waters ACQUITY UPLC with HSS T3 column (100 × 2.1 mm, 1.8 μm) for polar GSL retention
Acquisition: Scheduled MRM with polarity switching; group-specific m/z 96/97 sulfate fragment screen +
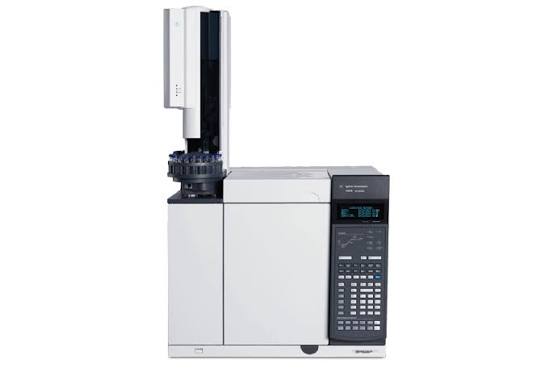
compound-specific transitions; NAC-ITC detection via characteristic m/z 162 fragment. Agilent
7890B-5977A GC-MS is available for confirmatory volatile ITC analysis or bridging studies for labs
transitioning from desulfation-GC workflows.
Method Performance
| Parameter |
Typical Range |
| Linearity (R²) |
≥ 0.994 (2–60 μM calibration range) |
| LOD / LOQ |
LOD: 0.4–2.6 μM; LOQ: 1.2–7.8 μM (intact GSLs); comparable for NAC-ITCs |
| Intraday Precision |
CV ≤ 15% for all analytes in qualified matrices |
| Interday Precision |
CV ≤ 15% for the majority of analytes |
| Recovery |
80–110% (spiked Brassicaceae extracts) |
| Regulatory Reference |
EN 17853:2023 (intact GSL by HPLC-MS/MS) |
Internal Standards and Calibration Strategy
- Internal Standards: Isotope-labeled GSL and ITC analogs (e.g., d₃-sinigrin,
¹³C-sulforaphane) spiked at extraction — one IS per analyte class, not a single surrogate for all
compounds.
- Calibration Strategy: 6–8 point standard curves per analyte; matrix-matched or
surrogate matrix with demonstrated parallelism. Per-analyte calibration is essential because ionization
efficiency varies significantly even among structurally similar GSLs — a single-surrogate approach
systematically misrepresents analyte concentrations.
- QC Monitoring: Pooled QC every 8 injections; LOESS signal drift correction applied;
Westgard multi-rule evaluation with 1₂s warning and 1₃s rejection; metabolite-level QC flags (RSD > 30%
flagged in report).
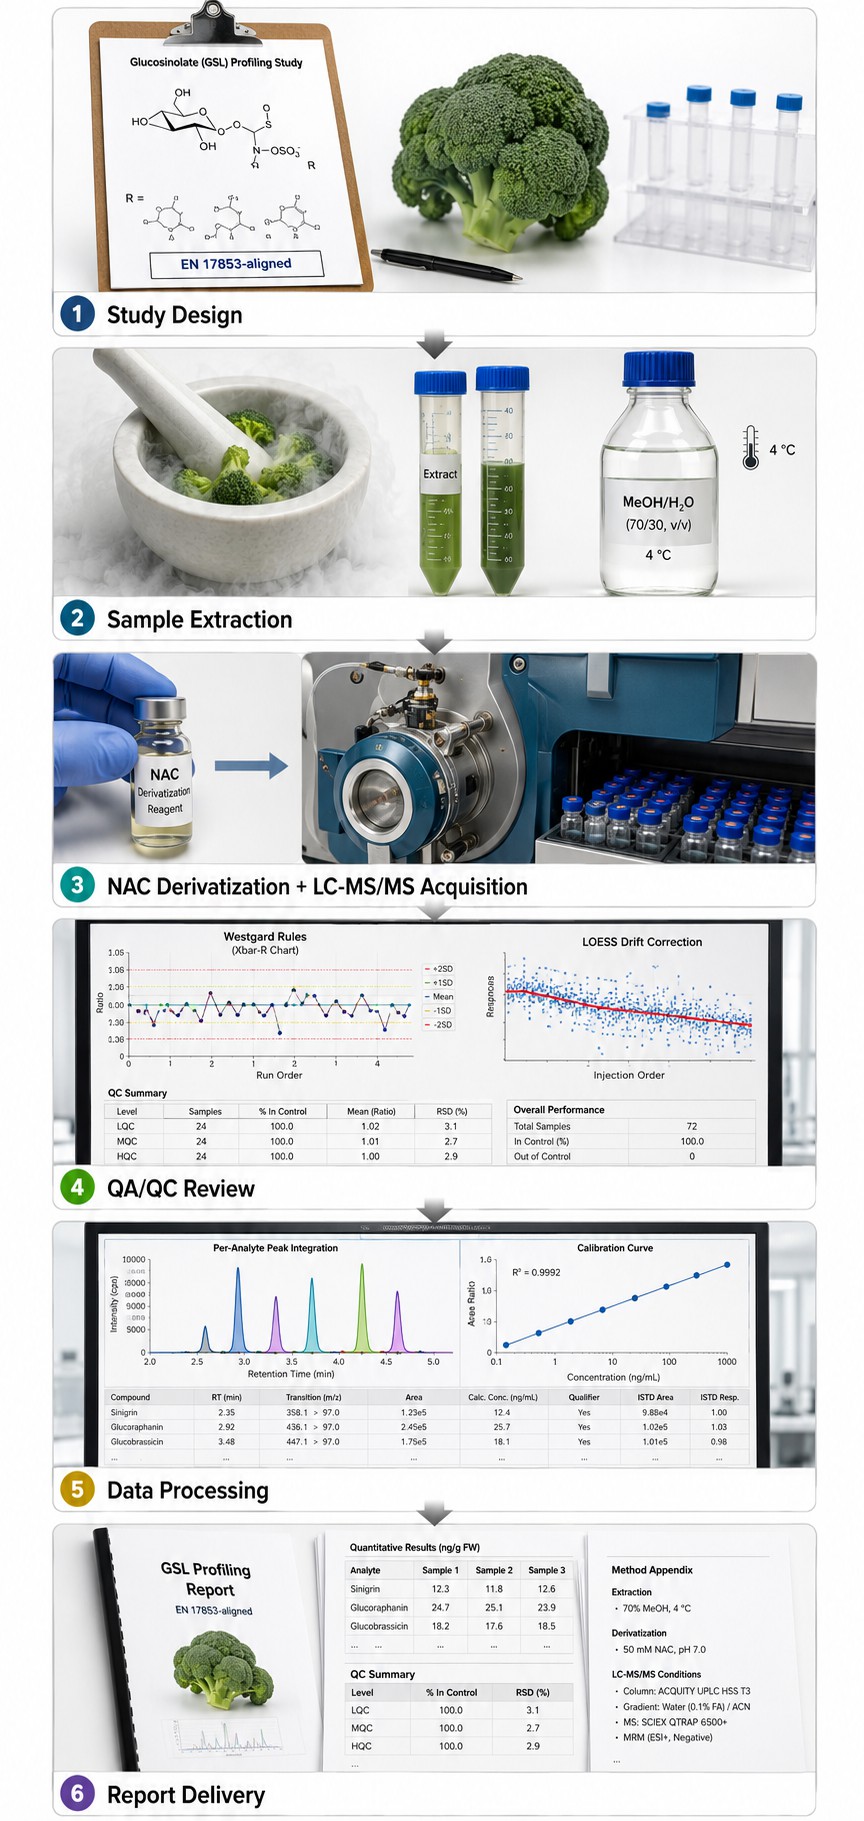
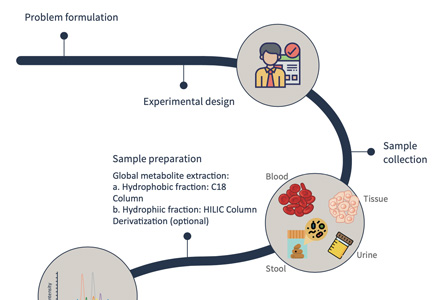
Glucosinolate Analysis Workflow — From Sample to Quantified Report
Sample Collection and Preparation Guidelines
| Sample Type |
Minimum Amount |
Preparation |
Storage and Shipping |
| Fresh leaf/floret tissue |
≥ 200 mg FW |
Snap-freeze in liquid N₂ immediately after harvest; record fresh weight |
−80°C; ship on dry ice |
| Seeds |
≥ 100 mg |
Collect mature, dry seeds; no additional preparation needed |
Room temperature or 4°C; ship with desiccant |
| Root tissue |
≥ 200 mg FW |
Wash briefly in cold water, blot dry, snap-freeze |
−80°C; ship on dry ice |
| Food products (processed) |
≥ 500 mg |
Homogenize; freeze-dry if high moisture; record processing history (cooking method, time,
temperature) |
−20°C or −80°C; ship on dry ice |
| Biofluids (plasma/serum) |
≥ 200 μL |
Centrifuge to remove particulates; aliquot to avoid freeze-thaw cycles |
−80°C; ship on dry ice |
Critical Note on Myrosinase:
- Myrosinase is active at room temperature and hydrolyzes GSLs within minutes of tissue disruption.
Samples intended for intact GSL profiling must be snap-frozen immediately after collection and maintained
at −80°C until extraction. The cold methanol/water (70:30 v/v, 4°C) extraction protocol denatures residual
myrosinase.
- For studies requiring ITC profiling of hydrolyzed samples, discuss the hydrolysis protocol during study
design: endogenous vs. exogenous myrosinase, pH, incubation time, and temperature all affect the ITC
profile. We can design a controlled hydrolysis protocol matched to your experimental conditions.
- Processed food samples (cooked, fermented, freeze-dried) typically have reduced or absent myrosinase
activity. We adjust extraction protocols based on your sample's processing history — no myrosinase
inhibition step is needed if the enzyme has already been thermally inactivated.
Deliverables: What You Receive from Glucosinolates Analysis
Quantitative Data Tables (.xlsx/.csv)
Absolute concentrations of each GSL and ITC (nmol/g FW or μmol/g DW), with standard deviation across replicates, LOD/LOQ per analyte, and metabolite-level QC flags (RSD > 30% flagged).
QA/QC Report
Blank evaluation, retention time windows, ion ratio confirmation, pooled QC RSD, LOESS-corrected batch trend plots, Westgard rule compliance summary with any flagged observations explained.
Calibration Documentation
Multi-point calibration curves for each analyte with equations, R² values, linear range, and internal standard recovery rates. Per-analyte — not surrogate.
Raw Data Files
Vendor-native (.wiff) and open formats (.mzML) upon request, with full acquisition method metadata including LC gradient profile, MRM transition table, and MS parameters.
Methods Appendix
Extraction protocol, LC gradient, MRM transitions, MS parameters, NAC derivatization details — fully documented for traceability and reproducibility.
Applications of Glucosinolate Profiling
Our glucosinolate analysis service supports researchers and developers across disciplines where GSL and ITC
data drive decisions:
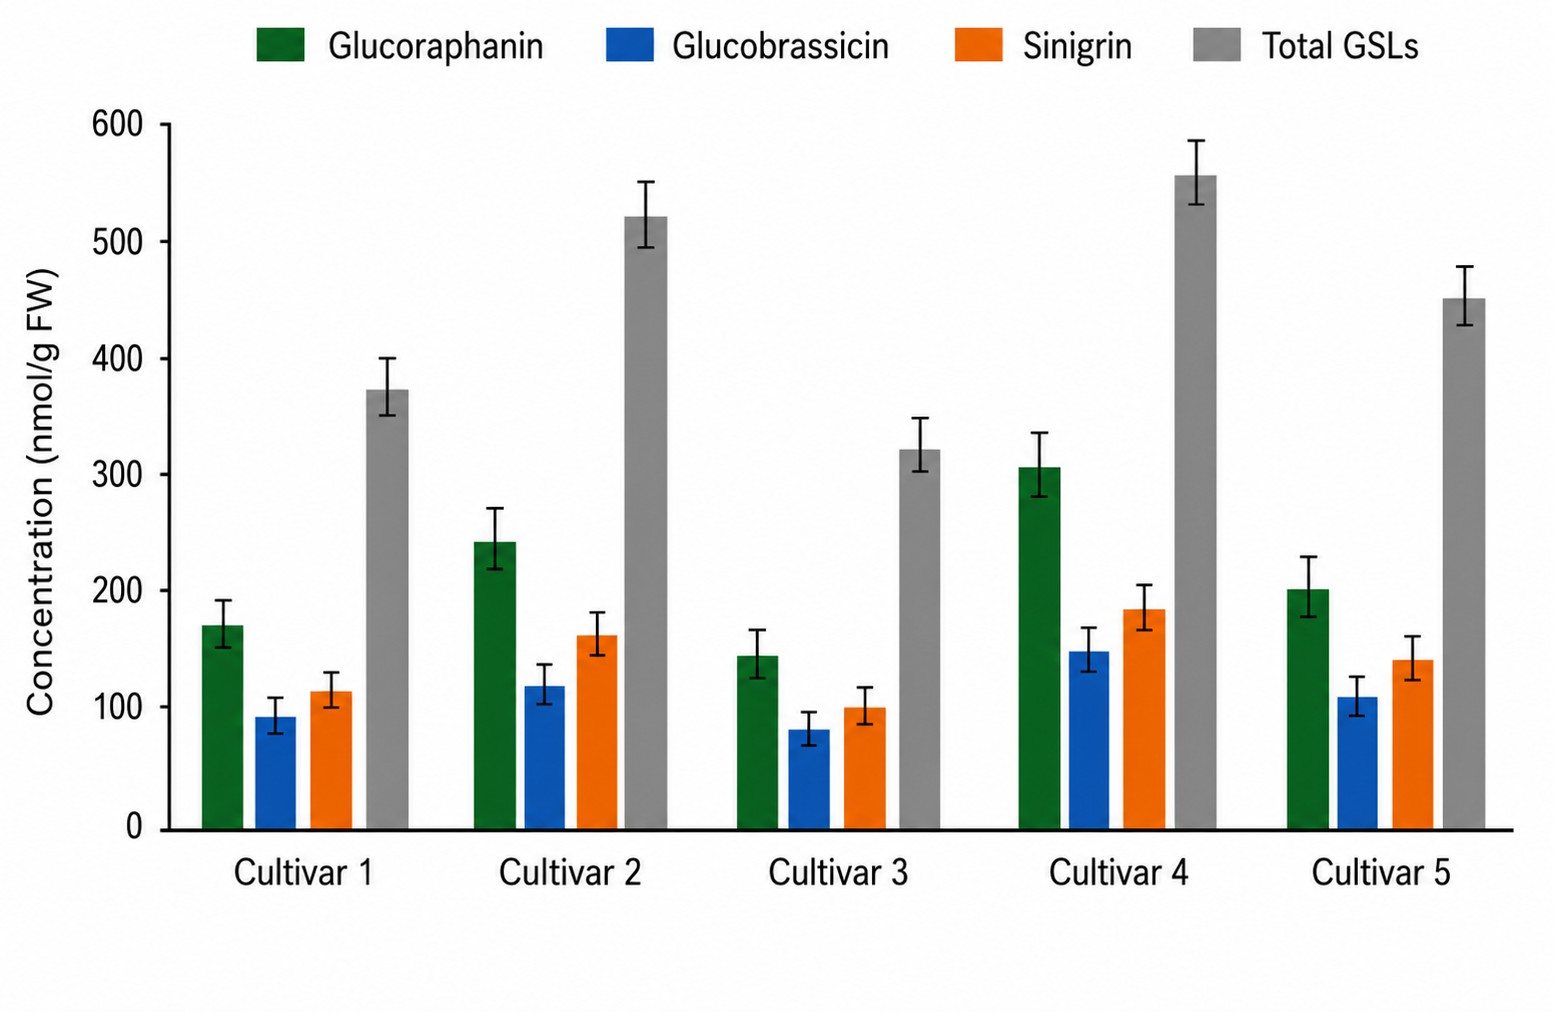
Case Study: Large-Scale Glucosinolate Profiling Across 191 Broccoli Genotypes
Quantification and Diversity Analyses of Glucosinolates in 191 Broccoli Genotypes Highlight Valuable Genetic Resources for Molecular Breeding
Yan, M., Song, C., Su, S., Li, J., Hu, Z., Lin, S., Zou, H., Tang, Z., and Yan, X. |
Agronomy, 2023, 13(12), 2928
DOI: 10.3390/agronomy13122928
Background
Broccoli is one of the richest dietary sources of glucoraphanin (GRA), the precursor to the anti-cancer
isothiocyanate sulforaphane. However, GSL content varies enormously across cultivars — from barely
detectable to over 5 mg/g dry weight — making genotype selection critical for both breeding programs and
nutrition research. Prior to this study, no systematic GSL profiling had been conducted across a large,
diverse broccoli germplasm collection.
Challenge: Characterize and quantify glucosinolate diversity across 191 broccoli genotypes
and multiple developmental organs to identify elite germplasm for molecular breeding of GRA-rich broccoli.
Note: The published study used a desulfation-UPLC-PDA method (ISO 9167-aligned). Our LC-MS/MS service provides the same analytical endpoint — per-analyte GSL concentration data — with two key advantages: (1) direct intact GSL measurement without the overnight desulfation step, and (2) simultaneous ITC hydrolysis product detection, which desulfation-based methods cannot provide. The genotype screening scale (191 cultivars), biological insight (34-fold GSL variation), and breeding decision support demonstrated in this study are directly relevant to the throughput and data quality our service delivers.
Key Findings
| Metric |
Value |
| Total GSL range across 191 genotypes |
0.17–5.82 mg/g DW (34-fold variation) |
| Glucoraphanin (GRA) range |
0.03–3.15 mg/g DW |
| Glucobrassicin (GBS) range |
0.01–1.58 mg/g DW |
| Aliphatic GSL proportion |
45.1% of total GSLs |
| Indole GSL proportion |
53.2% of total GSLs |
| Elite genotype (No. 300) total GSL |
5.82 mg/g DW — highest among all genotypes |
| Elite genotype (No. 300) GRA |
3.15 mg/g DW — highest GRA concentration |
| Genotype No. 300 floret diameter |
13.4 cm — large, commercially viable head size |
| Genotype No. 300 growth cycle |
11 days — short, suitable for breeding programs |
What This Means for Your Glucosinolate Research
- Genotype screening at scale is essential. The 34-fold variation means choosing the
right genotype is the single largest determinant of your analytical results. Our panel quantifies GSLs
across the full 0.17–5.82 mg/g DW range — whether you are screening 10 cultivars or 200.
- Aliphatic and indole GSLs require separate calibration. Together they accounted for
98.3% of total GSLs but differ in chemical properties and ionization efficiency. Our per-analyte
calibration strategy ensures accurate quantification across both groups — unlike single-surrogate methods
that force all GSLs onto one calibration curve.
- Organ-level profiling reveals hidden GSL diversity. Seedling roots had the highest GSL
diversity; florets had the highest GRA concentrations. If your research spans multiple tissues, our panel
accommodates organ-specific extraction protocols optimized for each matrix.
- Breeding programs need high-throughput, quantitative GSL data. The 191-genotype screen
demonstrates the throughput we can support. Our scheduled MRM workflow scales from 10 to 200 cultivars
without compromising per-analyte quantification quality or QC rigor.
Conclusion
This study underscores why targeted, quantitative glucosinolate profiling — not generic metabolomics — is
the right tool for plant breeding, food science, and nutrition research. Broad analyte coverage, validated
calibration, and scalable throughput enable genotype selection and mechanism studies that are impossible
with qualitative or semi-quantitative approaches. Our LC-MS/MS service delivers this same analytical rigor
with the added capability of simultaneous ITC detection — giving you not just what GSLs are present, but
what bioactive ITCs they produce.
Read the full paper: Yan et al., Agronomy, 2023
Simultaneous Analysis of Glucosinolates and Isothiocyanates by Reversed-Phase Ultra-High-Performance Liquid Chromatography–Electron Spray Ionization–Tandem Mass Spectrometry
Andini, S., Araya-Cloutier, C., Sanders, M., and Vincken, J.-P.
Journal: Journal of Agricultural and Food Chemistry, 2020, 68(10), 3121–3131
Core method reference. Validated RP-UHPLC-ESI-MS/MS framework for simultaneous GSL and ITC (as NAC
derivatives) analysis. 14 GSLs + 15 ITCs, LOD 0.4–2.6 μM, intraday precision ≤10% RSD, recovery 71–110%.
PMC Free
Article
Quantification and Diversity Analyses of Glucosinolates in 191 Broccoli Genotypes Highlight Valuable Genetic Resources for Molecular Breeding
Yan, M., Song, C., Su, S., Li, J., Hu, Z., Lin, S., Zou, H., Tang, Z., and Yan, X.
Journal: Agronomy, 2023, 13(12), 2928
Case study reference. Systematic GSL profiling across 191 broccoli genotypes revealing 34-fold variation
in total GSL content (0.17–5.82 mg/g DW).
EN 17853:2023 — Animal Feeding Stuffs: Determination of Intact Glucosinolates in Feed Materials and Compound Feed by LC-MS/MS
CEN/TC 327
Publisher: European Committee for Standardization (CEN), 2023
European standard for intact GSL quantification by HPLC-MS/MS. Validated across 8 matrix types (rapeseed,
camelina, Brassica seeds, compound feeds) in interlaboratory collaborative trial. 21 individual GSLs
quantified. Regulatory reference for LC-MS/MS-based GSL analysis.





 Contact Us



