Why NAD Analysis Matters for Your Research
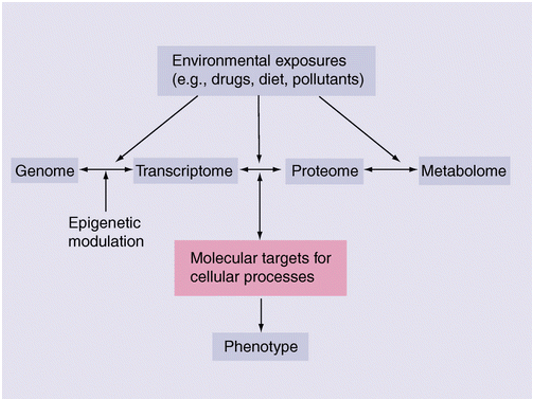
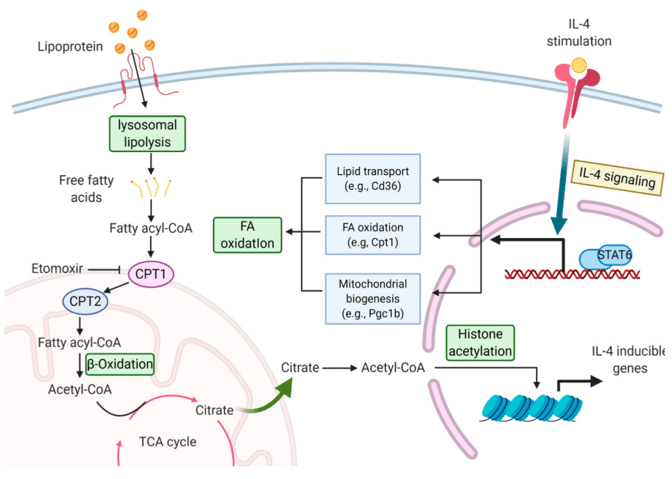
Nicotinamide adenine dinucleotide (NAD) is a central coenzyme in cellular energy metabolism, redox reactions, and signaling pathways. Acting as a key electron carrier in glycolysis, the TCA cycle, and oxidative phosphorylation, NAD is essential for maintaining metabolic homeostasis. Beyond energy transfer, NAD serves as a substrate for sirtuins, PARPs, and CD38—enzymes critical for DNA repair, aging, and stress response.
Accurate quantification of NAD and its derivatives (NAD⁺, NADH, NADP⁺, NADPH) provides deep insights into cellular bioenergetics, oxidative stress, and disease-related metabolic reprogramming. Whether you are studying mitochondrial function, developing metabolic drugs, or exploring aging mechanisms, precise NAD profiling is indispensable.
Comprehensive NAD Analysis Services by Creative Proteomics
Our NAD analysis platform provides targeted and comprehensive metabolite quantification across multiple research applications:
- Absolute Quantification of NAD Species
LC-MS/MS-based accurate measurement of NAD⁺, NADH, NADP⁺, and NADPH with isotope-labeled internal standards.
- Redox State Assessment
Calculation of NAD⁺/NADH and NADP⁺/NADPH ratios to evaluate cellular oxidative stress and metabolic balance.
- Expanded Coenzyme Profiling
Analysis of related nicotinamide metabolites and precursors (e.g., NMN, NR) for pathway interpretation.
- Integrated Metabolomics Options
Combine NAD analysis with energy metabolism panels, TCA cycle intermediates, or redox-related pathways.
- Custom Experimental Design
Flexible workflows tailored to your sample type, matrix complexity, and research objectives.
List of NAD-Related Metabolites Detected
Below is the comprehensive list of detectable compounds included in our NAD analysis service:
| Category |
Analyte |
| Core NAD Species |
NAD⁺ (oxidized nicotinamide adenine dinucleotide) |
| NADH (reduced nicotinamide adenine dinucleotide) |
| NADP⁺ (oxidized nicotinamide adenine dinucleotide phosphate) |
| NADPH (reduced nicotinamide adenine dinucleotide phosphate) |
| Precursors & Intermediates |
Nicotinamide (NAM) |
| Nicotinic acid (NA) |
| Nicotinamide riboside (NR) |
| Nicotinamide mononucleotide (NMN) |
| Nicotinic acid mononucleotide (NaMN) |
| Degradation Products |
ADP-ribose |
| Cyclic ADP-ribose |
Detection can be extended to additional NAD salvage pathway metabolites upon request.
Why Choose Our NAD Analysis Service: Key Advantages
- Ultra-Sensitive Detection: LOD down to 10 fmol per injection, ideal for low-abundance samples.
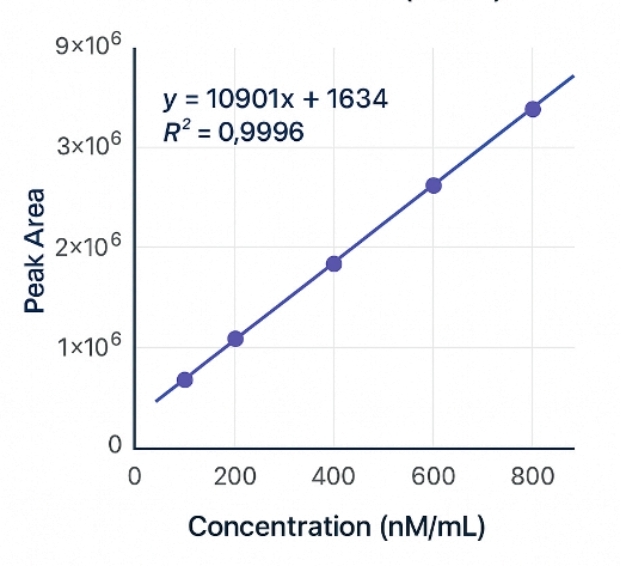
- High Quantitative Accuracy: Calibration curve R² ≥ 0.995; CV < 10% for replicate assays.
- Wide Dynamic Range: Covers 5–6 orders of magnitude for diverse biological matrices.
- Isotope-Labeled Internal Standards: Guarantees absolute quantification and recovery correction.
- Broad Matrix Compatibility: Plasma, serum, tissue homogenates, cell lysates, fermentation broth.
- Integrated Data Analysis: Includes statistical evaluation, redox ratio visualization, and KEGG pathway mapping.
NAD Assay Technical Details & Coverage
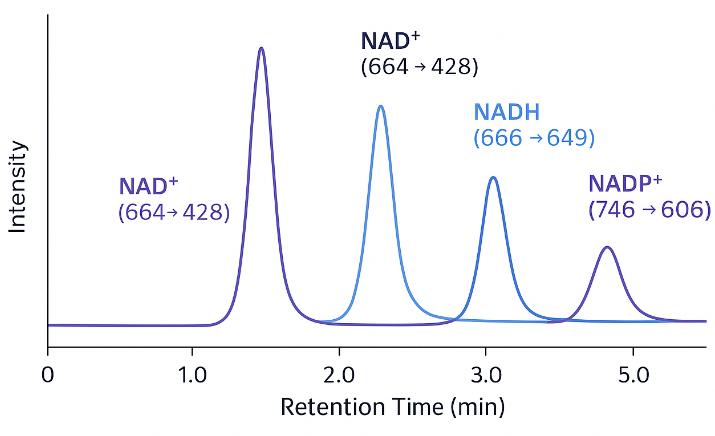
We employ triple-quadrupole LC-MS/MS platforms—including SCIEX QTRAP® 6500+, Thermo TSQ Altis, and Waters Xevo TQ-S—combined with Multiple Reaction Monitoring (MRM) to achieve femtomole-level detection of NAD metabolites. Samples are separated on Vanquish UHPLC systems with reverse-phase C18 columns, providing <10-minute run times and high-resolution chromatographic performance.
Key features of our method:
- Instrumentation: Triple quadrupole MS + UHPLC
- Ionization: Positive ESI mode
- Quantification: Absolute, using isotope-labeled internal standards
- Typical Transitions: NAD⁺ (m/z 664 → 428), NADH (m/z 666 → 648)
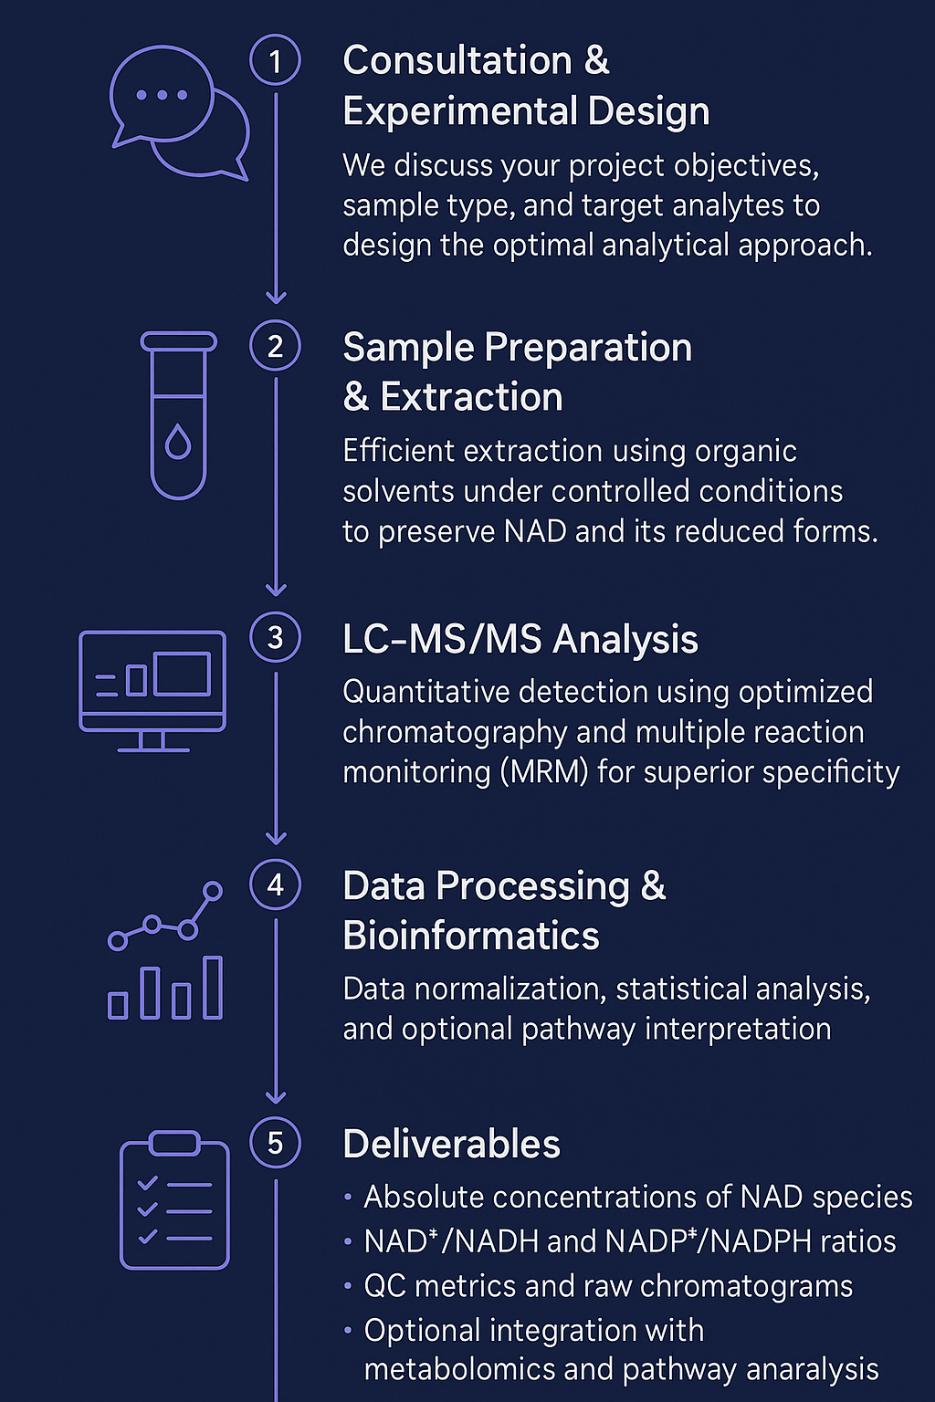
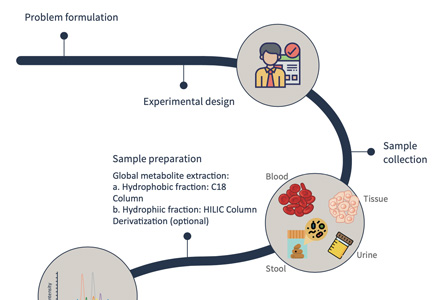
Step-by-Step Workflow for NAD Analysis
How to Prepare Your Samples for NAD Quantification
| Sample Type |
Minimum Amount |
Container |
Storage Conditions |
Notes |
| Plasma / Serum |
≥ 200 µL |
Cryovials (no glass) |
-80°C, avoid freeze–thaw cycles |
Use EDTA or heparin; avoid hemolysis |
| Tissue |
≥ 50 mg |
Cryovials |
Snap-frozen in liquid nitrogen; -80°C |
Rinse in PBS; remove blood contamination |
| Cultured Cells |
≥ 1 × 10⁶ cells |
Microcentrifuge tubes |
-80°C, after PBS wash |
Provide cell count and treatment info |
| Urine / Other Fluids |
≥ 500 µL |
Cryovials |
-80°C, aliquoted |
Contact us for validation |
Additional Guidelines
- Avoid preservatives and stabilizers that may interfere with LC-MS/MS analysis.
- Ship samples on dry ice; ensure leak-proof packaging.
- For custom matrices or limited samples, consult our technical team for tailored preparation instructions
Key Applications of NAD Analysis for Advanced Metabolism and Redox Research
Deliverables: What You Get from Our NAD Analysis Service
Our NAD analysis service provides comprehensive, publication-ready data packages to ensure your research outcomes are scientifically robust and ready for downstream interpretation.
Raw and Processed Data
- Original LC-MS/MS raw files (vendor format and mzML)
- Processed peak area tables with isotope-labeled internal standard correction
Quantitative Results
- Absolute concentrations of NAD⁺, NADH, NADP⁺, and NADPH in your samples
- Calculated redox ratios: NAD⁺/NADH and NADP⁺/NADPH
- Statistical outputs including mean, SD, and CV%
Quality Control Report
- Calibration curves with R² ≥ 0.995 for absolute quantification
- Validation of LOD/LOQ and recovery
- Technical reproducibility (CV ≤ 10%) and QC sample performance
Data Interpretation and Visualization
- Pathway mapping (KEGG-based) for NAD-related metabolism
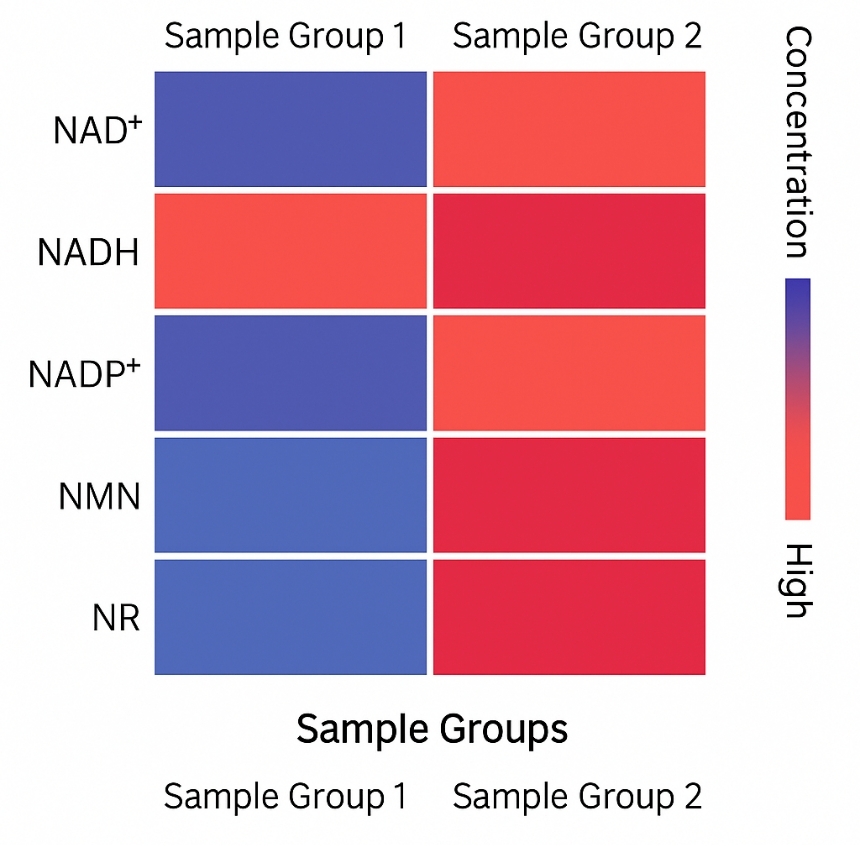
- Optional PCA plots and heatmaps for group comparisons
- Custom statistical analysis upon request
All deliverables are provided in editable formats (Excel, PDF) and include both raw data and interpretative summaries.
Theacrine-Based Supplementation Improves Lipid Profiles and Maintains Cellular NAD+/NADH Status in Middle-Aged Adults
Background
Aging is strongly associated with dyslipidemia, reduced mitochondrial function, and declining nicotinamide adenine dinucleotide (NAD+) levels—key drivers of metabolic dysfunction and chronic inflammation. Researchers aimed to evaluate whether NAD3®, a theacrine-based supplement combining Wasabia japonica (isothiocyanates), theacrine, and cuprous niacin chelate, could improve serum lipid profiles and modulate NAD+ metabolism in peripheral blood mononuclear cells (PBMCs) over a 12-week intervention in middle-aged adults.
Challenge
The clinical team required:
- Accurate quantification of NAD+ metabolites in PBMCs to detect subtle cellular changes in redox balance.
- Reliable lipid panel analysis to measure total cholesterol, LDL, HDL, and triglycerides under fasting conditions.
- A robust method capable of detecting NAD+/NADH ratios with high sensitivity and reproducibility, despite limited PBMC sample yield.
Our Solution
Creative Proteomics provided targeted NAD+ metabolomics using LC-MS/MS (multiple reaction monitoring) with isotope-labeled internal standards for absolute quantification. Our approach included:
- Metabolite panel: NAD+, NADH, NAAD, and calculation of NAD+/NADH ratio.
- High-resolution chromatography: Waters Acquity UPLC with a reversed-phase C18 column.
- Precision mass spectrometry: Sciex QTRAP 6500 Plus, ensuring low detection limits (0.0025–40 nM range).
- Normalization using protein assays for PBMC lysates to enhance data comparability.
- Integration with serum lipid measurements for comprehensive interpretation.
Results & Findings
After 12 weeks:
- Serum Lipids:
- Total cholesterol ↓ 11.1%
- LDL cholesterol ↓ 15.2%
- LDL:HDL ratio ↓ 18.9% (All p < 0.05 vs. baseline)
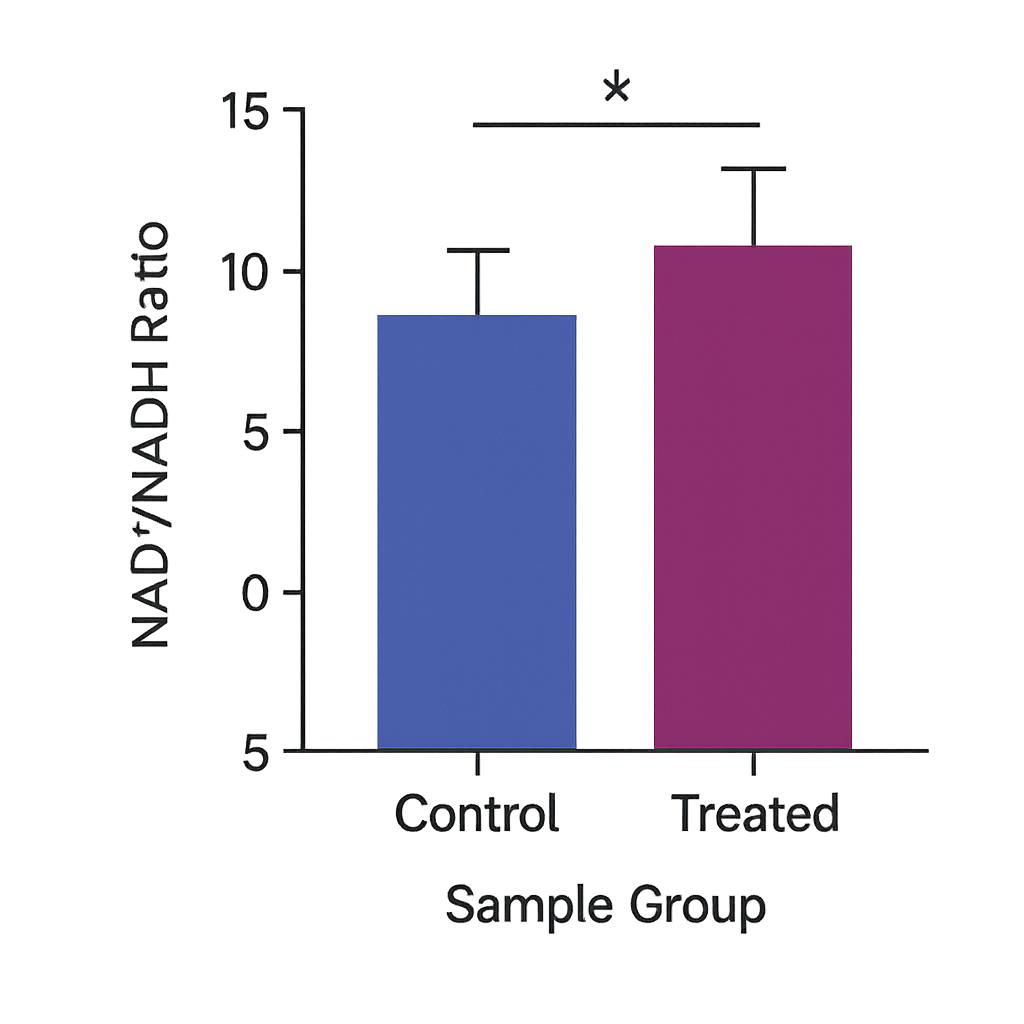
- Cellular NAD+/NADH Ratio: Maintained in NAD3® group (+35%) versus decline in placebo group (−34%), p = 0.023 at Post.
- No significant changes in body weight, blood pressure, or clinical safety markers.
These data suggest NAD3® supplementation favorably impacts lipid metabolism and preserves cellular redox homeostasis, both critical hallmarks of healthy aging.
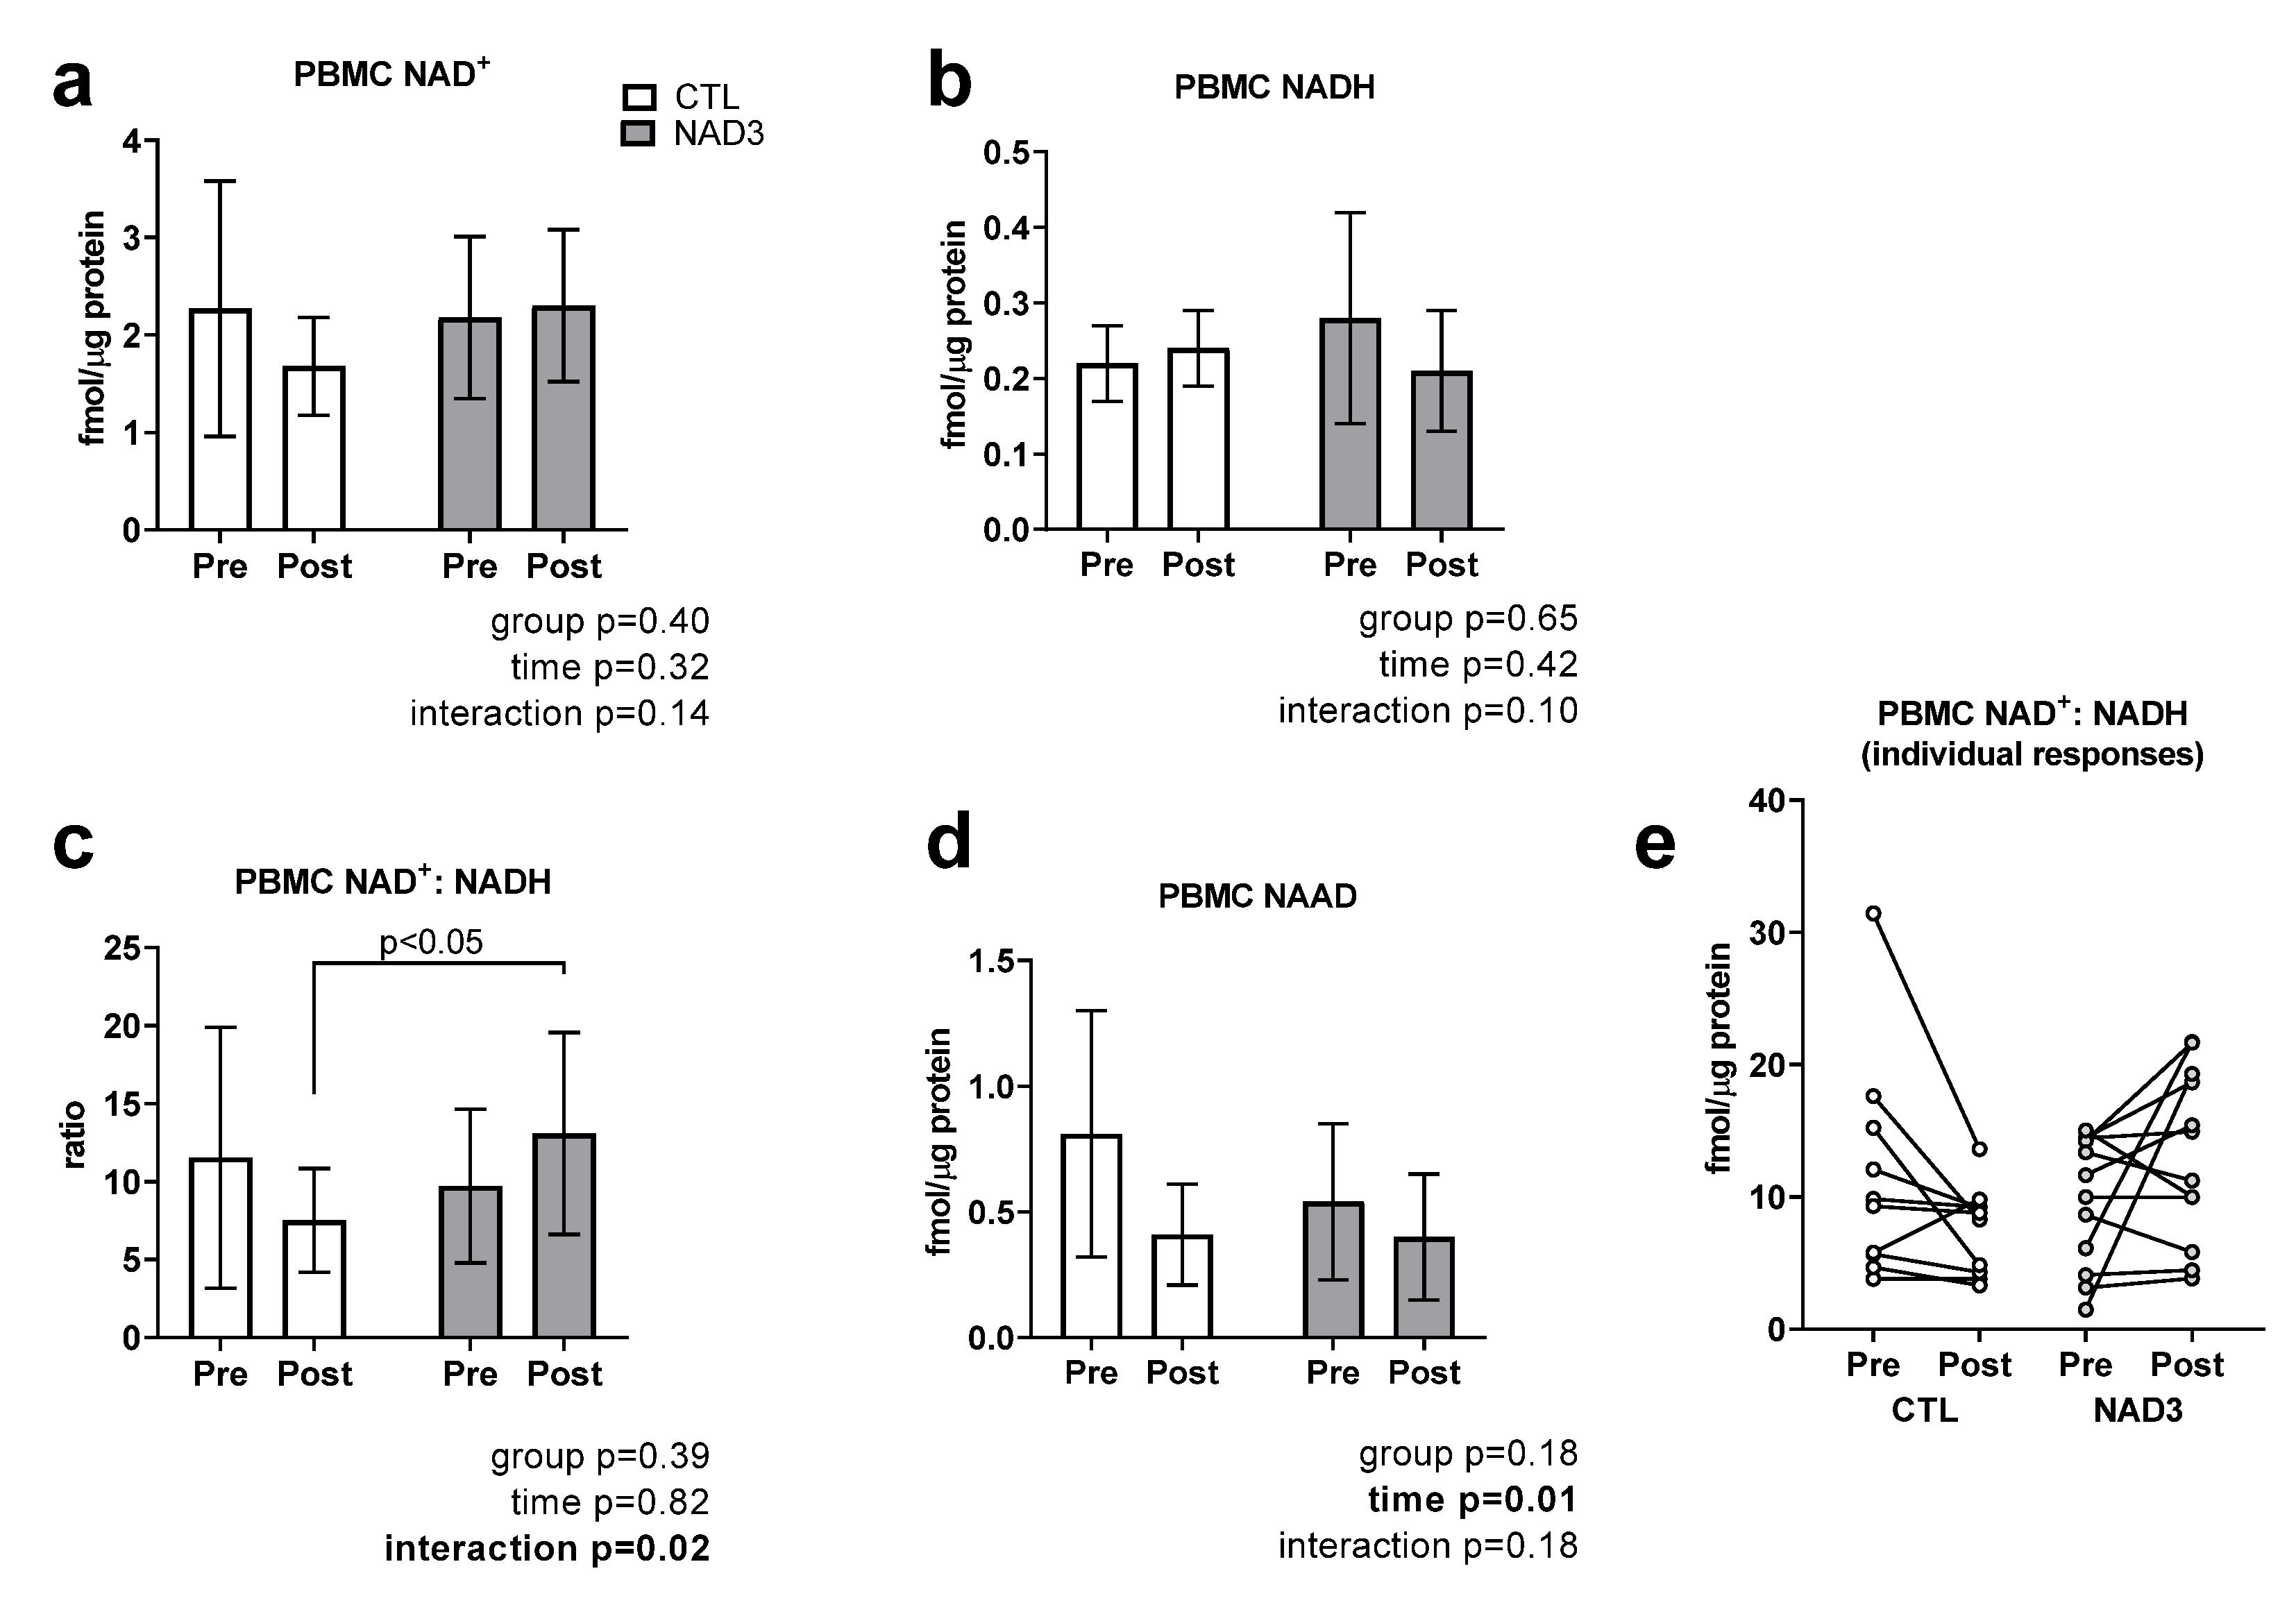 Targeted NAD+ metabolome data. Data are presented as means ± standard deviation values for 15 CTL and 13 NAD3 participants.
Reference
- Roberts, Michael D., et al. "Enhance Trial: Effects of NAD3® on Hallmarks of Aging and Clinical Endpoints of Health in Middle Aged Adults: A Subset Analysis Focused on Blood Cell NAD+ Concentrations and Lipid Metabolism." Physiologia 2.1 (2022): 20–31.
Metabolites and Genes behind Cardiac Metabolic Remodeling in Mice with Type 1 Diabetes Mellitus
Kambis, Tyler N., Hamid R. Shahshahan, and Paras K. Mishra.
Journal: International Journal of Molecular Sciences
Year: 2022
DOI: https://doi.org/10.3390/ijms23031392
Enhance trial: effects of NAD3® on hallmarks of aging and clinical endpoints of health in middle aged adults: a subset analysis focused on blood cell NAD⁺ concentrations and lipid metabolism
Roberts, Michael D., et al.
Journal: Physiologia
Year: 2022
DOI: https://doi.org/10.3390/physiologia2010002
Inflammation primes the kidney for recovery by activating AZIN1 A-to-I editing
Heruye, S., Myslinski, J., Zeng, C., Zollman, A., Makino, S., Nanamatsu, A., ... & Hato, T.
Journal: bioRxiv
Year: 2023
DOI: https://doi.org/10.1101/2023.11.09.566426
Insulin resistance does not impair mechanical overload-stimulated glucose uptake, but does alter the metabolic fate of glucose in mouse muscle
Weyrauch, L. A., McMillin, S. L., & Witczak, C. A.
Journal: International Journal of Molecular Sciences
Year: 2020
DOI: https://doi.org/10.3390/ijms21134715