Why Metabolic Flux Analysis Matters: Resolving Pathway Kinetics Beyond Static Concentrations
Metabolite concentrations provide an instantaneous snapshot of cellular state, but static pool sizes cannot determine whether an observed change in abundance results from increased pathway synthesis, reduced consumption, altered branch-point partitioning, or compartmental exchange. Metabolic flux analysis (MFA) uses stable-isotope tracers (13C, 15N, 2H) to track the path and velocity of individual atoms through metabolic networks, directly calculating in vivo enzymatic reaction rates (fluxes).
We design MFA studies for researchers requiring quantitative evidence of pathway routing in mammalian cells, microbial fermentations, plant systems, and tissues. The service begins with the specific biological question: resolving glucose partitioning between glycolysis and the pentose phosphate pathway (PPP), glutamine anaplerosis into the TCA cycle, nitrogen assimilation, or metabolic adaptation to genetic knockouts and therapeutic interventions.
For broader pathway context beyond the stoichiometric model, our metabolic pathways analysis service provides complementary topological mapping without treating static enrichment as a substitute for tracer-derived flux measurements.
Comprehensive Metabolic Flux Analysis Services: From 13C-MFA to Dynamic Tracing
| Service Mode |
When It Is Appropriate |
Core Analytical Output |
| 13C Metabolic Flux Analysis |
Carbon skeleton routing through central carbon metabolism (glycolysis, PPP, TCA cycle), amino acid biosynthesis, lipid precursors, or engineered pathways. |
Natural-abundance-corrected MIDs, fitted net/exchange fluxes within defined networks, and statistical identifiability diagnostics. |
| 15N & Dual-Label Tracing |
Nitrogen assimilation, transamination networks, de novo nucleotide synthesis (purines/pyrimidines), urea cycle dynamics, or coupled C-N stoichiometric turnover. |
15N mass defect deconvolution, transamination exchange rates, and pathway-specific nitrogen allocation models. |
| Dynamic or INST-MFA |
Systems that do not achieve isotopic steady state (slow-growing cells, photosynthetic organisms, large nutrient storage pools). |
Time-course isotopologue trajectories, ODE kinetic model parameter estimation, and transient flux rates. |
| Non-Targeted Metabolic Flux Analysis |
Exploratory tracer investigations where untargeted route discovery and global pathway utilization are the primary objectives. |
Unbiased isotope incorporation profiling, broad metabolic pathway mapping, and quantitative MFA feasibility evaluation. |
We select the appropriate service modality after reviewing model system biology, tracer accessibility, medium formulation, sampling feasibility, and the specific flux nodes to be discriminated. Flux balance analysis (FBA), conventional extracellular rate measurement, and isotope-assisted MFA answer distinct biological questions; we define these analytical boundaries before final experimental execution.
Why Choose Creative Proteomics for Fluxomics Study Design
- Question-First Tracer Design: We identify the exact metabolic branch point, exchange reaction, or substrate contribution to be resolved, then configure position-specific or uniformly labeled tracers to ensure target fluxes are mathematically identifiable.
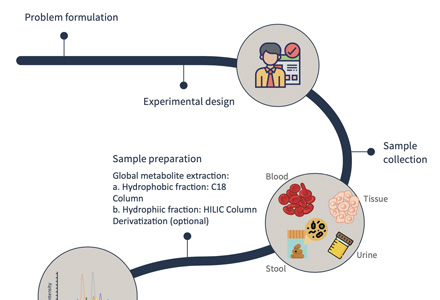
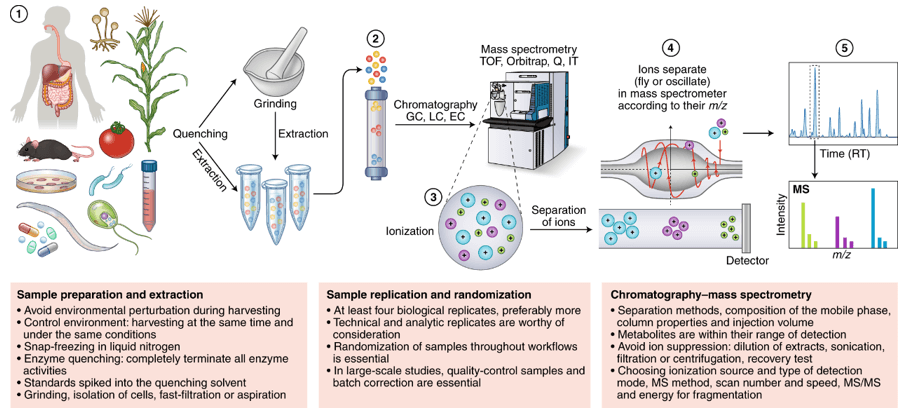
- Integrated Analytical Planning: Cryogenic quenching, extraction chemistry, chromatographic separation (HILIC, RP), and mass spectrometry acquisition are co-designed with the mathematical model to ensure acquired isotopologues support quantitative inference.
- Explicit Model Scope & Reversibility Constraints: Stoichiometric reactions, atom transitions, bidirectional exchange parameters, and normalization choices are fixed prior to regression, preventing visual pathway cartoons from being mistaken for validated flux models.
- Decision-Ready Comprehensive Reporting: Our data package distinctly separates measured spectral labeling evidence, model-derived estimates, non-linear uncertainty boundaries, and biological interpretation for publication assembly.
Our End-to-End Metabolic Flux Analysis Workflow
Tracer Selection Strategy and Computational Model-Fitting Guardrails
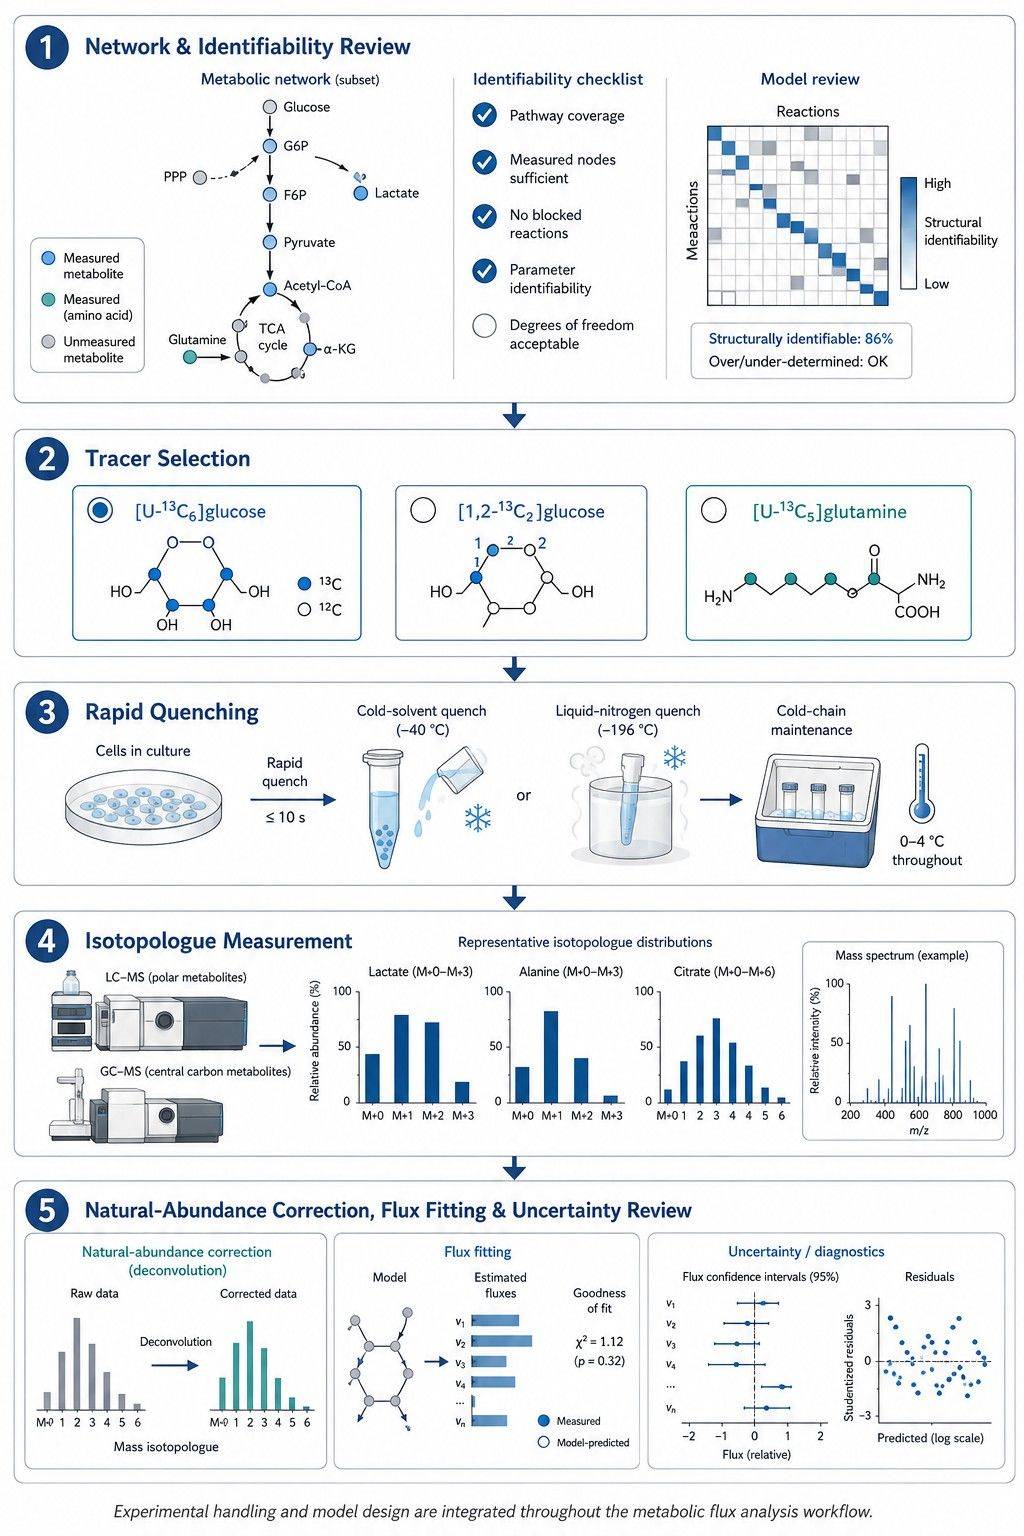
A stable isotope tracer is informative only when its labeled atoms generate distinct, measurable labeling patterns at the target pathway branch point. Uniformly labeled substrates provide broad pathway connectivity, whereas position-specific tracers are required to resolve parallel pathways and bidirectional exchange. We treat tracer selection and network modeling as a unified design problem.
| Research Question |
Illustrative Tracer Strategy |
Decision Logic & Analytical Readout |
| Glycolysis & Central TCA Entry |
[U-13C6]glucose |
M+3 pyruvate and lactate report direct glycolytic flux; M+2 citrate and downstream TCA intermediates indicate PDH-mediated acetyl-CoA entry, while M+3 malate/citrate captures PC anaplerosis. Extracellular glucose uptake and lactate secretion anchor absolute rates. |
| Glycolysis vs. Oxidative PPP Split |
[1,2-13C2]glucose |
Direct glycolysis yields M+2 lactate, whereas passage through the oxidative pentose phosphate pathway (G6PDH) decarboxylates carbon-1 as 13CO2, generating M+1 lactate. Natural abundance correction and network modeling quantify the oxPPP split ratio. |
| Oxidative vs. Reductive Glutamine Flux |
[U-13C5]glutamine |
Canonical forward oxidative TCA cycling produces M+4 alpha-ketoglutarate, succinate, and malate; IDH1/2-mediated reductive carboxylation generates M+5 citrate and M+3 malate fueling de novo lipogenesis. |
| Coupled Carbon & Nitrogen Routing |
Parallel 13C-glutamine + 15N-glutamine (or dual-labeled) |
13C carbon labeling tracks TCA cycle fueling, while 15N nitrogen labeling independently resolves transamination cascades and nucleotide synthesis, eliminating mathematical non-identifiability. |
Model-Fitting Guardrails
- State Assumptions are Rigorously Evaluated: Metabolic steady state and isotopic steady state are distinct conditions. When isotopic labeling is transient, time-resolved INST-MFA is applied rather than forcing a stationary model.
- Measured Inputs Constrain the Network: Tracer isotopic purity, medium composition, biomass formula, and quantitative uptake/secretion rates are incorporated as fixed model boundary conditions.
- Deconvolution Precedes Modeling: Algorithmic natural isotope abundance correction (IsoCor, AccuCor) accounts for background heavy isotopes and chemical derivatization atoms before regression.
- Parameter Identifiability is Reviewed: Poorly constrained reactions are flagged; network expansion is guided by identifiability analysis, recommending parallel labeling or additional time points where necessary.
- Multi-Parameter Statistical Diagnostics: Fit quality is evaluated via Chi-square (χ²) tests, sum of squared residuals (SSR), and non-linear 95% profile likelihood confidence intervals rather than single-metric approximations.
Across our MFA analytical platforms, high-resolution LC-Orbitrap MS resolves intact polar intermediates, nucleotides, amino acids, and cofactors at >140,000 FWHM, while GC-MS provides fragment-level positional constraints for derivatized central metabolites. For atom-resolved positional isotopomers or non-destructive tracking, our NMR-based metabolic flux analysis platform provides complementary orthogonal evidence.
| QC Layer |
Parameters Reviewed |
Impact on Flux Modeling |
| Analytical Identity |
Retention time stability (CV < 0.5%), accurate mass (< 1.5 ppm), peak symmetry, and isomer separation |
Ensures accurate metabolite identification before isotopologue deconvolution. |
| Blank & Carryover Control |
Extraction blanks, uncultured medium blanks, pooled QCs, and injection sequence monitoring |
Isolates biological intracellular labeling from reagent contamination and instrument carryover. |
| Isotopologue Integrity |
Signal-to-noise ratio, linear dynamic range, tracer purity, and natural abundance correction |
Prevents naturally occurring heavy isotopes from being misassigned as tracer-derived flux. |
| Model Readiness |
Replicate precision (CV ≤ 1.5%), measurement uncertainty, and boundary exchange rate coverage |
Determines which reaction fluxes are mathematically identifiable and guides model boundaries. |
Practical Quenching Protocols and Sample-Preparation Guidance
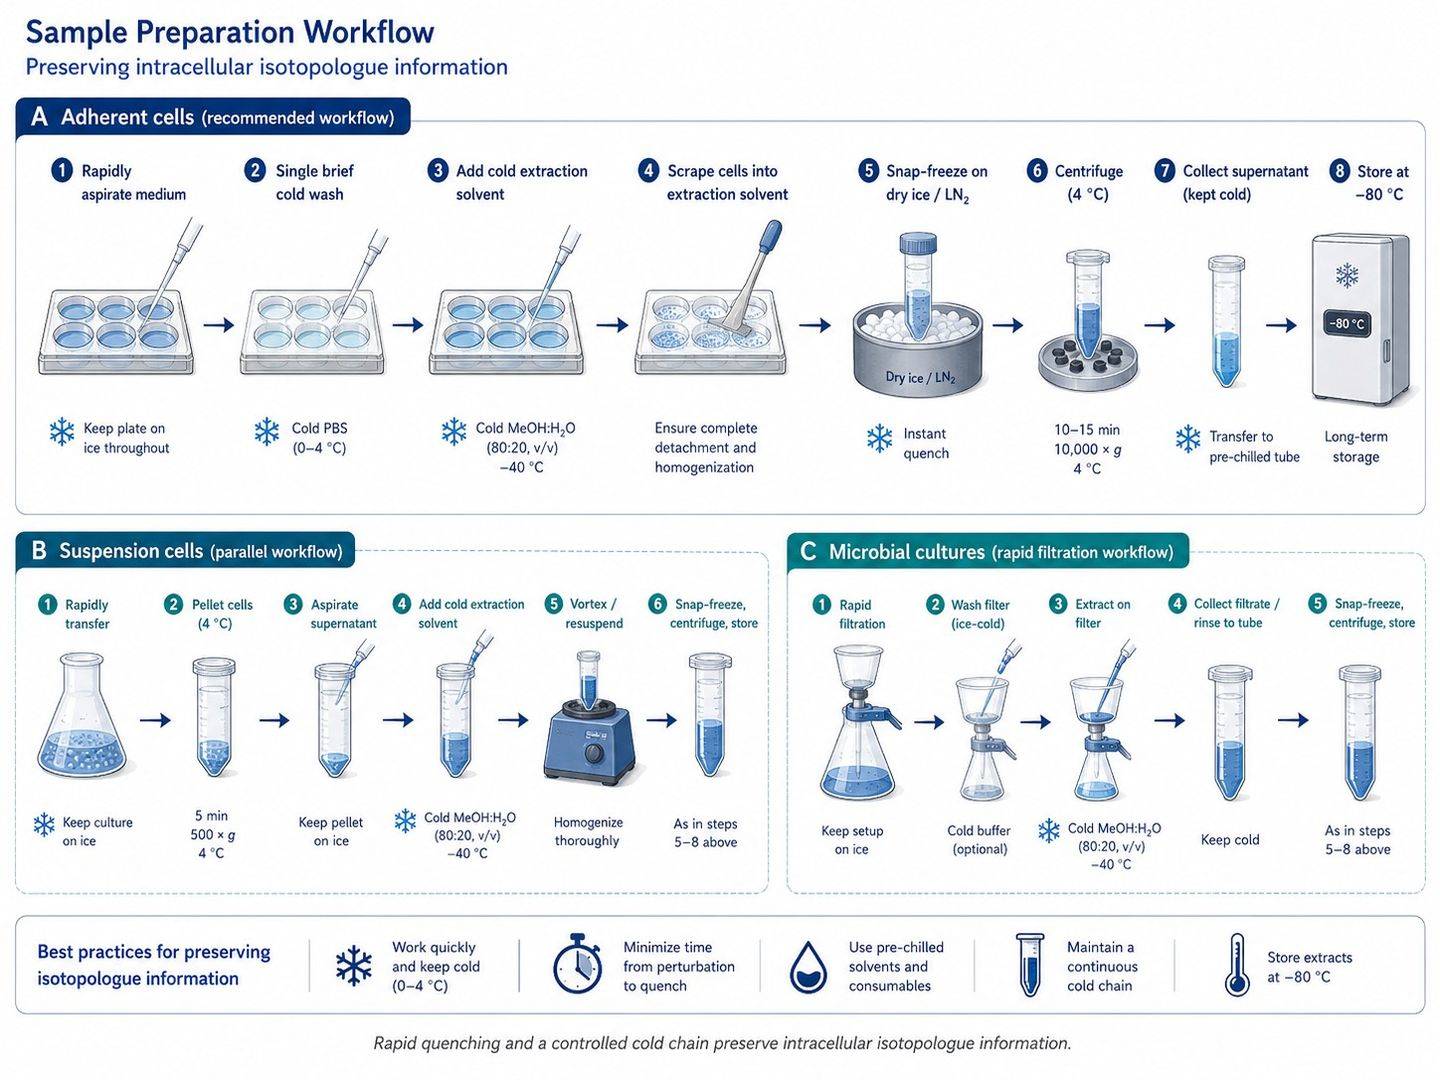
The time interval between medium removal and metabolic arrest is a critical experimental variable. Glycolytic intermediates, high-energy adenylates, and redox cofactors turnover within seconds. We finalize sampling and quenching protocols before labeling initiates, recommending pilot evaluations for non-standard matrices.
Planning Specifications by Sample Type
| Sample Matrix |
Starting Biomass per Replicate |
Preferred Arrest Protocol |
Critical Handling Notes |
| Adherent Mammalian Cells |
1–10 × 106 cells (60/100 mm dish) |
Rapid aspiration (<3 s), brief cold wash, immediate addition of pre-cooled (-80 °C) 80:20 MeOH:H2O |
Avoid trypsinization. Scrape directly on dry ice in extraction solvent. Collect parallel plate for cell count. |
| Suspension Mammalian Cells |
2–10 × 106 cells |
Rapid cold centrifugation (4 °C, <2 min) or direct sub-zero buffered quenching (-40 °C) |
Avoid room-temperature handling. Document centrifugation parameters and supernatant removal timing. |
| Microbial & Fermentation Broth |
2–10 mg dry cell weight (OD-adjusted) |
Fast vacuum filtration (<2 s) with liquid nitrogen flash freezing, or cold methanol quenching |
Verify cold-shock leakage tolerance. Collect conditioned supernatant for substrate uptake/secretion rates. |
| Plant Tissues & Leaves |
20–100 mg wet weight |
Instant freeze-clamping in liquid nitrogen, followed by cryogenic pulverization |
Maintain light cycle and developmental consistency. Avoid tissue thawing during homogenization. |
| Animal Tissues / In Vivo Models |
20–100 mg wet weight |
Instant freeze-clamping in liquid nitrogen upon rapid surgical excision |
Record infusion timing to collection window. Preserve anatomical consistency across biological replicates. |
Notes: Specifications depend on cell volume, analytical platform, target metabolite abundance, and tracer enrichment. Always retain uncultured medium blanks and conditioned media to quantify extracellular exchange rates as mandatory boundary conditions for targeted metabolomics panels.
Publication-Oriented MFA Data Package and Visual Outputs
We organize measured evidence, model-derived estimates, and visual interpretations into distinct analytical layers, enabling researchers to trace each biological conclusion back to raw mass spectrometry data. Deliverables include vector graphics (PDF/SVG) formatted for high-impact journal submission.
| Deliverable Layer |
Typical Contents |
Interpretive & Publication Value |
| Corrected Labeling Matrix |
Metabolite-by-isotopologue fractional abundance tables (M+0 to M+n), tracer enrichment, biological replicate statistics, and QC flags (.csv / Excel). |
Provides numerical foundations for statistical comparisons and figure reproducibility. |
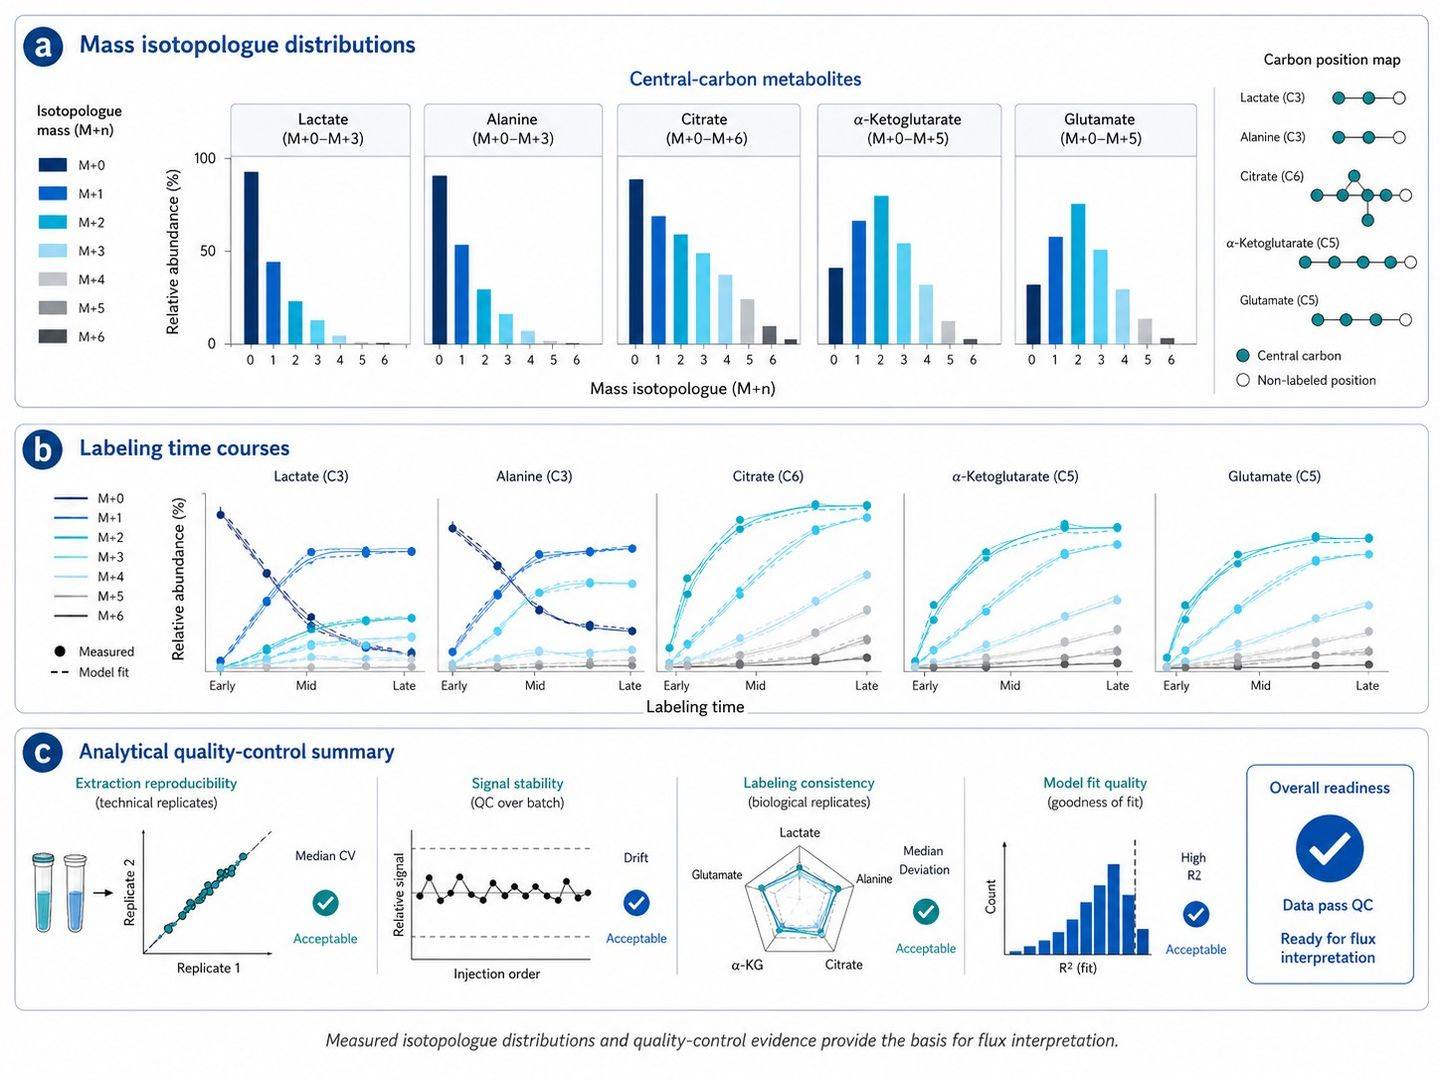
| Isotopologue Figures |
Condition-wise MID bar plots, time-course labeling trajectories, and biological replicate variance overlays. |
Illustrates isotopic incorporation patterns without confusing labeling fraction with absolute flux. |
| Flux Model Package |
Stoichiometric equations, atom transition matrices, fixed boundary exchange rates, objective function values, residuals, and EMU project files. |
Permits full computational transparency and independent model verification. |
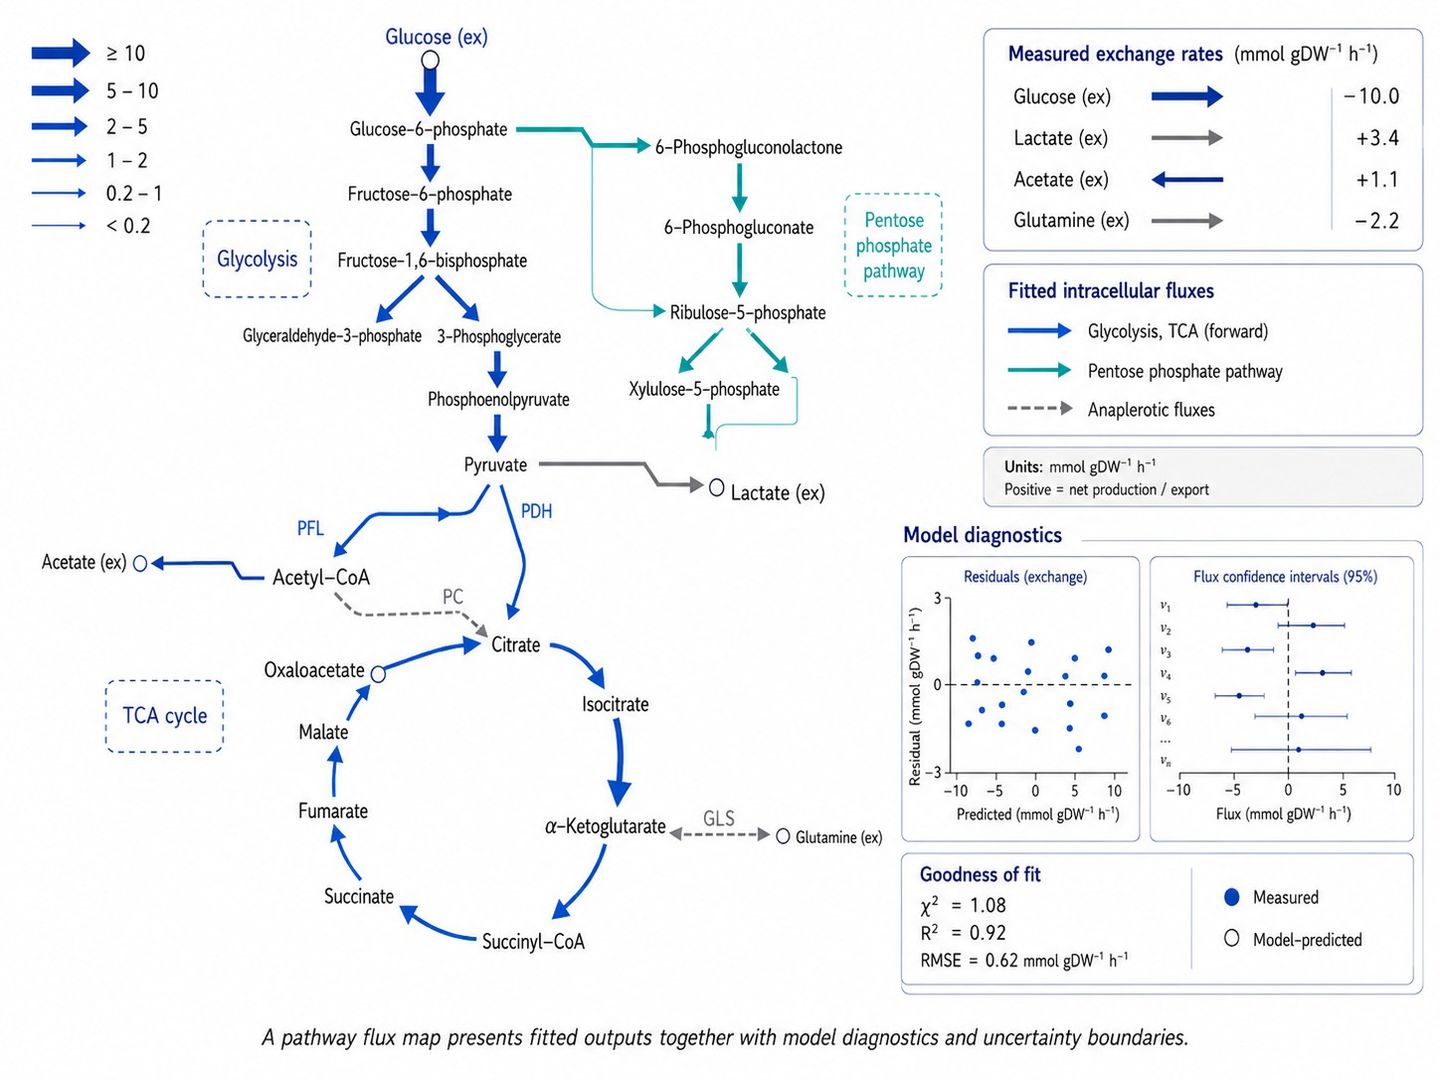
| Pathway Flux Maps |
High-resolution vector network diagrams with reaction arrow widths scaled to absolute net fluxes (v_net), exchange rates (v_xch), and confidence intervals. |
Delivers publication-grade visual summaries of metabolic pathway rewiring. |
| Technical Interpretation Report |
Branch-point flux ratios, model diagnostic statistics, alternative hypothesis evaluations, and recommended confirmatory experiments. |
Connects quantitative flux findings directly to research questions in biology, bioengineering, or pharmacology. |
When the project scope involves multivariate clustering (PCA, HCA), flux balance analysis (FBA), or multi-omics integration, our fluxomics data analysis service provides comprehensive bioinformatics support.
Research Applications of Metabolic Flux Analysis
- Metabolic Engineering & Bioprocess Optimization: Quantify carbon/nitrogen yield, eliminate byproduct overflow (acetate, lactate, ethanol), and resolve pathway bottlenecks in engineered microbial and mammalian cell factories.
- Central Carbon Pathway Kinetics: Utilize glycolytic pathway metabolic flux analysis and central carbon metabolic flux analysis to resolve the Warburg effect, pentose phosphate pathway split ratios, and TCA anaplerosis.
- Amino Acid & Nitrogen Metabolism: Deploy amino acid metabolic flux analysis to track transamination cascades, nitrogen assimilation, and urea cycle function.
- One-Carbon & Nucleotide Dynamics: Apply one-carbon metabolic flux analysis to measure serine/glycine catabolism, folate-mediated one-carbon flux, and de novo nucleotide synthesis.
- Drug Target Validation & Disease Mechanisms: Uncover pathway-wide metabolic perturbations induced by genetic knockouts, environmental stress, or small-molecule metabolic enzyme inhibitors.
References
- Antoniewicz MR. A guide to metabolic flux analysis in metabolic engineering: Methods, tools and applications. Metabolic Engineering. 2021;63:2-12.
- Jang C, Chen L, Rabinowitz JD. Metabolomics and Isotope Tracing. Cell. 2018;173(4):822-837.
- Dettmer K, Nürnberger N, Kaspar H, Gruber MA, Almstetter MF, Oefner PJ. Metabolite extraction from adherently growing mammalian cells for metabolomics studies: optimization of harvesting and extraction protocols. Analytical and Bioanalytical Chemistry. 2011;399(3):1127-1139.
- Yuan M, Kremer DM, Huang H, et al. Ex vivo and in vivo stable isotope labelling of central carbon metabolism and related pathways with analysis by LC-MS/MS. Nature Protocols. 2019;14(2):313-330.
- Midani FS, Wynn ML, Schnell S. The importance of accurately correcting for the natural abundance of stable isotopes. Analytical Biochemistry. 2017;520:27-43.
- Kaste JAM, Shachar-Hill Y. Model validation and selection in metabolic flux analysis and flux balance analysis. Biotechnology Progress. 2024;40(1):e3413.


 Contact Us


