What Are Polyphenols and Why Analyze Them?
Polyphenols are a large and diverse family of plant secondary metabolites that shape how plants grow, respond to stress, and interact with their environment. They contribute to color, flavor, astringency, and oxidative stability in fruits, vegetables, grains, beverages, and many plant-derived products. In crops and natural products, polyphenols often sit at the intersection of defense, quality, and nutritional value.
Because polyphenols are sensitive to genetics, environment, processing, and storage, their levels can vary dramatically between varieties, production batches, or treatment groups. For researchers and product developers, this variability is not just noise — it is a source of mechanistic insight and quality differentiation.
Polyphenols analysis therefore focuses on quantitatively profiling key phenolic acids, flavonoids, stilbenes, lignans, tannins and related compounds in relevant matrices. By using targeted LC–MS/MS methods, you can move beyond general "antioxidant capacity" readouts and obtain compound-level data that support:
- Comparing varieties, treatments, and processing conditions
- Linking specific polyphenols to traits or functions of interest
- Standardizing plant-based products, extracts, and formulations
In practice, polyphenols analysis becomes a central tool for plant science, food technology, and natural product R&D, providing data that are both biologically meaningful and ready for downstream decision-making.
What Polyphenols Analysis Services We Provide
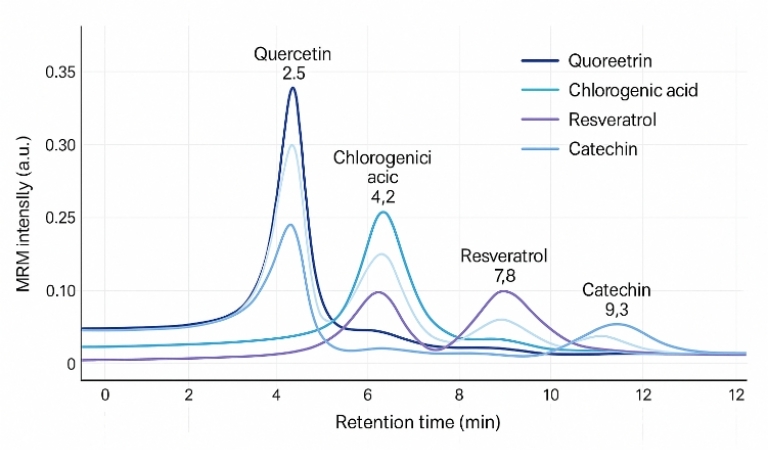
Representative Polyphenols Quantified by LC–MS/MS
| Class |
Subgroup / Compound Type |
Representative Analytes |
| Phenolic Acids |
Hydroxybenzoic acids |
Gallic acid, Protocatechuic acid, Vanillic acid, Syringic acid, Salicylic acid |
| |
Hydroxycinnamic acids |
Caffeic acid, Ferulic acid, p-Coumaric acid, Sinapic acid, Chlorogenic acid |
| Flavonoids |
Flavonols |
Quercetin, Kaempferol, Myricetin, Isorhamnetin, Rutin |
| |
Flavanols (Flavan-3-ols) |
Catechin, Epicatechin, Epigallocatechin gallate (EGCG), Gallocatechin, Procyanidin B1/B2 |
| |
Flavanones |
Naringenin, Hesperetin, Eriodictyol |
| |
Flavones |
Apigenin, Luteolin, Chrysin, Baicalein |
| |
Anthocyanins |
Cyanidin-3-glucoside, Delphinidin-3-glucoside, Malvidin-3-glucoside, Peonidin-3-glucoside, Pelargonidin-3-glucoside |
| Stilbenes |
— |
Resveratrol, Piceid, Pterostilbene |
| Lignans |
— |
Secoisolariciresinol, Matairesinol, Lariciresinol, Pinoresinol |
| Tannins & Derivatives |
Hydrolysable / Condensed tannins |
Ellagic acid, Pentagalloyl glucose, Catechin dimers, Proanthocyanidins |
| Other Polyphenolics |
Small phenolics / complex derivatives |
Phloridzin, Tyrosol, Hydroxytyrosol, Carnosol, Rosmarinic acid |
This is a representative list only. We offer panel expansion or substitution based on species, matrix, and analytical goals. Extended lists and MS/MS transitions are available on request.
Why Choose Creative Proteomics for Polyphenols Analysis?
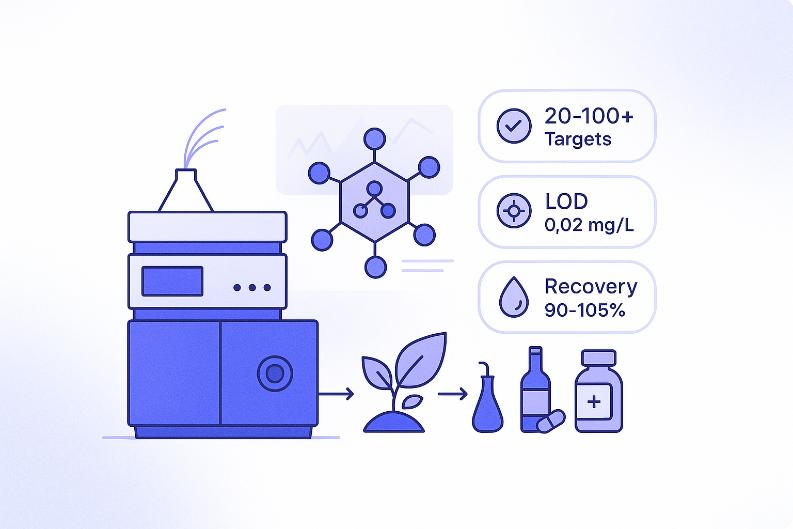
- Quantify 20–100+ polyphenols per sample with targeted LC–MS/MS
- Recovery rate 90–105%, verified across multiple plant and food matrices
- LOD as low as 0.02 mg/L, enabling trace detection in complex backgrounds
- RSD ≤ 5% in intra- and inter-batch precision for reliable comparisons
- Matrix-specific workflows optimized for >10 tissue and product types
- MRM-based quantification with ≥3 transitions per compound for selectivity
- QC-anchored acquisition, including blanks, spiked recoveries, and technical replicates
Technical Parameters of Our Polyphenols LC–MS/MS Platform
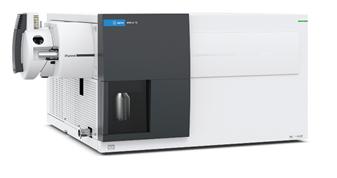
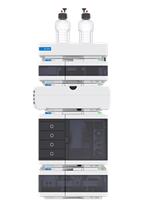
At Creative Proteomics, we perform targeted polyphenols analysis using a validated HPLC–MS/MS platform built around Agilent 1260 Infinity II HPLC and the Agilent 6495C Triple Quadrupole LC/MS. This configuration offers high sensitivity, broad dynamic range, and stable reproducibility across complex plant, food, and botanical matrices.
Core Instrumentation
HPLC System: Agilent 1260 Infinity II
Mass Spectrometer: Agilent 6495C Triple Quadrupole LC/MS
Ion Source: Electrospray Ionization (ESI), typically operated in negative mode
Scan Mode: Dynamic Multiple Reaction Monitoring (dMRM) for large-panel quantification
Injection Volume: 1–10 μL (matrix-dependent)
Chromatographic Run Time: 15–25 minutes per sample
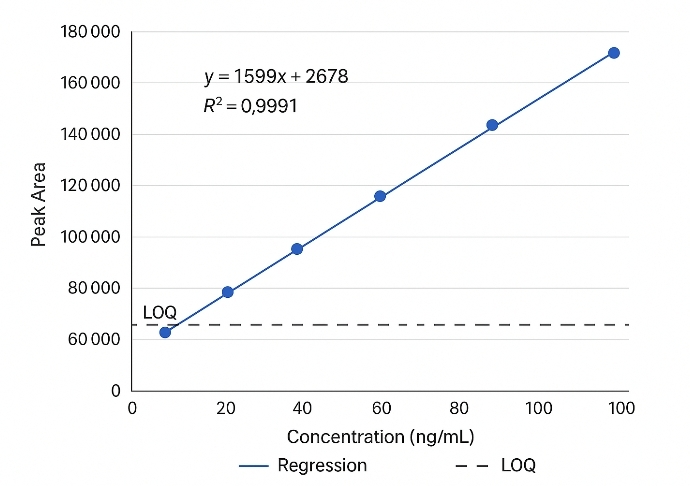
Method Performance Parameters
| Parameter |
Typical Performance |
| Limit of Detection (LOD) |
0.02–0.50 mg/L (compound and matrix dependent) |
| Limit of Quantification (LOQ) |
Typically 2–5× LOD |
| Linearity Range |
4–5 orders of magnitude (R² ≥ 0.995) |
| Method Precision (RSD) |
≤ 5% intra-batch; ≤ 8% inter-batch |
| Recovery Rate |
90–105% (validated in representative matrices) |
| Transitions per Compound |
≥2 (quantifier + qualifier MRM pairs) |
| Chromatographic Resolution |
Peak width ≤ 1.5 min (baseline), retention time shift < 0.2 min |
| QC Strategy |
Includes blanks, spiked QCs, pooled replicates in each acquisition |
| Calibration Approach |
Internal standard or matrix-matched external standard |
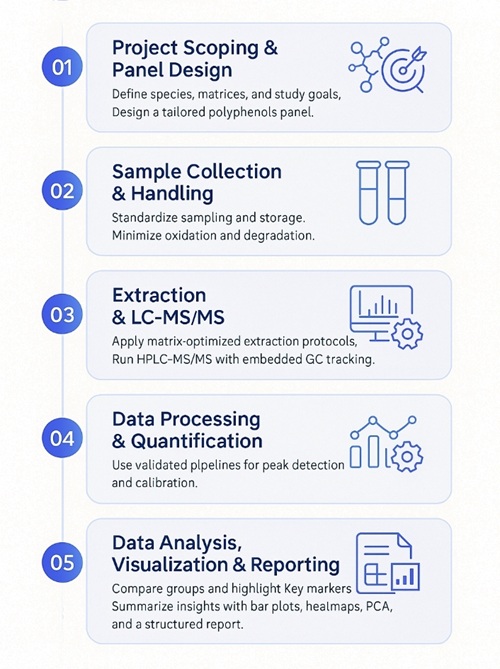
Workflow for Polyphenol Analysis
Sample Requirements and Preparation Guidelines for Polyphenols Analysis
| Sample Type |
Recommended Amount |
Storage Conditions |
Notes |
| Fresh plant tissue |
≥100 mg per sample |
Snap-freeze; store at –80 °C |
Avoid degradation by enzymes; minimize freeze–thaw cycles |
| Dried plant material |
≥100 mg per sample |
Airtight container; cool and dry |
Protect from light and moisture; document drying method |
| Fruit or vegetable juice |
≥500 μL per sample |
Store at –20 °C or below |
Indicate presence of sugar, acid, or preservative |
| Tea, wine, or beverage |
≥500 μL per sample |
Aliquot and freeze at –20 °C |
Filter before shipping if particulate-heavy |
| Herbal extract (liquid) |
≥200 μL per sample |
Protect from light; refrigerate or freeze |
Provide solvent composition and estimated concentration |
| Herbal extract (powder) |
≥100 mg per sample |
Dry; room temperature or refrigerated |
Indicate excipients if formulated |
| Tablets or capsules |
≥2 units or ≥200 mg powder |
Cool and dry; original packaging preferred |
Provide formulation details if available |
| Fermented plant product |
≥1 mL or ≥100 mg |
Freeze at –20 °C or below |
Inform if high ethanol or acid content |
If your sample type is not listed, our technical team can assess feasibility and advise on extraction strategy. Contact us for customized support.
Deliverables: What You Receive from a Polyphenols LC–MS/MS Project
- Raw data files (LC–MS/MS instrument files or converted formats, where appropriate)
- Quantitative tables listing concentrations of each polyphenol per sample
- QC and method summary, including key performance metrics and batch information
- Representative chromatograms and MS/MS spectra for selected analytes
- Statistical summaries and visualizations (e.g., group comparisons, plots), if requested
- Project report that documents sample handling, analytical methods, data processing steps, and key observations.
Applications of Polyphenols LC–MS/MS Analysis
Case 1. Comprehensive Analysis of Polyphenols in Grape Berry Skins: Cultivar Differences and Environmental Influences
Background:
The analysis of polyphenols is a crucial aspect of studying the composition of grape berry skins. Polyphenols are a diverse group of compounds that play important roles in the flavor, color, and health benefits of grapes and their derived products. Understanding the polyphenol composition can provide insights into the genetic and environmental factors that influence grape quality and the potential health benefits associated with grape consumption.
Sample:
The study utilized grape berry skins as the primary sample for polyphenol analysis. Berry skins are rich in polyphenols and serve as a key source for studying their composition. The skins were collected from a diversity panel, which included different grape cultivars with variations in genetic backgrounds and characteristics.
Technical Platform and Procedure:
Extraction and Sample Preparation for Polyphenol Analysis:
Extraction: Grape berry skins were ground with liquid nitrogen, and a portion of the powder was weighed. Methanol was added followed by acetone/H2O with trifluoroacetic acid. The mixture was crushed using Precellys, and the supernatant was obtained through centrifugation. The supernatant was dried with Genevac.
Sample Preparation: Methanol/H2O with formic acid was added to the dried solid, and the solution was solubilized using an Ultrasonic Cleaner. After centrifugation, dilutions were prepared, and pure and diluted samples were injected for UHPLC-QqQ-MS analysis.
Phloroglucinolysis: The solid obtained after evaporation was subjected to the phloroglucinolysis reaction, following a specific procedure.
Instrumentation:
Acquity UPLC system: It included a binary pump, a cooled autosampler, a diode array detection (DAD), and controlled by MassLynx software.
Triple quadrupole (QqQ) TQD mass spectrometer: Hyphenated with the UPLC system and controlled by MassLynx software.
Chromatographic Conditions:
Column: Reversed-phase Acquity HSS T3 1.8 μm 1.0 × 100 mm maintained at 40°C.
Mobile Phase: Formic acid in deionized water (solvent A) and formic acid in methanol (solvent B).
Flow Rate: 0.170 mL/min.
Injection Volume: 1 μL.
UPLC Analysis:
Polyphenol Composition: The chromatographic conditions included different gradient segments with varying solvent compositions. The column was brought back to initial conditions and re-equilibrated at the end of the sequence.
Tannin Units after Phloroglucinolysis: The chromatographic conditions involved different gradient segments with varying solvent compositions. The column was brought back to initial conditions and re-equilibrated at the end of the sequence.
Mass Spectrometry Conditions:
Operated in MRM mode with electrospray ionization (ESI) in positive or negative ionization mode.
Source and desolvation temperatures were set, and nitrogen was used as desolvation and cone gas.
Argon was used as collision gas, and capillary voltage was adjusted accordingly.
Results
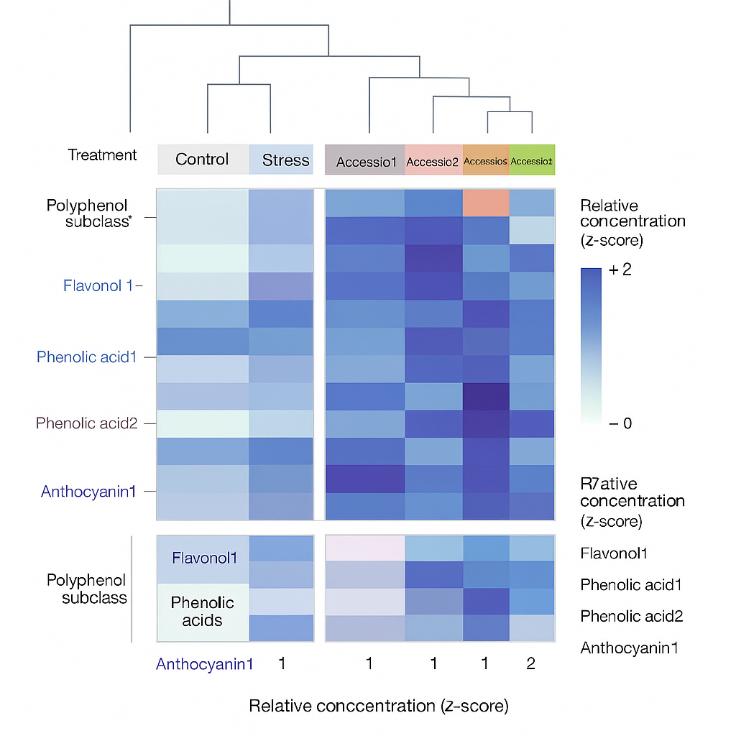
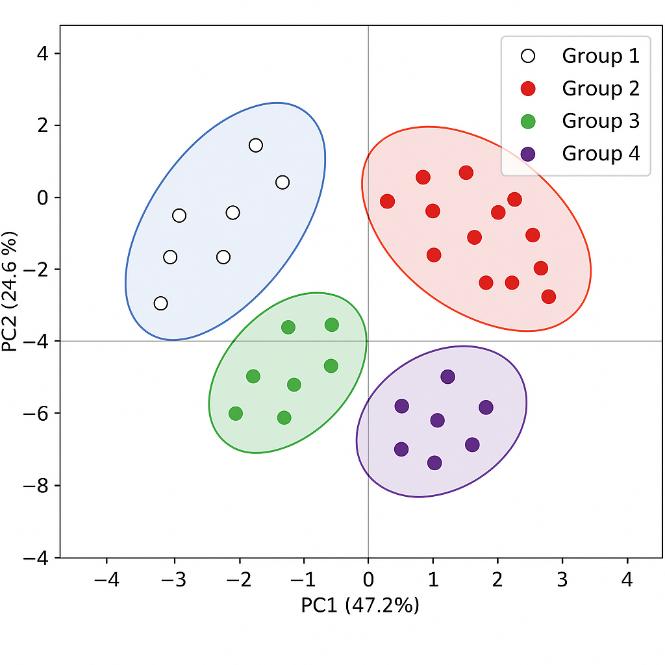
The results of the polyphenol analysis provided valuable insights into the composition and diversity of polyphenols in grape berry skins. The major polyphenol families identified in the samples included flavan-3-ols, anthocyanins, flavonols, hydroxycinnamic acids, stilbenes, and smaller amounts of dihydroflavonols and benzoic acids.
The study revealed significant variations in the concentrations of polyphenols across the diversity panel, indicating cultivar differences in polyphenol profiles. For example, anthocyanin contents enabled the distinction between white, pink, and red cultivars, with red cultivars specifically characterized by the presence of flavonols derived from myricetin, laricitrin, and syringetin glycosides.
Furthermore, the study highlighted the influence of environmental factors on polyphenol composition. Environmental conditions, such as sunlight exposure, were found to affect the concentrations of certain polyphenols, such as quercetin glycosides. Water deficit conditions also impacted polyphenol biosynthesis, with not-irrigated berries exhibiting higher levels of most phenolic compounds compared to irrigated berries.
Overall, the polyphenol analysis provided a comprehensive understanding of the composition, cultivar differences, and environmental influences on polyphenols in grape berry skins. These findings contribute to the knowledge of grape biology, flavor development, and potential health benefits associated with grape consumption.
 PCA of the MRM phenolic composition data
 Unsupervised hierarchical clustering of metabolites and cultivars affected by drought
 Histogram of the distribution of harvest dates
Reference
- Pinasseau, Lucie, et al. "Cultivar diversity of grape skin polyphenol composition and changes in response to drought investigated by LC-MS based metabolomics." Frontiers in plant science 8 (2017): 1826.
Multiomics of a rice population identifies genes and genomic regions that bestow low glycemic index and high protein content
Badoni, S., Pasion-Uy, E. A., Kor, S., Kim, S. R., Tiozon Jr, R. N., Misra, G., ... & Sreenivasulu, N.
Journal: Proceedings of the National Academy of Sciences
Year: 2024
Comparative metabolite profiling of salt sensitive Oryza sativa and the halophytic wild rice Oryza coarctata under salt stress
Tamanna, N., Mojumder, A., Azim, T., Iqbal, M. I., Alam, M. N. U., Rahman, A., & Seraj, Z. I.
Journal: Plant‐Environment Interactions
Year: 2024
Physiological, transcriptomic and metabolomic insights of three extremophyte woody species living in the multi-stress environment of the Atacama Desert
Gajardo, H. A., Morales, M., Larama, G., Luengo-Escobar, A., López, D., Machado, M., ... & Bravo, L. A.
Journal: Planta
Year: 2024
Glucocorticoid-induced osteoporosis is prevented by dietary prune in female mice
Chargo, N. J., Neugebauer, K., Guzior, D. V., Quinn, R. A., Parameswaran, N., & McCabe, L. R.
Journal: Frontiers in Cell and Developmental Biology
Year: 2024
Prospective randomized, double-blind, placebo-controlled study of a standardized oral pomegranate extract on the gut microbiome and short-chain fatty acids
Sivamani, R. K., Chakkalakal, M., Pan, A., Nadora, D., Min, M., Dumont, A., ... & Chambers, C. J.
Journal: Foods
Year: 2023
A non-probiotic fermented soy product reduces total and ldl cholesterol: A randomized controlled crossover trial
Jung, S. M., Haddad, E. H., Kaur, A., Sirirat, R., Kim, A. Y., Oda, K., ... & Sabaté, J.
Journal: Nutrients
Year: 2021