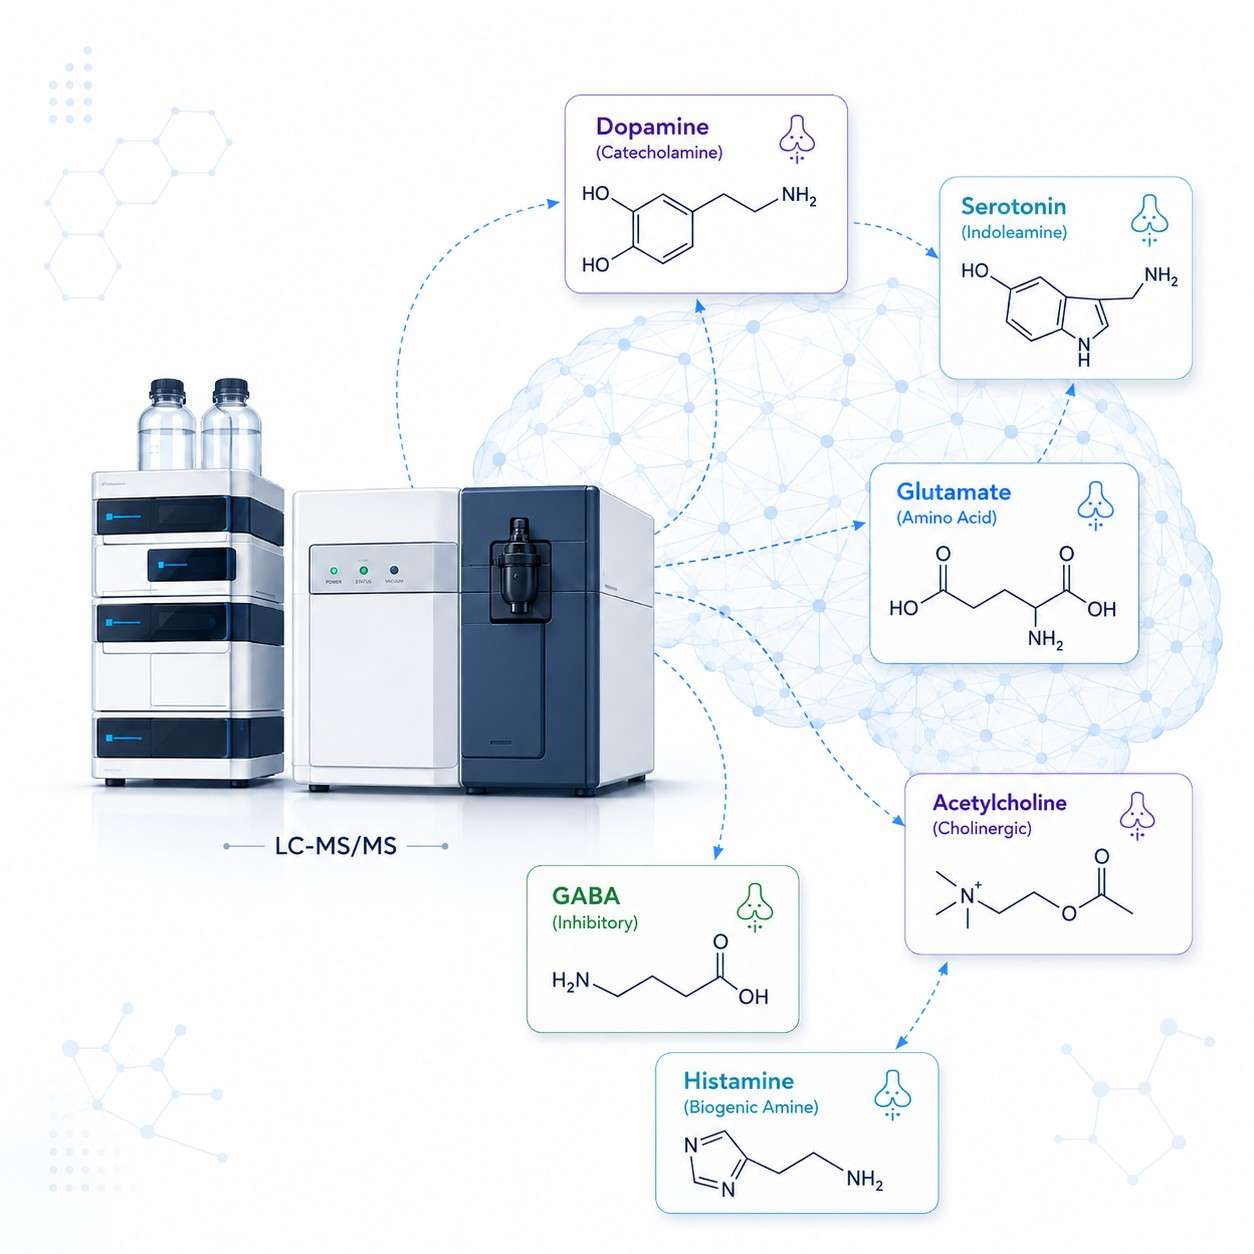
Neurotransmitter Detection Panel — 30+ Analytes Organized by Pathway
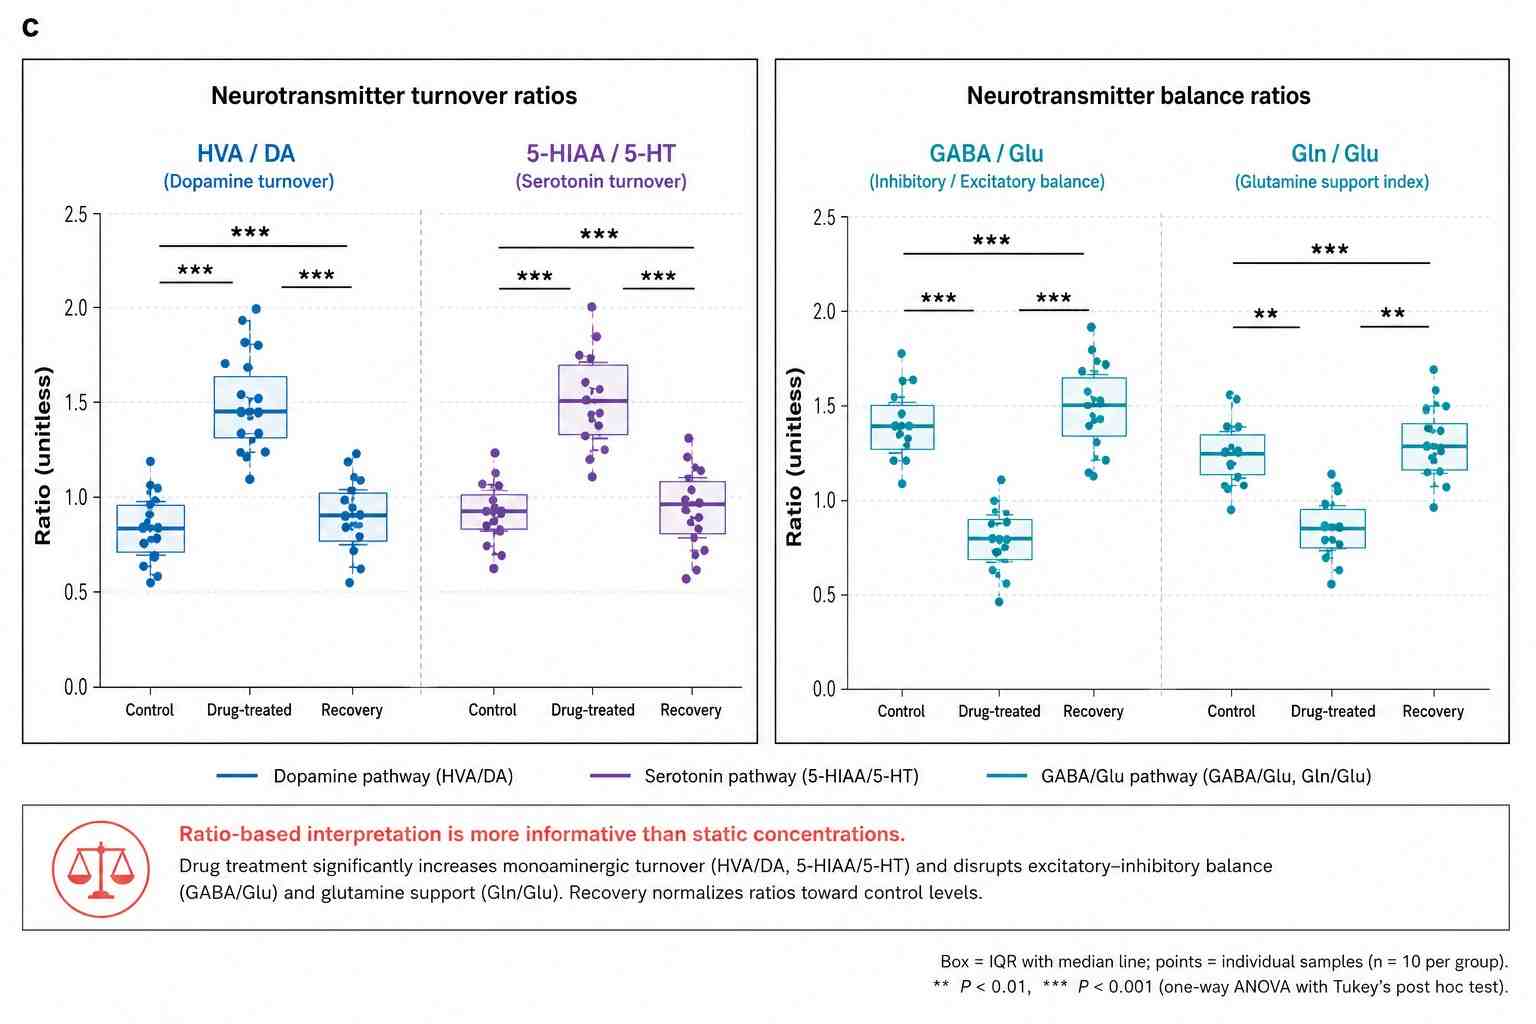
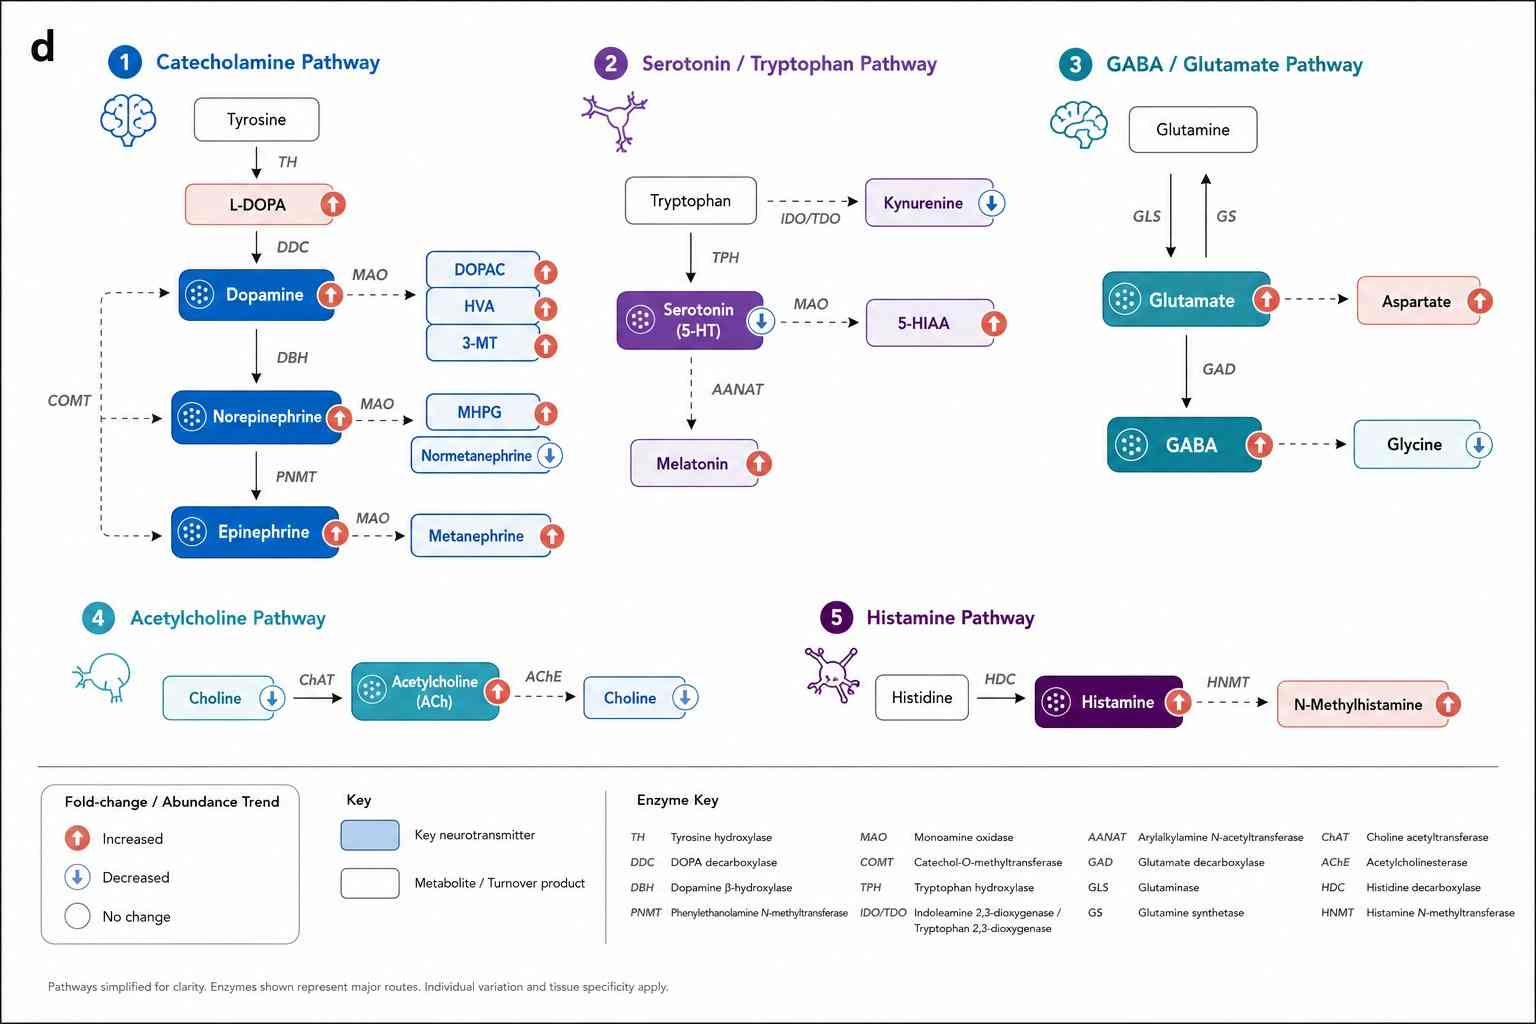
Each analyte is quantified against its own stable isotope-labeled internal standard. The panel is organized by biosynthetic pathway because parent-to-metabolite ratios are the biologically informative readout — a single concentration number without pathway context reveals little about neuronal activity. Each pathway sub-page provides dedicated compound lists, sample requirements, and method details.
Catecholamine Pathway — Dopamine, Norepinephrine, Epinephrine & Metabolites
| Analyte |
Role |
Key Ratio / Index |
Biological Significance |
| Dopamine (DA) |
Neurotransmitter |
HVA/DA (dopamine turnover) |
Rate-limiting step of reward, motor control, and cognition pathways. HVA/DA ratio is the gold-standard dopamine turnover index — elevated when dopaminergic neurons are firing more or MAO/COMT activity is upregulated. |
| 3,4-Dihydroxyphenylacetic acid (DOPAC) |
Intraneuronal metabolite (MAO) |
DOPAC/DA |
Formed inside the presynaptic terminal by MAO before DA is released. DOPAC/DA reflects intraneuronal MAO activity — drops under MAO inhibition, rises with increased DA synthesis. |
| Homovanillic acid (HVA) |
Terminal metabolite (MAO + COMT) |
HVA/DA (overall turnover) |
Terminal DA metabolite (MAO + COMT). HVA/DA ratio in tissue distinguishes synthesis-coupled release from enzymatic degradation — elevated when both MAO and COMT pathways are active. |
| 3-Methoxytyramine (3-MT) |
Extracellular metabolite (COMT) |
3-MT/DA |
Formed extracellularly by COMT only after DA is released. 3-MT/DA is a direct index of dopamine release — independent of MAO. Distinguishes increased release from increased synthesis. |
| Norepinephrine (NE) |
Neurotransmitter |
MHPG/NE |
MHPG/NE ratio reflects noradrenergic turnover — elevated in stress and anxiety, blunted in noradrenergic-deficient depression. CSF MHPG is a pharmacodynamic biomarker for NE reuptake inhibitors. |
| Normetanephrine (NMN) |
Extracellular metabolite (COMT) |
NMN/NE |
COMT-derived NE metabolite. NMN/NE paired with MHPG/NE distinguishes COMT vs. MAO contributions to NE clearance — relevant for COMT inhibitor monitoring. |
| Epinephrine (E) |
Hormone/neurotransmitter |
Metanephrine/E |
Adrenal medullary hormone. Metanephrine/E ratio with NE metabolites distinguishes adrenal vs. extra-adrenal catecholamine sources. |
| Metanephrine (MN) |
Metabolite (COMT) |
MN/E |
COMT-derived E metabolite. Research-grade quantitative sensitivity for the metanephrine/E ratio in plasma and tissue. |
Serotonin & Tryptophan Pathway
| Analyte |
Role |
Key Ratio / Index |
Biological Significance |
| Serotonin (5-HT) |
Neurotransmitter |
5-HIAA/5-HT (serotonin turnover) |
5-HIAA/5-HT ratio reflects serotonin turnover — elevated by SSRI treatment (increased synaptic 5-HT → more 5-HIAA), decreased in serotonin-deficient states. Core readout for serotonergic pharmacology. |
| 5-Hydroxyindoleacetic acid (5-HIAA) |
Terminal metabolite (MAO + ALDH) |
5-HIAA/5-HT |
Primary serotonin metabolite (MAO + ALDH). CSF 5-HIAA is reduced in depression and suicidality. 5-HIAA/5-HT ratio in brain tissue is the standard serotonin turnover index. |
| Tryptophan (Trp) |
Precursor amino acid |
5-HT/Trp, Kyn/Trp |
Precursor for both serotonin and kynurenine pathways. 5-HT/Trp vs. Kyn/Trp reveals metabolic partitioning — shifted toward kynurenine under inflammation (IDO/TDO), reducing serotonin synthesis. |
| Kynurenine (Kyn) |
Alternative pathway metabolite |
Kyn/Trp (IDO/TDO activity) |
Kyn/Trp ratio surrogates IDO/TDO activity — elevated in neuroinflammation, depression, and immune activation. Neurotoxic vs. neuroprotective downstream partitioning tracked by quinolinic/kynurenic acid ratio. |
| Melatonin |
Pineal hormone |
Melatonin/5-HT |
Serotonin-derived circadian hormone. Melatonin/5-HT ratio reflects AANAT activity — the rate-limiting, clock-regulated enzyme for melatonin synthesis. |
GABA, Glutamate & Amino Acid Neurotransmitters
| Analyte |
Role |
Key Ratio / Index |
Biological Significance |
| Glutamate (Glu) |
Primary excitatory neurotransmitter |
Glu/Gln (glutamine cycle) |
Glu/Gln ratio reflects the neuron-astrocyte glutamate-glutamine cycle — elevated in epilepsy and excitotoxicity. Core readout for glutamatergic signaling and astrocytic glutamate recycling. |
| Glutamine (Gln) |
Precursor / glial metabolite |
Gln/Glu |
Astrocytic product of synaptically-released Glu uptake. Decreased Gln/Glu indicates impaired astrocytic glutamine synthetase — hepatic encephalopathy, neurodegeneration. |
| GABA |
Primary inhibitory neurotransmitter |
GABA/Glu (excitation/inhibition) |
Synthesized from Glu by GAD. GABA/Glu ratio reflects excitation/inhibition balance — decreased in epilepsy and anxiety; modulated by anticonvulsants and anxiolytics. |
| Aspartate (Asp) |
Co-agonist / excitatory |
Asp/Glu |
NMDA co-agonist with Glu. Asp/Glu ratio adds resolution on NMDA receptor activation state — stroke, schizophrenia, NMDA antagonist pharmacology. |
| Glycine |
Co-agonist (inhibitory + excitatory) |
Gly/Glu |
Dual-function: inhibitory co-agonist at glycine receptors AND obligatory NMDA co-agonist. Gly/Glu ratio reflects NMDA receptor glycine-site occupancy — rate-limiting for NMDA activation in most brain regions. |
Acetylcholine & Histamine Pathways
| Analyte |
Role |
Key Ratio / Index |
Biological Significance |
| Acetylcholine (ACh) |
Neurotransmitter |
ACh/Ch (cholinergic index) |
Primary cholinergic NT for cognition, memory, and autonomic function. ACh/Ch ratio reflects ChAT vs. AChE balance — requires microwave fixation for reliable quantification (ACh hydrolyzed within seconds post-mortem). |
| Choline (Ch) |
Precursor / metabolite |
Ch/ACh |
Precursor and degradation product of ACh. Elevated Ch/ACh with low ACh indicates increased AChE activity — Alzheimer's cholinergic deficit, AChE inhibitor pharmacodynamics. |
| Histamine |
Neurotransmitter / immune mediator |
N-Methylhistamine/Histamine |
Central (wakefulness, cognition) and peripheral (mast cell) roles. N-methylhistamine/histamine ratio reflects HNMT activity — primary CNS histamine clearance. |
| N-Methylhistamine |
Metabolite (HNMT) |
N-Methylhistamine/Histamine |
HNMT-derived metabolite. Paired with histamine, distinguishes increased synthesis from impaired HNMT-mediated clearance in allergy and mast cell activation. |
Analytical Platform & Method for Neurotransmitter Quantification
LC-MS/MS Platform
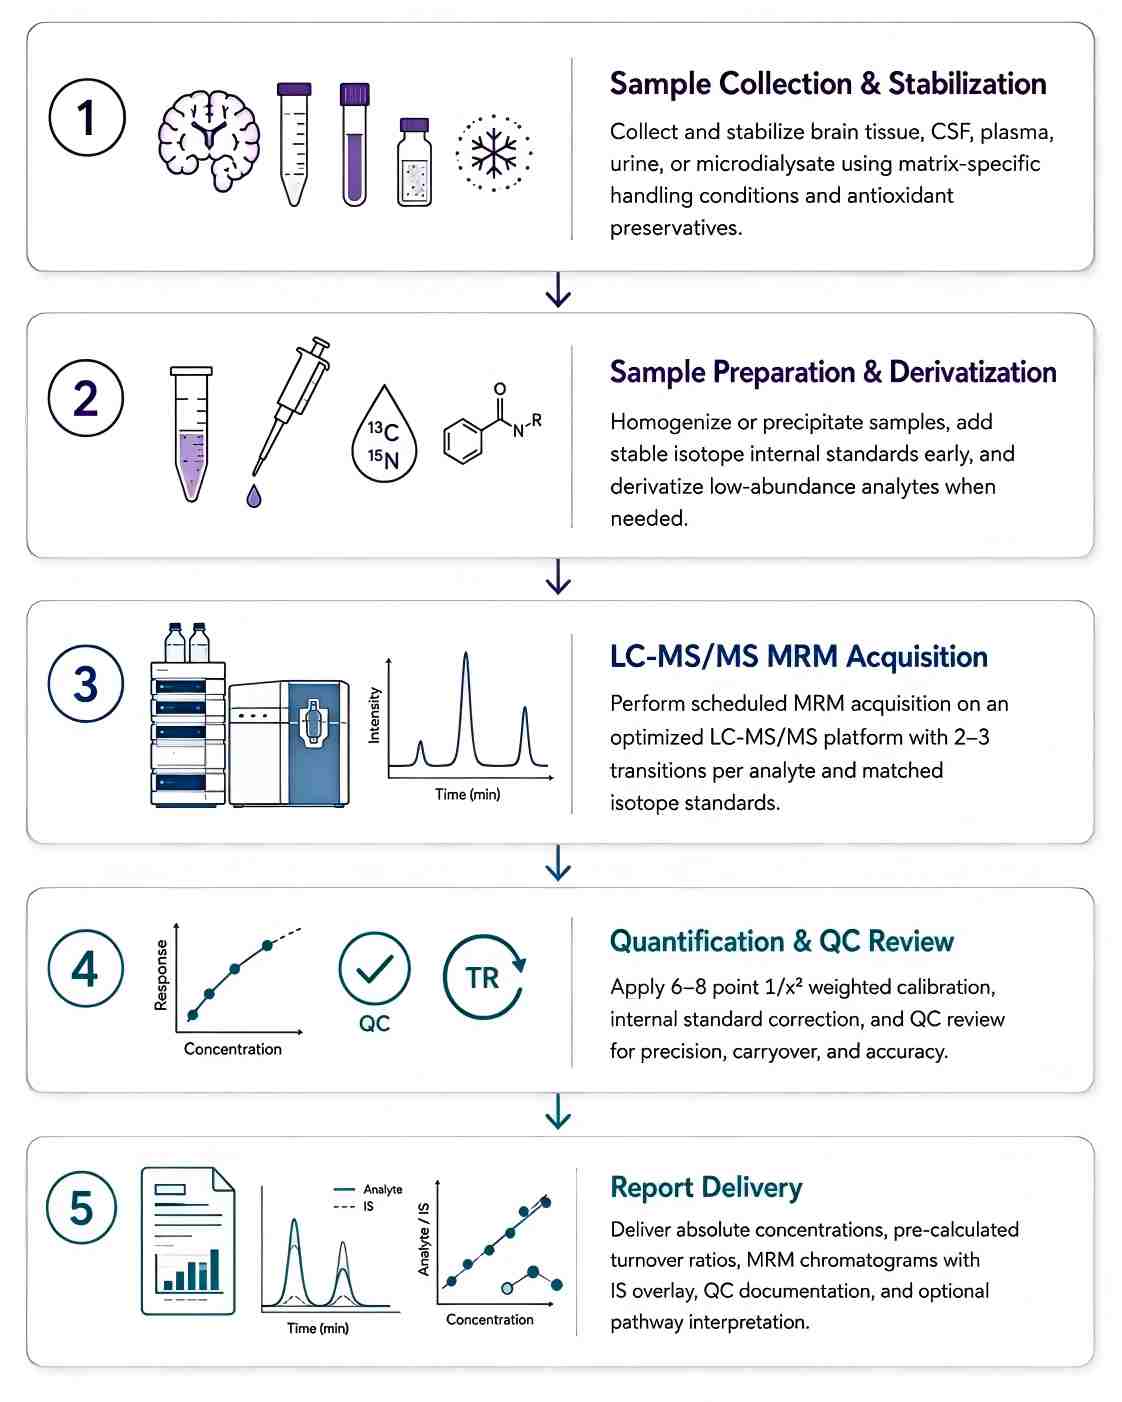
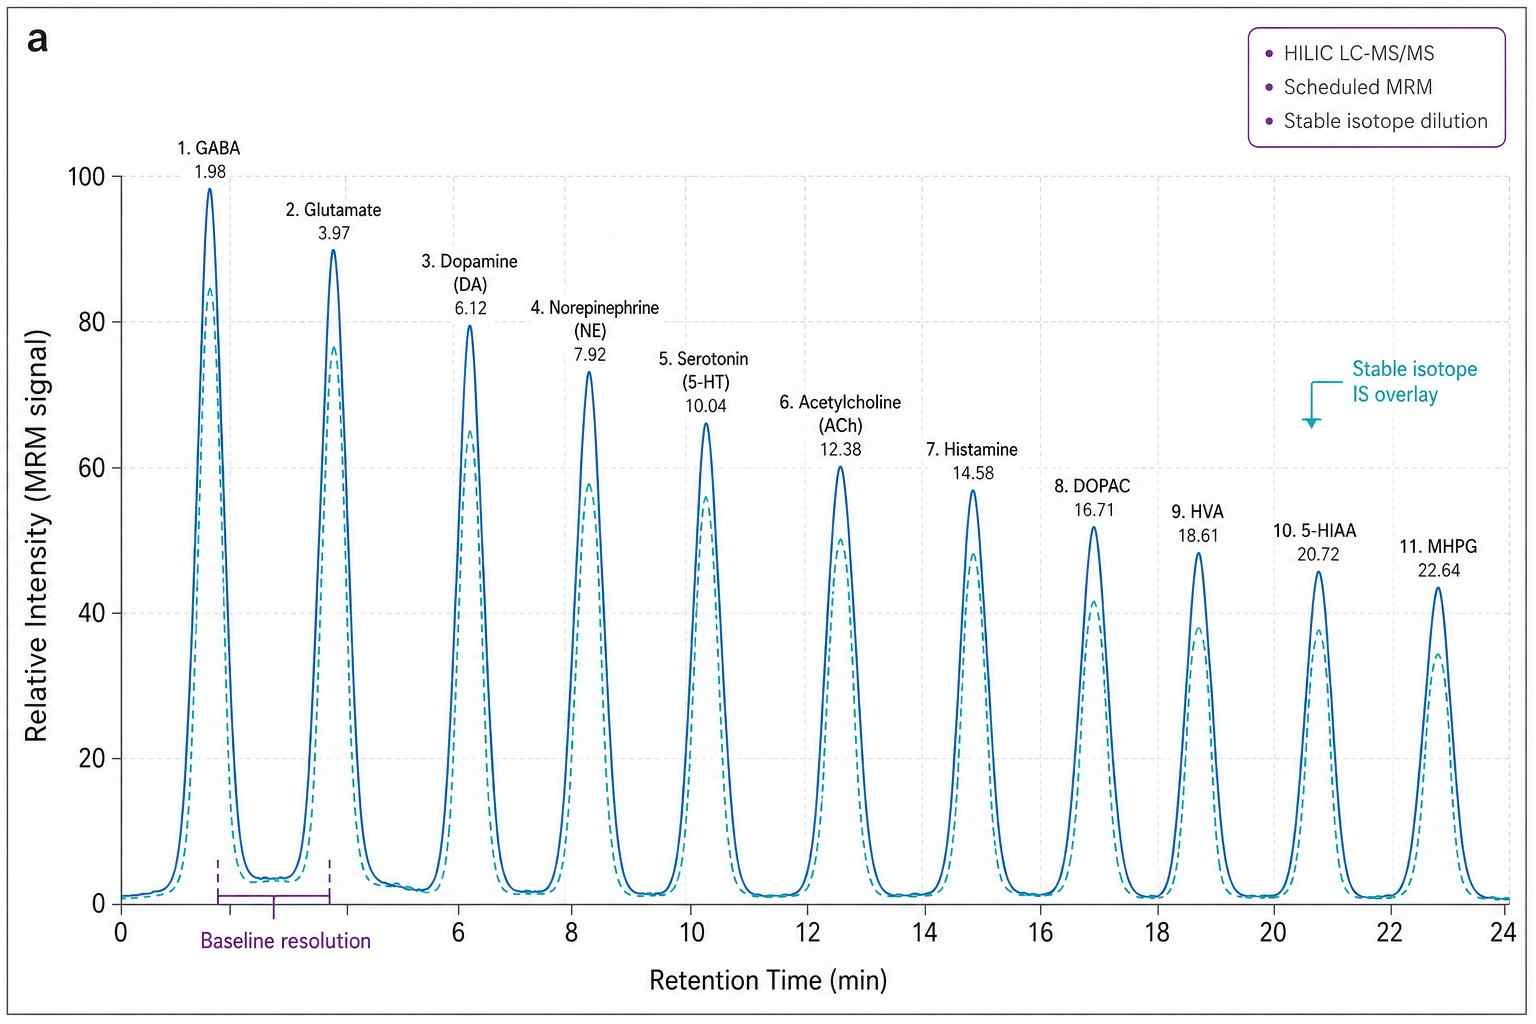
SCIEX QTRAP 6500+ with scheduled MRM acquisition. HILIC chromatography for polar neurotransmitters and metabolites (dopamine, serotonin, GABA, glutamate, ACh, histamine, and all metabolites). Stable isotope internal standards (d4-DA, d6-NE, d6-5-HT, d5-5-HIAA, 13C5-Glu, 13C5-Gln, d6-GABA, d9-ACh, etc.) spiked at homogenization. Derivatization (dansyl chloride or benzoyl chloride) for enhanced sensitivity on low-abundance analytes (ACh, histamine).
Complementary: HPLC-ECD for electrochemical detection of catecholamines and indoleamines in microdialysate samples where ultra-low volume (below 5 uL) precludes LC-MS/MS injection. Provides cross-validation for key analytes.
Method Performance
| Parameter |
Specification |
| LOD |
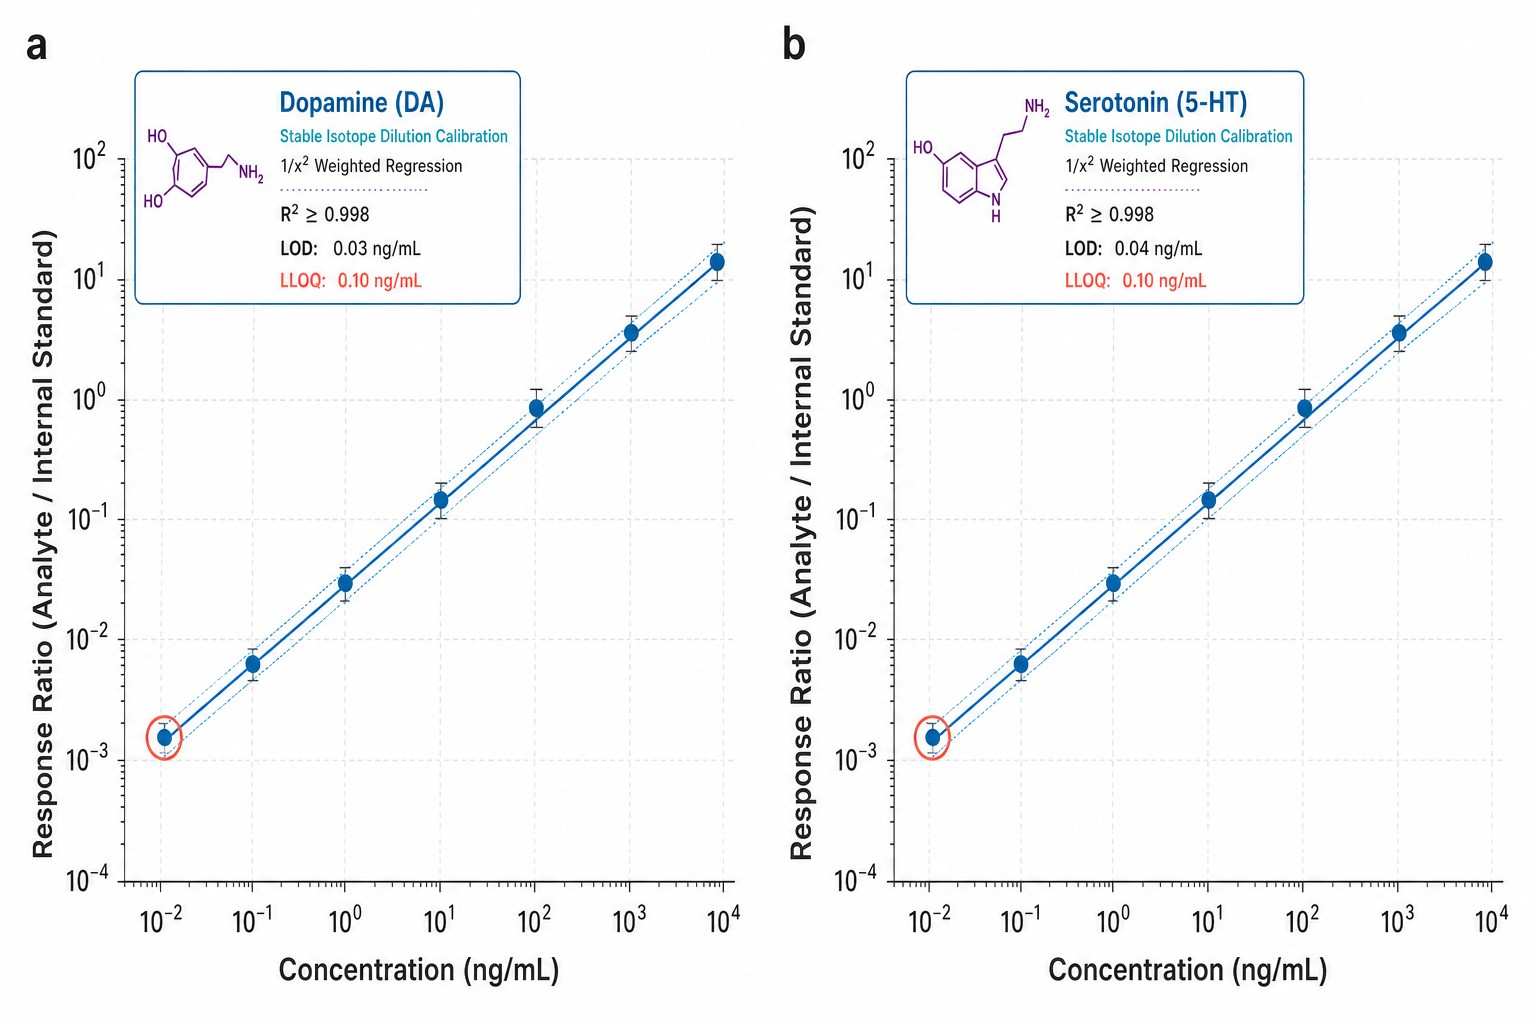
0.01-0.5 ng/mL (sub-pg to low pg on-column); DA: 0.05 ng/mL, 5-HT: 0.1 ng/mL, ACh: 0.5 ng/mL |
| LLOQ |
0.1-2.0 ng/mL (matrix-dependent) |
| Linear Range |
3-4 orders of magnitude; R2 above or equal to 0.99 per analyte |
| Quantification |
Absolute — stable isotope dilution (SID) with 6-8 point calibration curves, 1/x2 weighted regression |
| Precision (CV) |
Intra-batch: below 5% (high-abundance), below 10% (trace). Inter-batch: below 15% |
| Spike Recovery |
85-115% at low/mid/high QC levels per matrix |
Neurotransmitter Analysis Workflow
Sample Requirements for Neurotransmitter Analysis
| Sample Type |
Minimum Amount |
Critical Handling Requirements |
Storage & Shipping |
| Brain Tissue (microwave-fixed) |
10-20 mg per region |
Microwave fixation (5-8 kW, 0.8-1.2 s) immediately after sacrifice — essential for ACh quantification. Dissect regions on ice after fixation. Record fixation parameters and warm ischemia time. |
-80 degree C; dry ice |
| Brain Tissue (frozen) |
20-30 mg per region |
Snap-freeze in liquid N2 within 30 s of dissection. Suitable for catecholamines, indoleamines, and amino acid NTs. ACh not reliably quantifiable without microwave fixation. Record warm ischemia time. |
-80 degree C; dry ice |
| CSF |
20-50 uL (rodent); 100-200 uL (large animal/human) |
Collect into pre-chilled polypropylene tubes with ascorbic acid (0.1% w/v) + EDTA (0.01% w/v) as antioxidant/preservative. Centrifuge (1,000 x g, 5 min, 4 degree C), aliquot, freeze within 30 min. Discard if blood-contaminated. |
-80 degree C; dry ice |
| Plasma |
50-100 uL (rodent); 200-500 uL (large animal/human) |
EDTA or lithium heparin. Add sodium metabisulfite (1 mg/mL final). Centrifuge within 15 min of collection at 1,500 x g, 10 min, 4 degree C. Aliquot immediately. Record time from collection to freezing. |
-80 degree C; dry ice |
| Microdialysate |
10-30 uL per timepoint |
Collect directly into perchloric acid (0.1 M final) or ascorbic acid (0.1% w/v) to stabilize. Note perfusion fluid composition, flow rate, probe type, and recovery calibration details. |
-80 degree C; dry ice |
| Urine |
0.5-1 mL |
24 h collection preferred with HCl (6 M, 10 mL per 24 h collection) as preservative. Record total volume for concentration normalization. Creatinine measured in parallel for output normalization. |
-80 degree C; dry ice |
Applications of Neurotransmitter Analysis
Deliverables — What You Receive
- Quantitative Concentration Table — Absolute concentrations (ng/mL or ng/g tissue) for each analyte per sample. Excel and CSV. Turnover ratios pre-calculated. LOD/LLOQ flags and IS recovery per sample.
- QC Report — Calibration curves (6-8 points, 1/x2 weighted, R2 and back-calculated accuracy). Pooled QC RSD. IS recovery per sample. Blank carryover. Spike recovery at 3 levels per matrix.
- MRM Chromatograms — Extracted ion chromatograms for each analyte with co-eluting stable isotope IS overlay. MS/MS confirmation spectra for isomer identification.
- Methods Documentation — Complete LC-MS/MS parameters, derivatization protocol, extraction method, data processing settings. Formatted for manuscript methods section.
- Optional Statistical Analysis — Group comparisons (t-test/ANOVA, FDR, volcano/box plots), PCA/PLS-DA, pathway diagrams, publication-ready figures (300 DPI TIFF + vector PDF/AI).
Data Visualizations
Case Study — Simultaneous Quantification of 15 Neurotransmitters in a Single Rodent Brain Sample: From Tissue to Microdialysate
Validated methods for determination of neurotransmitters and metabolites in rodent brain tissue and extracellular fluid by reversed phase UHPLC-MS/MS
Van Schoors, J., Viaene, J., Van Wanseele, Y., et al. | Journal of Chromatography A, 2016, 1443, 73-83 | IF: 3.8
DOI: 10.1016/j.jchromb.2016.06.011
What They Needed
Quantifying all major neurotransmitter classes — monoamines, their metabolites, amino acid neurotransmitters, and acetylcholine — from a single brain sample is analytically demanding. The core problems: glutamate is present at uM while serotonin and ACh are at low nM (10,000-fold difference), ACh is hydrolyzed within seconds of death, and brain tissue phospholipids cause severe ion suppression in ESI-MS. The researchers needed one validated method that could handle both brain tissue homogenates AND microdialysate — matrices with vastly different concentration ranges and interference profiles.
What They Got
Van Schoors et al. developed a reversed-phase UHPLC-MS/MS method with dansyl chloride derivatization that simultaneously quantified 15 neurotransmitters and metabolites across monoamine, amino acid, and acetylcholine pathways from a single injection:
| Parameter |
Brain Tissue |
Microdialysate |
| LOD |
0.01-0.5 ng/mL |
0.01-0.3 ng/mL |
| Precision (intra-batch) |
Below 8% CV |
Below 10% CV |
| Spike recovery |
88-108% |
85-112% |
| Linear range |
4 orders of magnitude |
3 orders of magnitude |
The dansyl chloride derivatization step was the key innovation — enhancing sensitivity for low-abundance monoamines 10-50x while improving chromatographic retention. Applied to rat brain, the method revealed clear region-specific neurotransmitter profiles: striatum dominated by dopamine (12.5 ng/mg, DOPAC/DA 0.32), hippocampus by acetylcholine (2.8 ng/mg), and prefrontal cortex by serotonin (0.9 ng/mg, 5-HIAA/5-HT 1.4).
Why This Matters for Your Research
The region-specific neurotransmitter profiles reported here — striatal DA (12.5 ng/mg), hippocampal ACh (2.8 ng/mg), cortical 5-HT (0.9 ng/mg) — are not just numbers. They demonstrate that a single validated LC-MS/MS method can resolve neuroanatomical differences in neurotransmitter systems simultaneously. If you are comparing wild-type vs. knockout brain regions, tracking drug-induced neurotransmitter changes over a time course, or profiling microdialysate fractions before and after a behavioral intervention, this is your analytical framework. You do not need separate assays for monoamines, amino acids, and acetylcholine — one injection, one report, all ratios pre-calculated.
How Our Service Delivers the Same Rigor
This study mirrors our neurotransmitter panel: (1) a single extraction and injection covering monoamines, amino acid NTs, and acetylcholine — no need for separate assays; (2) stable isotope internal standards with documented precision and recovery; (3) matrix-specific validation giving you confidence in data across brain tissue, CSF, plasma, and microdialysate. When you submit your samples, every neurotransmitter is resolved, every metabolite tracked, and every turnover ratio pre-calculated — the same analytical framework, applied to your experiment.
Reference
- Van Schoors, J., Viaene, J., Van Wanseele, Y., et al. Validated methods for determination of neurotransmitters and metabolites in rodent brain tissue and extracellular fluid by reversed phase UHPLC-MS/MS. Journal of Chromatography A 1443, 73-83 (2016).
Selected Publications in Neurotransmitter Analysis
Validated methods for determination of neurotransmitters and metabolites in rodent brain tissue and extracellular fluid by reversed phase UHPLC-MS/MS
Van Schoors, J., Viaene, J., Van Wanseele, Y., et al.
Journal: Journal of Chromatography A
Year: 2016
DOI: https://doi.org/10.1016/j.jchromb.2016.06.011
Quantitative analysis of neurochemical panel in rat brain and plasma by liquid chromatography-tandem mass spectrometry
Kovac, A., Somikova, Z., Zilka, N., & Novak, M.
Journal: Talanta
Year: 2014
DOI: https://doi.org/10.1016/j.talanta.2013.10.047
LC-ESI-MS-MS method for monitoring dopamine, serotonin and their metabolites in brain tissue
Wojnicz, A., Avendano-Ortiz, J., de Pascual-Teresa, M.A., et al.
Journal: Chromatographia
Year: 2016
DOI: https://doi.org/10.1007/s10337-016-3103-9
Simultaneous determination of 16 neurotransmitters and metabolites in human plasma using UPLC-MS/MS with dansyl chloride derivatization
Zheng, J., Mandal, R., & Wishart, D.S.
Journal: Analytica Chimica Acta
Year: 2018
DOI: https://doi.org/10.1016/j.aca.2018.07.060
Development and validation of a UHPLC-MS/MS method for the simultaneous determination of 11 neurotransmitters in rat brain
He, B., Bi, K., Jia, Y., et al.
Journal: Journal of Pharmaceutical and Biomedical Analysis
Year: 2016
DOI: https://doi.org/10.1016/j.jpba.2016.03.038
Ionic liquid based ultrasound assisted dispersive liquid-liquid micro-extraction for simultaneous determination of 15 neurotransmitters in rat brain, plasma and cell samples
Zhu, K., et al.
Journal: Journal of Chromatography A
Year: 2020
DOI: https://doi.org/10.1016/j.chroma.2020.461096
Central biogenic amine deficiency with concomitant exploratory behavioral deficits in Dnajc12 knock-out mice
Deng, I.B., et al.
Journal: NPJ Parkinson's Disease
Year: 2025
DOI: https://doi.org/10.1038/s41531-025-00991-4
Dimethyl fumarate treatment restrains the antioxidative capacity of T cells to control autoimmunity
Liebmann, M., Korn, L., Janoschka, C., et al.
Journal: Brain
Year: 2021
DOI: https://doi.org/10.1093/brain/awab307
Neurotransmitters analysis by LC-MS/MS: recent developments and applications in neuroscience research
Helmschrodt, C., Becker, S., Perl, T., et al.
Journal: Bioanalysis
Year: 2020
DOI: https://doi.org/10.4155/bio-2020-0125
UDP-Glucose/P2Y14 Receptor Signaling Exacerbates Neuronal Apoptosis After Subarachnoid Hemorrhage in Rats
Kanamaru, H., Zhu, S., Dong, S., et al.
Journal: Stroke
Year: 2024
DOI: https://doi.org/10.1161/STROKEAHA.123.044422


 Contact Us



