Nucleotide Detection Panel — 30+ Analytes Across Purine, Pyrimidine & Cyclic Nucleotide Metabolism
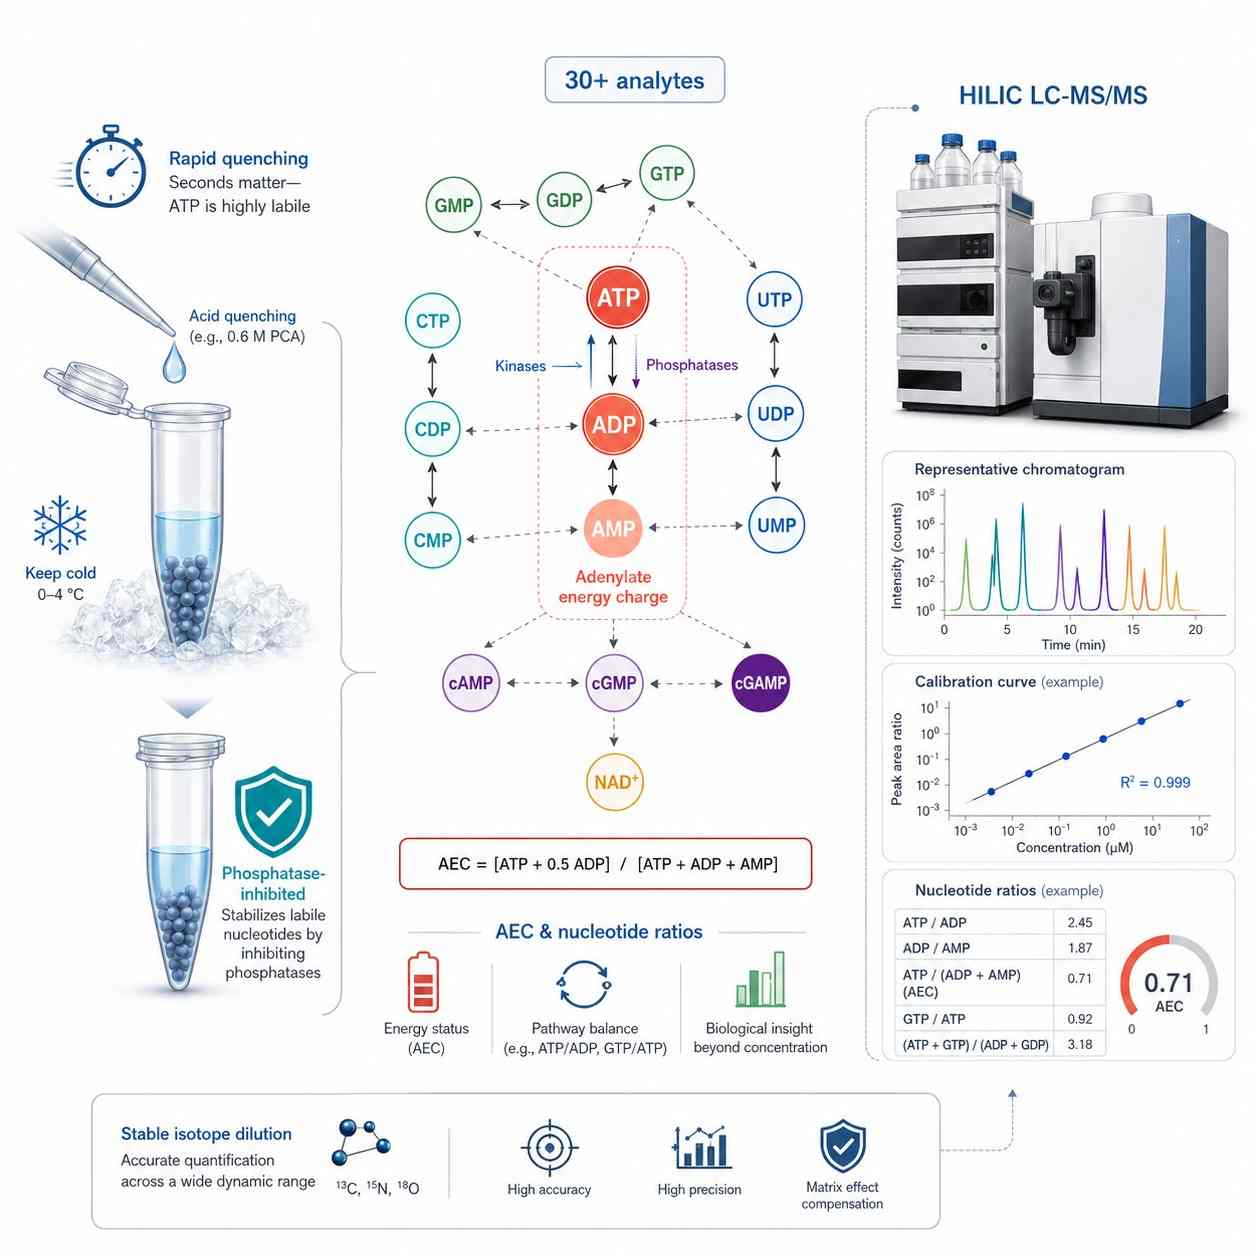
Nucleotides are quantified by HILIC LC-MS/MS on a SCIEX QTRAP 6500+ with stable isotope internal standards for each class. The panel is organized by nucleobase and phosphorylation state because the ratios — not individual concentrations — are the biologically informative readout. Energy charge (AEC), ATP/ADP ratio, UTP/CTP balance, and cAMP/cGMP levels each answer a different biological question. For purine-specific profiling, see our purine metabolism panel; for pyrimidine-focused analysis, our pyrimidine metabolism service covers UTP, CTP, TTP, and their degradation products.
Adenylates — ATP, ADP, AMP & Energy Charge
| Metabolite |
Phosphorylation |
Key Ratio & Biological Significance |
| ATP |
Triphosphate |
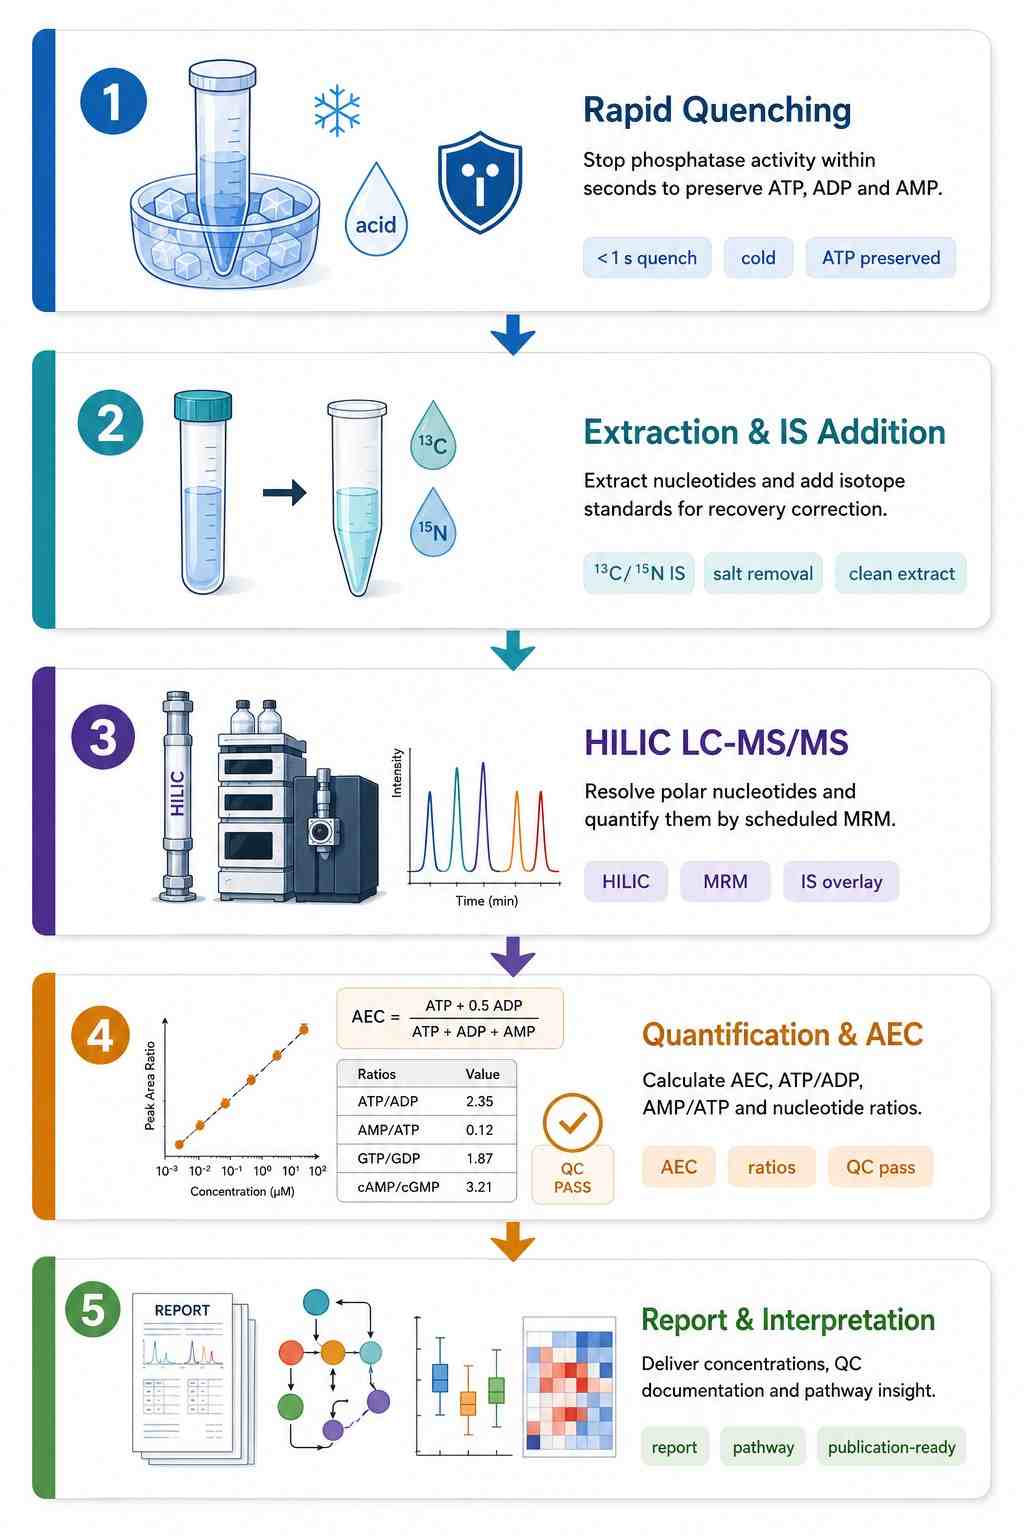
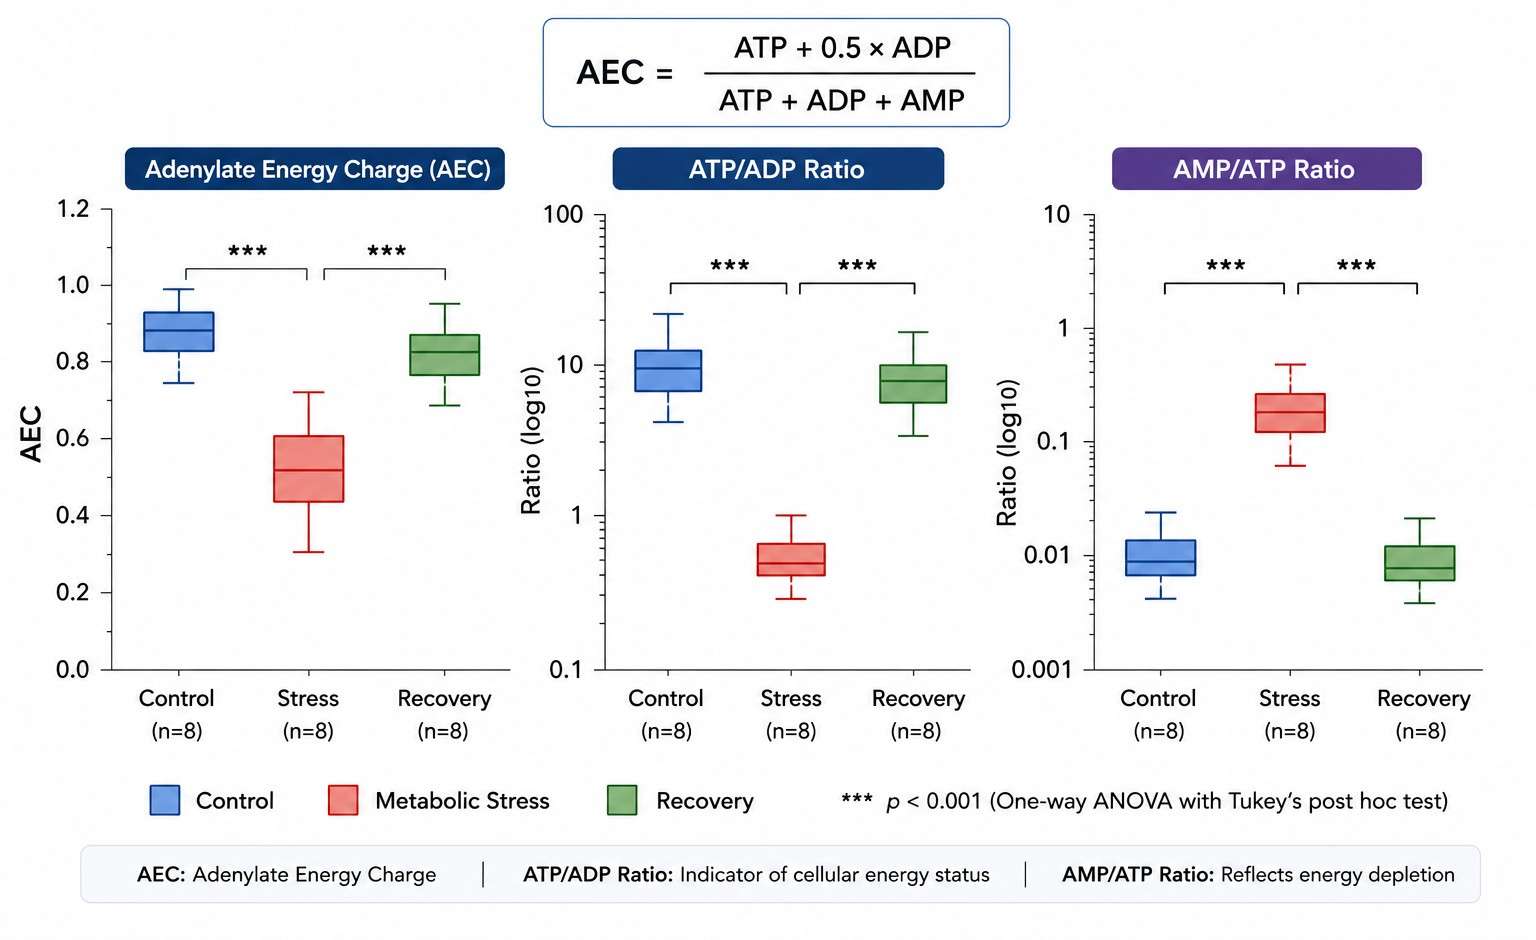
Adenylate Energy Charge (AEC) = (ATP + 0.5 ADP) / (ATP + ADP + AMP). Ranges from 0 (all AMP) to 1.0 (all ATP). Healthy cells: 0.85-0.95; metabolic stress: below 0.7. More informative than ATP alone — integrates all three phosphorylation states into a single functional index of cellular energy status. |
| ADP |
Diphosphate |
ATP/ADP ratio — direct readout of oxidative phosphorylation and glycolytic ATP production. ATP/ADP drops within seconds of hypoxia or mitochondrial inhibition. Note: a fraction of ATP fragments to ADP in the MS ion source — corrected using 13C10-ATP IS to subtract the fragmentation contribution from true ADP. Paired with AEC, distinguishes ATP consumption from ATP production failure. |
| AMP |
Monophosphate |
AMP/ATP ratio — activates AMPK when elevated. AMP is normally kept very low by adenylate kinase (2 ADP ↔ ATP + AMP). Elevated AMP signals energetic crisis and triggers catabolic reprogramming via AMPK. |
Guanylates, Uridylates & Cytidylates
| Metabolite Class |
Species |
Key Ratio & Biological Significance |
| Guanylates |
GTP, GDP, GMP |
GTP/GDP ratio — GTP is the primary energy currency for protein synthesis (translation initiation and elongation), G-protein signaling, and microtubule polymerization. GTP/GDP ratio reflects the balance of TCA cycle-derived GTP synthesis vs. macromolecular biosynthesis consumption. Depleted in rapidly proliferating cells with high translational demand. |
| Uridylates |
UTP, UDP, UMP, UDP-glucose, UDP-GlcNAc |
UTP/UDP ratio — UTP is the RNA synthesis substrate, UDP-glucose feeds glycogen synthesis, and UDP-GlcNAc drives protein glycosylation. UDP-sugar species link nucleotide metabolism to carbohydrate and glycan pathways. |
| Cytidylates |
CTP, CDP, CMP |
CTP/UTP ratio — CTP is synthesized from UTP by CTP synthetase, the rate-limiting step for phospholipid synthesis (CTP + phosphocholine → CDP-choline). CTP/UTP ratio reflects CTP synthetase activity and membrane lipid biosynthetic demand. |
Cyclic Nucleotides, Deoxynucleotides & Purine Degradation
| Metabolite Class |
Species |
Key Ratio & Biological Significance |
| Cyclic Nucleotides |
cAMP, cGMP, cGAMP (2'3'-cGAMP) |
cAMP: canonical GPCR second messenger — adenylyl cyclase converts ATP→cAMP, activating PKA and CREB-mediated transcription. cGMP: guanylyl cyclase second messenger for NO signaling and photoreception. cGAMP (2'3'-cGAMP): produced by cGAS upon cytosolic DNA sensing, activates STING — central to innate immunity, autoimmunity, and cancer immunotherapy. |
| Deoxynucleotides |
dATP, dGTP, dCTP, dTTP |
dNTP/NTP ratio — dNTP pools are cell-cycle regulated (peak in S phase) at much lower concentrations than ribonucleotides. dNTP imbalance causes replication stress and mutagenesis. Chromatographic separation from ribonucleotides is essential — ATP and dGTP share identical nominal mass. |
| Purine Degradation |
Inosine, hypoxanthine, xanthine, uric acid |
Uric acid/xanthine ratio — reflects xanthine oxidase activity at the terminal step of purine catabolism. Allantoin (further oxidized uric acid) measured in uricase-expressing species (rodents). Purine degradation products are the most stable nucleotide analytes during sample handling. |
HILIC LC-MS/MS Platform for Nucleotide Quantification
LC-MS/MS Platform
SCIEX QTRAP 6500+ with scheduled MRM acquisition. HILIC chromatography (Waters XBridge BEH Amide, 2.1 × 100 mm, 3.5 um) for retention of highly polar phosphorylated nucleotides — reversed-phase C18 alone provides insufficient retention for ATP, GTP, and other triphosphates. Ammonium formate/acetonitrile gradient with metal-chelating additive (EDTA or methylene phosphonic acid) to prevent peak tailing from nucleotide-metal ion interactions.
Stable isotope internal standards: 13C10-ATP, 13C10-ADP, 13C10-AMP, 13C10-GTP, 13C9-UTP, 13C9-CTP, d3-cAMP, d3-cGMP. Ion-pairing chromatography (dibutylammonium acetate) available as complementary method for challenging isomer separations (ATP vs dGTP share identical nominal mass).
Method Performance
| Parameter |
Specification |
| LOD |
0.1-5.0 ng/mL (species-dependent); ATP: 0.5 ng/mL, cAMP: 0.1 ng/mL, cGAMP: 0.05 ng/mL |
| Linear Range |
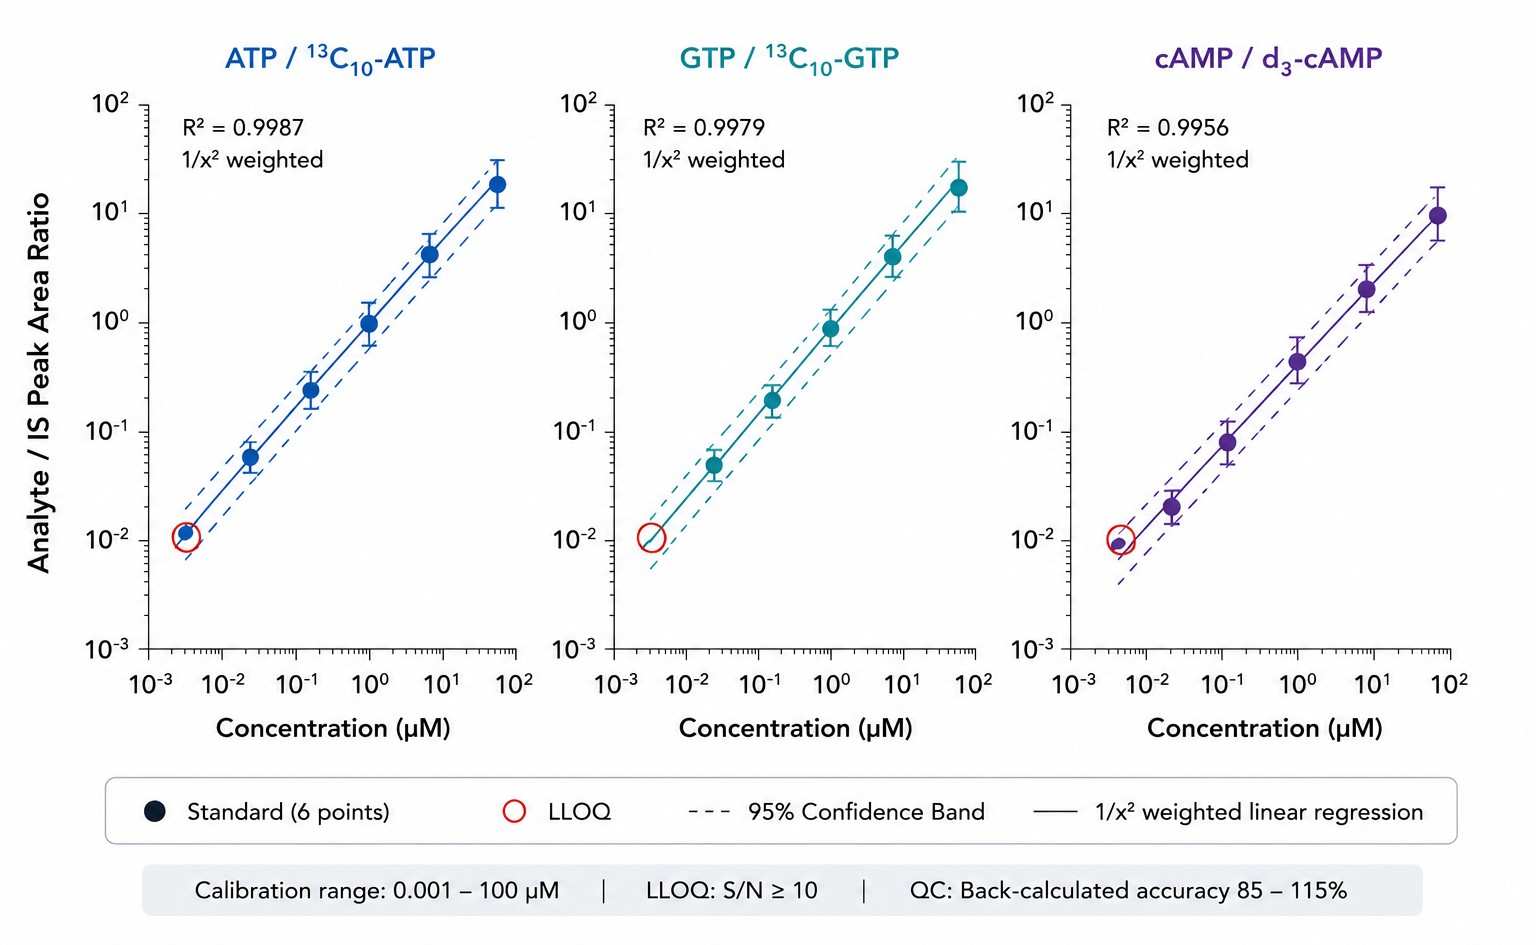
3-4 orders of magnitude; R2 above or equal to 0.995 per analyte |
| Quantification |
Absolute — stable isotope dilution with 6-point calibration, 1/x2 weighted regression |
| Precision (CV) |
Intra-batch: below 5% (ATP, ADP, AMP), below 10% (cyclic). Inter-batch: below 15% |
| Spike Recovery |
85-115% at low/mid/high QC levels |
Nucleotide Analysis Workflow — From Quenching to Energy Charge
Sample Types & Collection for Nucleotide Analysis
| Sample Type |
Minimum Amount |
Critical Handling |
Storage & Shipping |
| Cell Pellet |
1-5 x 10^6 cells |
Ice-cold PBS wash, aspirate completely. Quench with ice-cold perchloric acid or acetonitrile:methanol:water within 1 sec of harvest. ATP/ADP/AMP interconversion begins immediately upon cell disruption. Record time from harvest to quench. |
-80 degree C; dry ice |
| Tissue (Liver, Heart, Muscle, Tumor) |
20-50 mg |
Freeze-clamp with liquid N2-cooled Wollenberger tongs preferred — freezes tissue faster than immersion. For immersion: snap-freeze within 5 sec of excision. Warm ischemia time directly correlates with ATP depletion and AMP accumulation. |
-80 degree C; dry ice |
| Plasma |
100-200 uL |
EDTA with sodium fluoride (5 mg/mL) as phosphatase inhibitor. Centrifuge within 15 min at 4 degree C. Nucleotides are rapidly degraded by plasma ectonucleotidases — time-to-freeze is critical. |
-80 degree C; dry ice |
| Microbial Culture |
1-5 x 10^7 cells per replicate |
Cold methanol quenching (-40 degree C, 1:3-5 ratio) or rapid filtration + liquid N2. AEC in E. coli drops from 0.9 to 0.6 within 10 seconds of harvesting at room temperature without quenching. |
-80 degree C; dry ice |
Applications of Nucleotide Metabolism Analysis
Nucleotide Analysis Deliverables
- Quantitative Concentration Table with AEC — Absolute concentrations for all 30+ nucleotides per sample in Excel/CSV. AEC, ATP/ADP, GTP/GDP, and UTP/CTP ratios pre-calculated. LOD/LLOQ flags and IS recovery per sample.
- QC Report with AEC Tracking — Calibration curves (6-point, 1/x2 weighted, R2 and back-calculated accuracy). Pooled QC RSD per analyte. IS recovery. Pooled QC AEC trended across the batch as a built-in system suitability metric — any drift from expected AEC range flagged for review.
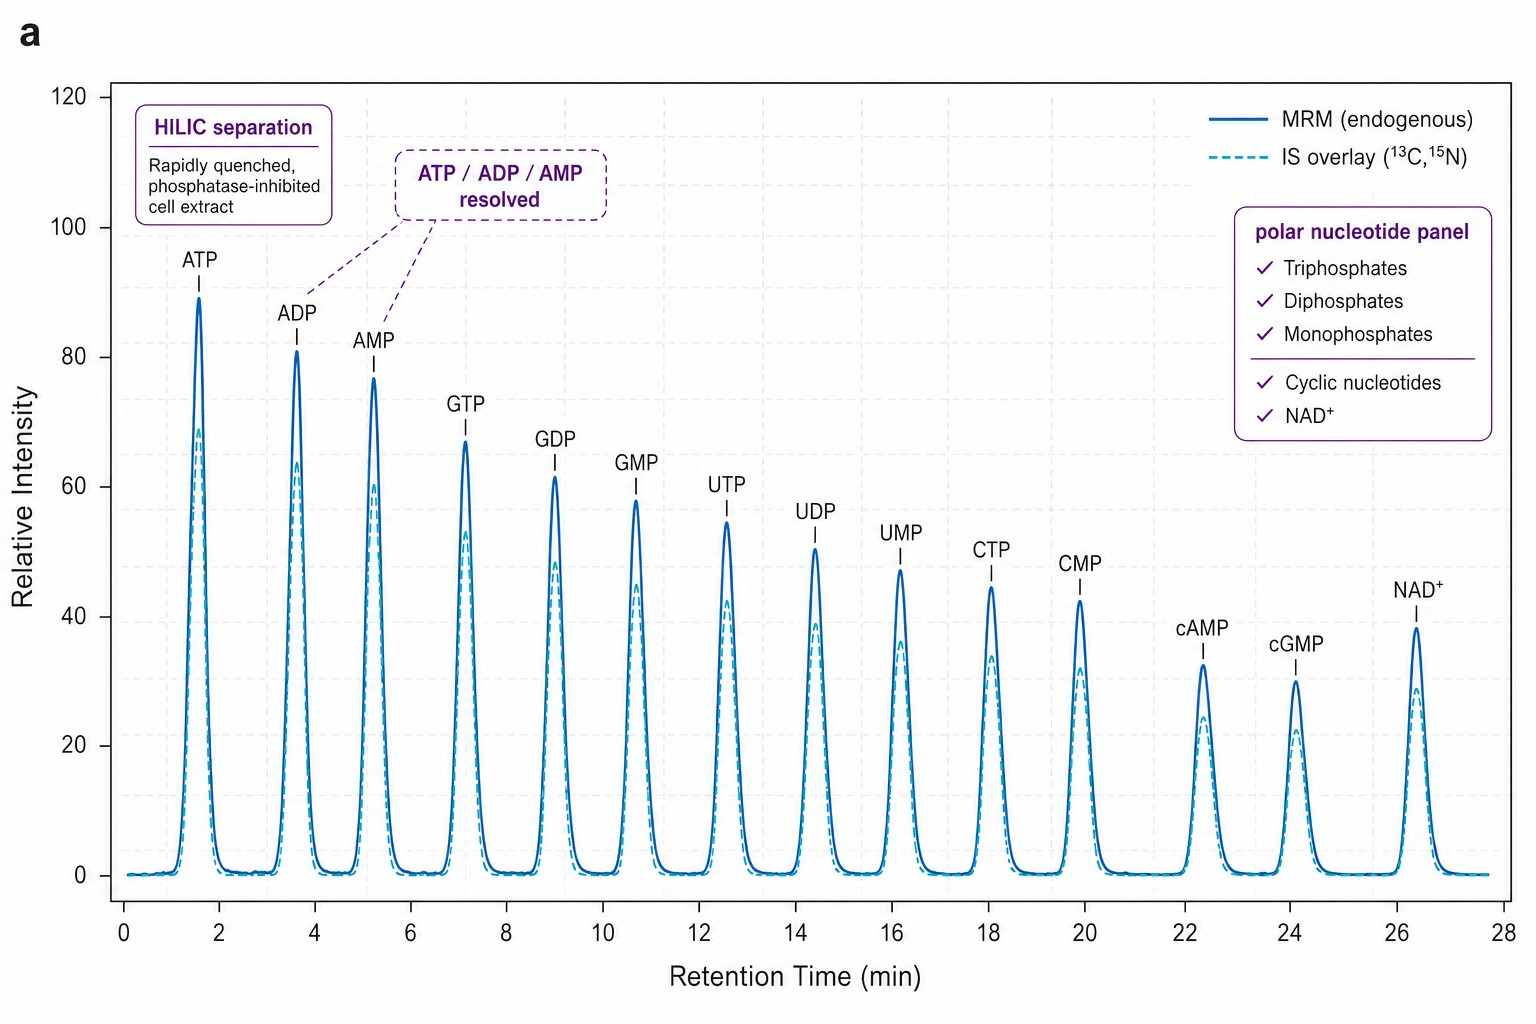
- MRM Chromatograms & Methods Documentation — HILIC MRM traces for each nucleotide class with IS overlay. ATP/dGTP isomer separation chromatogram confirming chromatographic resolution. Complete quenching protocol and LC-MS/MS parameters formatted for manuscript methods section.
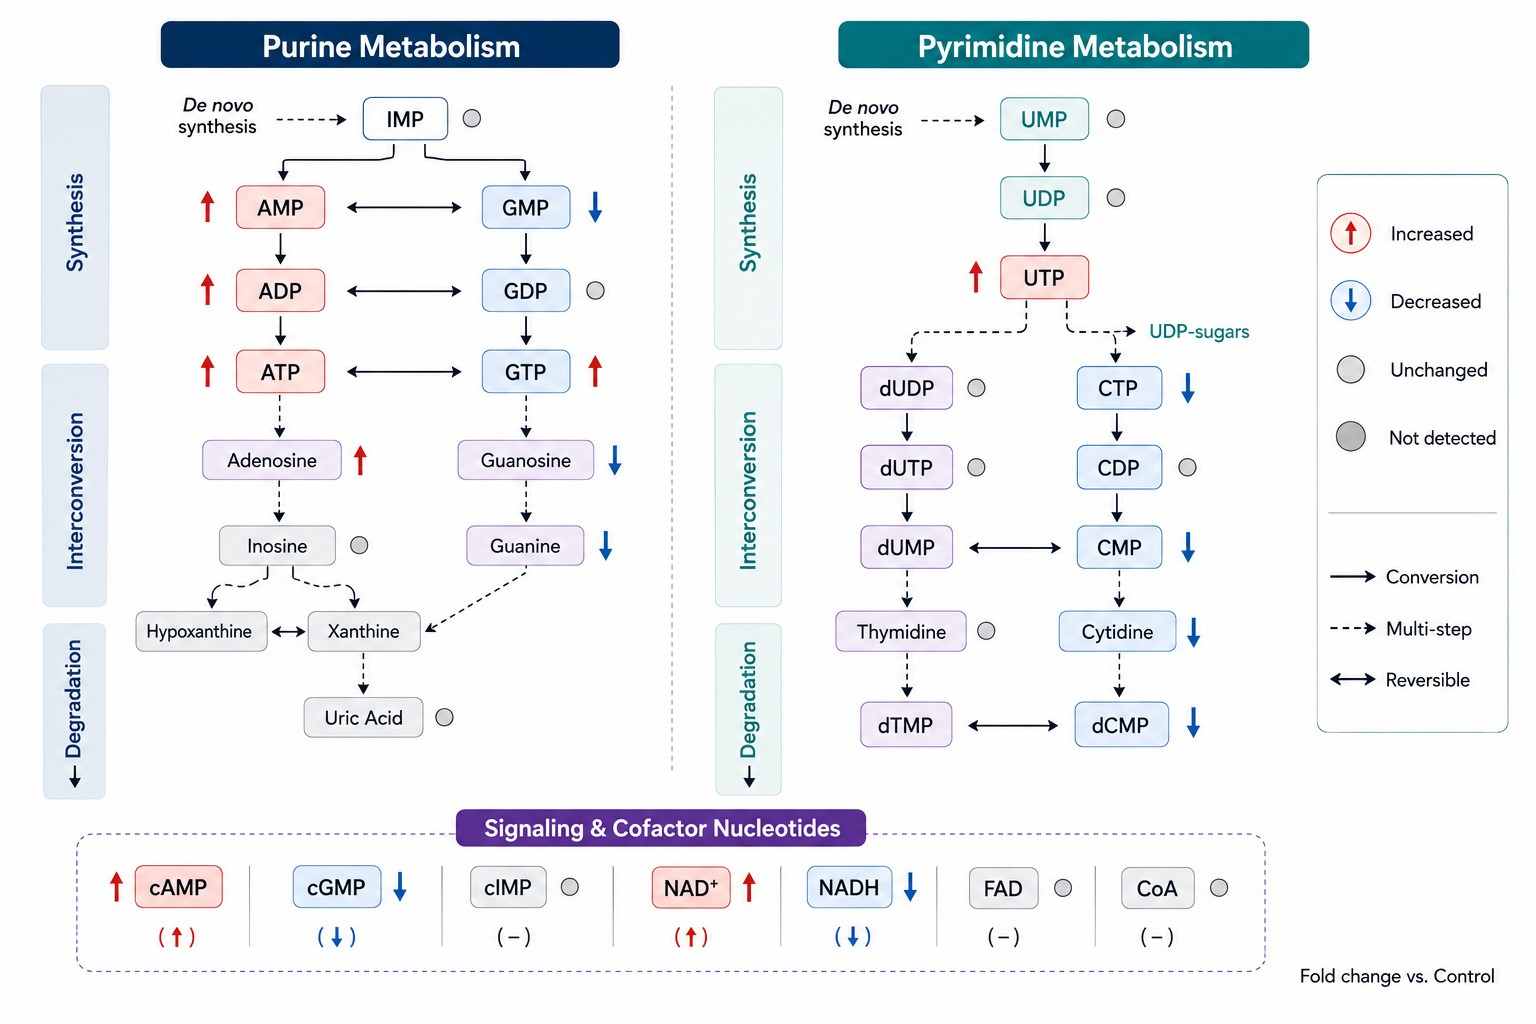
- Optional Statistical Analysis & Pathway Mapping — Group comparisons, PCA/PLS-DA, KEGG purine/pyrimidine pathway maps with detected nucleotides colored by fold-change, publication-ready figures (300 DPI TIFF + vector PDF).
Nucleotide Analysis Data — Chromatograms, Energy Charge & Pathway Maps
Case Study — How AEC and Adenylate Profiling Revealed Mitochondrial Dysfunction in Dnajc12 Knockout Mice
Central biogenic amine deficiency with concomitant exploratory behavioral deficits in Dnajc12 knock-out mice
Deng, I.B., et al. | NPJ Parkinson's Disease, 2025, 11, 42 | IF: 8.2
DOI: 10.1038/s41531-025-00991-4
The Challenge
Dnajc12 is a co-chaperone highly expressed in dopaminergic neurons. When researchers generated Dnajc12 knockout (DKO) mice, they observed profound behavioral deficits — but the biochemical mechanism was unclear. Dopaminergic neurons have exceptionally high energy demands for neurotransmitter synthesis, vesicular packaging, and maintaining membrane potential. The question was whether Dnajc12 loss affected neuronal energy metabolism — specifically the adenylate energy charge — alongside the expected neurotransmitter deficiencies. Answering this required simultaneous quantification of ATP, ADP, and AMP in brain tissue from DKO vs. wild-type mice, with the AEC calculated per sample.
The Results
Plasma and brain tissue samples were analyzed using targeted UPLC-MRM/MS on a SCIEX QTRAP 6500 Plus. The adenylate panel quantified ATP, ADP, and AMP alongside the neurotransmitter and amino acid profiles. ATP levels were reduced and the AEC shifted downward in DKO brain regions with the most severe dopaminergic deficits, while peripheral tissues showed normal AEC — confirming that Dnajc12 loss produced a tissue-specific, neuronally restricted energetic impairment, not a systemic mitochondrial defect. The AEC shift correlated with the behavioral phenotype severity across individual animals.
Why It Matters
A single ATP measurement would have shown "ATP is lower in DKO brain" — a finding of limited mechanistic value. The AEC — which integrates ATP, ADP, and AMP into a single index of cellular energy status — revealed that the energetic machinery itself was intact (ADP was appropriately phosphorylated, AMP was not accumulating) but operating at a lower setpoint. This distinction — reduced energy charge vs. energy failure — has completely different biological implications and would have been invisible without the full adenylate panel.
What This Means for You
If your experiment involves any model where cellular energy status could be altered — neurodegeneration, mitochondrial disease, cancer metabolism, ischemia, drug toxicity — measuring ATP alone is not enough. The AEC distinguishes adaptive energetic adjustments from pathological ATP depletion. Our panel quantifies all three adenylates in one HILIC LC-MS/MS injection, with AEC pre-calculated per sample.
How We Deliver the Same
- HILIC LC-MS/MS quantification of ATP, ADP, and AMP with stable isotope IS — same platform as this study
- Pre-calculated AEC per sample with pooled QC AEC tracked as system suitability indicator
- Acid quenching protocol validated to preserve in vivo phosphorylation state
Reference
- Deng, I.B., et al. Central biogenic amine deficiency with concomitant exploratory behavioral deficits in Dnajc12 knock-out mice. NPJ Parkinson's Disease 11, 42 (2025).