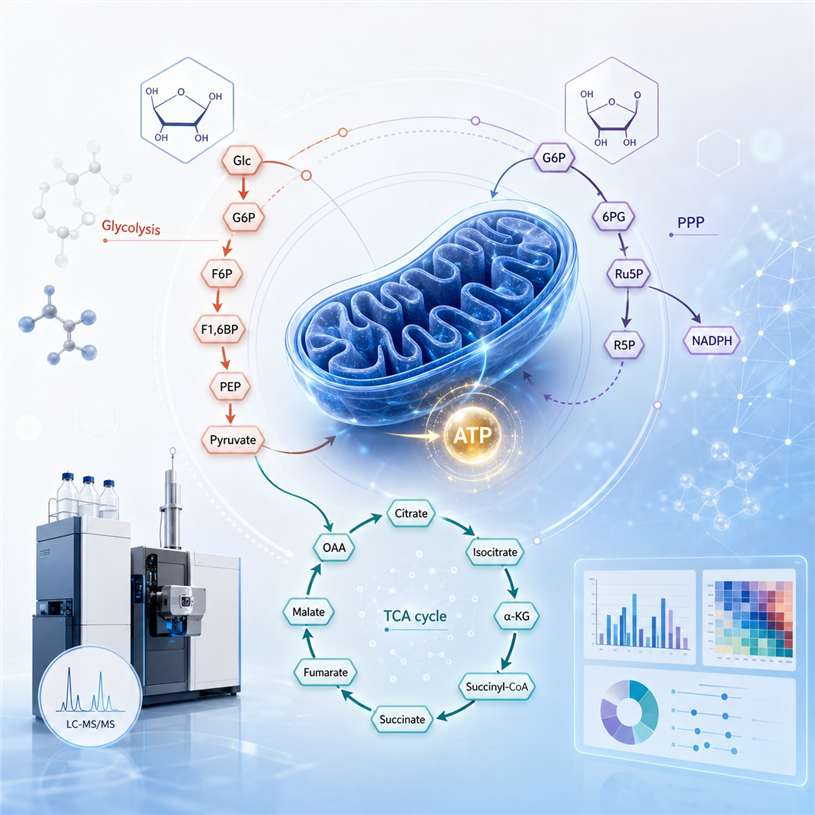
Carbohydrate metabolism encompasses glycolysis, the TCA cycle, the pentose phosphate pathway, and specialized sugar interconversion routes — pathways whose dysregulation is central to metabolic disorders, cancer metabolism, cardiovascular disease, and diabetes. Our targeted LC-MS/MS carbohydrate metabolism analysis service provides precise quantification of 100+ metabolites across 16+ pathways using isotope-labeled internal standards and rigorous QC-validated workflows, delivering accurate, reproducible data suitable for glycolysis assay development, glucose metabolic flux analysis, carbohydrate biomarker discovery, and energy metabolism profiling. For studies requiring broader metabolite coverage, our targeted metabolomics service offers expanded panels, while our central carbon metabolism analysis integrates core energy pathway readouts in a single panel.
Our Analytical Capabilities — Targeted Glycolysis Quantification & Carbohydrate Metabolite Profiling
Key Challenges in Carbohydrate Metabolism Quantification and How We Solve Them
- Accurate Quantification of Labile Glycolysis and TCA Cycle Intermediates — Glycolytic and TCA cycle intermediates (ATP, acetyl-CoA, pyruvate) are chemically unstable with rapid turnover rates. Our optimized cold-quenching protocols (≤2 min from sampling to stabilization) minimize degradation, preserving true biological snapshots for reliable glycolysis assay and TCA cycle metabolomics data.
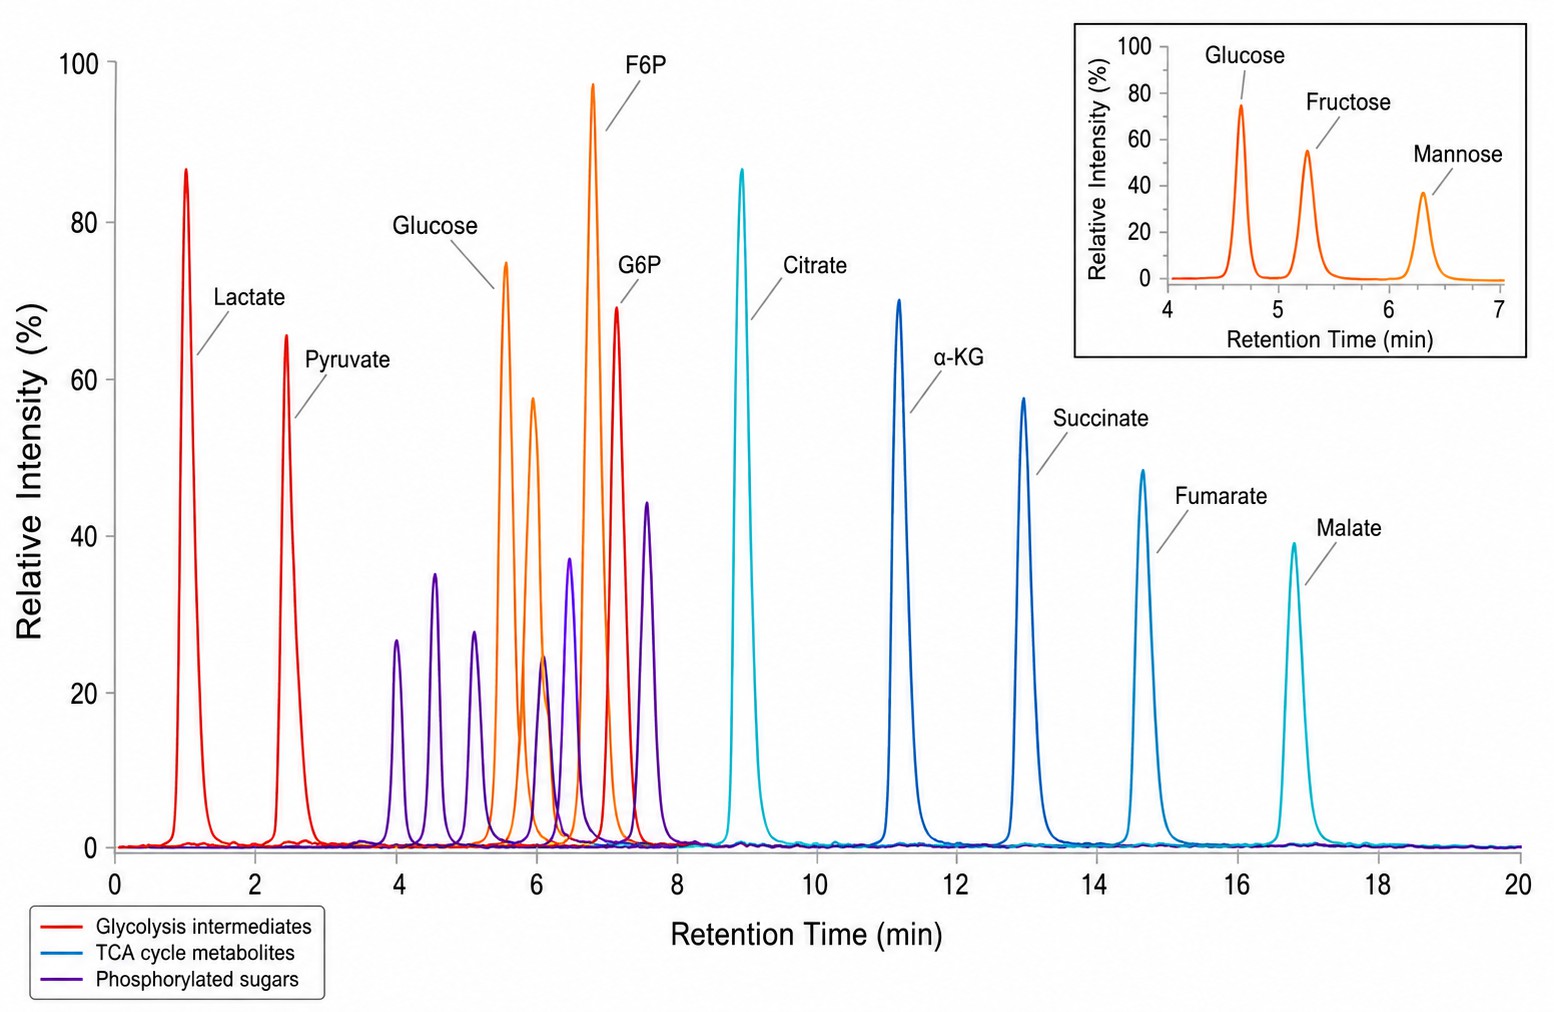
- Isomer Resolution of Closely Related Carbohydrate Species — Glucose, fructose, galactose, and mannose are structural isomers requiring high-resolution chromatography for unambiguous quantification. Our LC-MS/MS methods with specialized HILIC columns achieve baseline separation, ensuring accurate compound-specific data for sugar metabolism profiling and monosaccharide analysis.
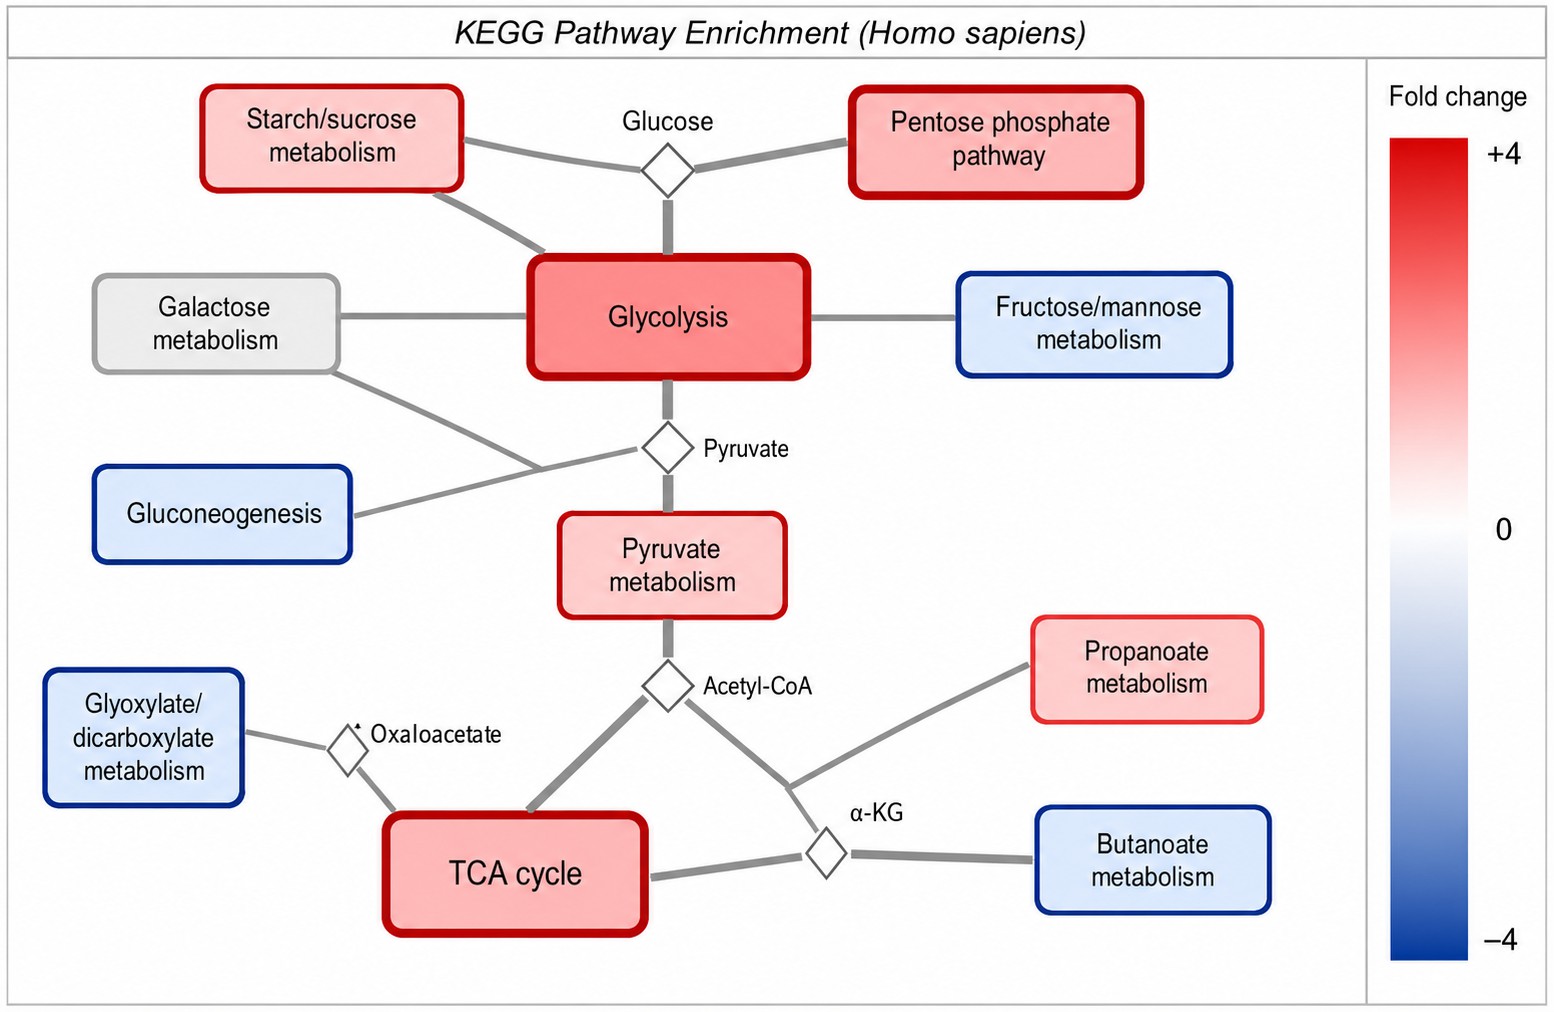
- Pathway-Level Biological Interpretation, Not Just Metabolite Lists — Beyond reporting raw concentrations, we provide pathway enrichment analysis mapping to KEGG and Reactome databases, connecting metabolite changes to dysregulated pathways — helping you identify rate-limiting steps and regulatory nodes driving your phenotype. This is particularly valuable for cancer metabolism research and metabolic disease biomarker discovery.
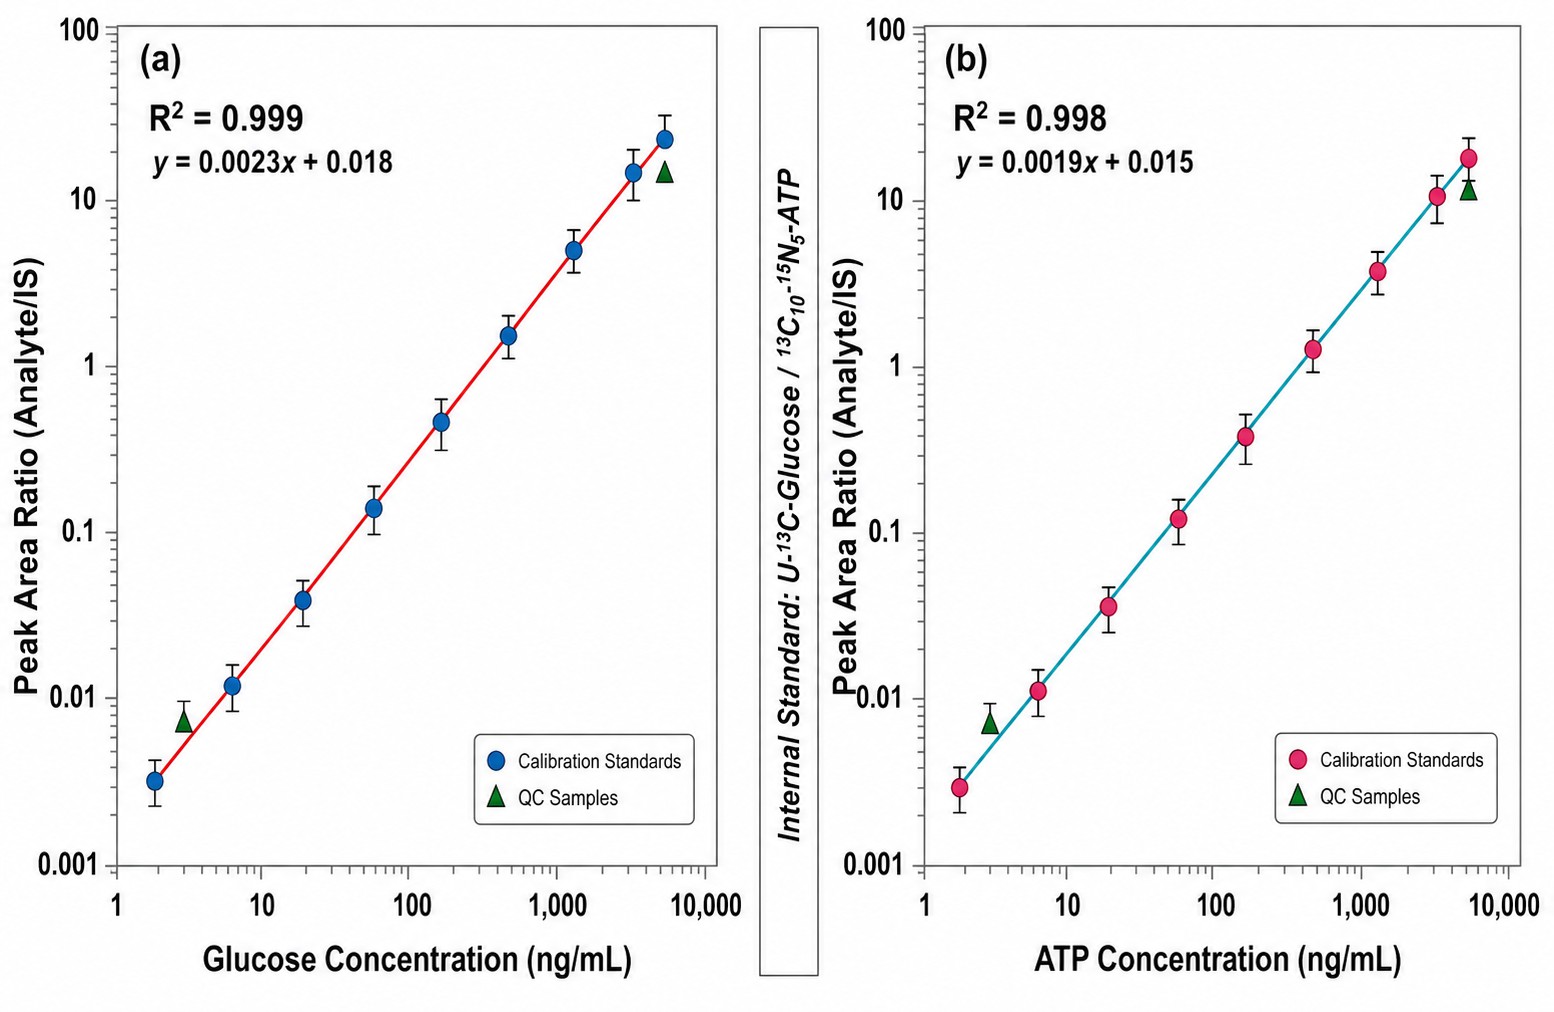
- Integration with Stable Isotope Tracing for Metabolic Flux Analysis — For researchers studying dynamic metabolic activity, our platform supports U-¹³C-glucose and other stable isotope tracer experiments, delivering isotopologue distributions that enable glycolytic flux estimation and TCA cycle flux analysis simultaneously — moving beyond static metabolite pools to reveal pathway activity rates.
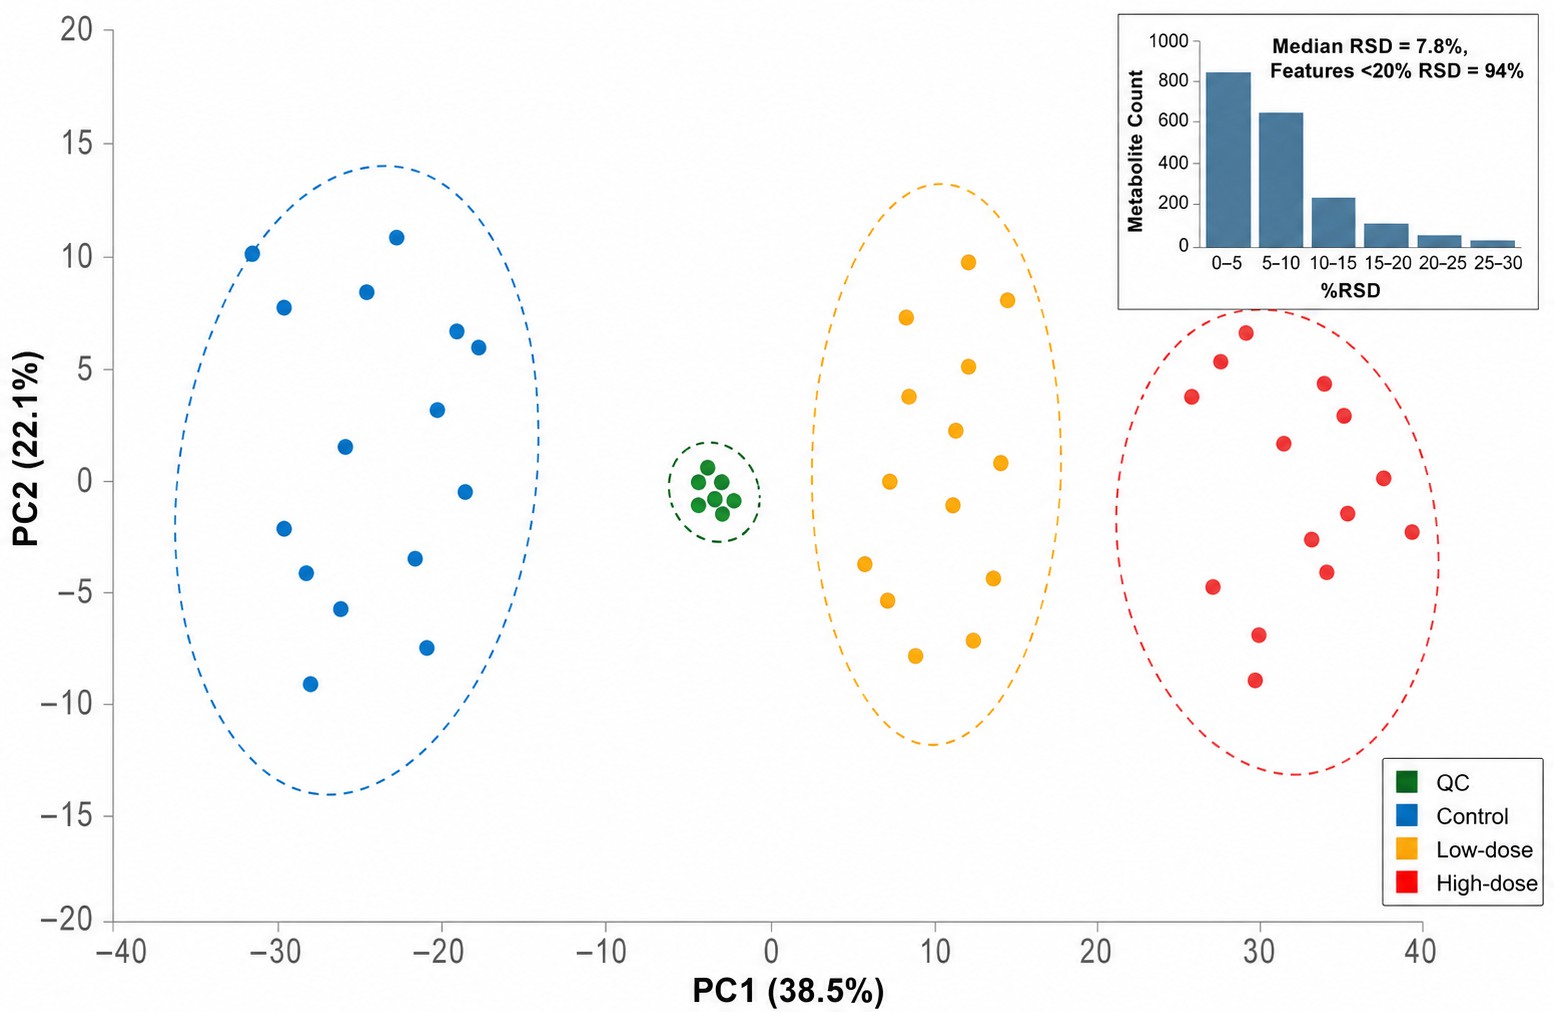
- Cross-Study Comparability Through Rigorous Quality Control — Pooled QC samples, isotope-labeled internal standards, and batch-effect correction ensure carbohydrate metabolomics data generated across different batches or projects can be compared directly — critical for longitudinal multi-cohort studies and clinical metabolomics applications.
Service Scope — Glycolysis, TCA Cycle, PPP & Sugar Metabolism Pathways
Our service covers the following pathways and compound categories across 16+ carbohydrate metabolism routes. Each panel integrates targeted LC-MS/MS methods optimized for the specific chemical properties of the analytes.
| Pathway / Category |
Detectable Compounds (Representative) |
| Central Carbon Metabolism |
| Glycolysis / Gluconeogenesis |
Glucose, Glucose-6-phosphate, Fructose-6-phosphate, Fructose-1,6-bisphosphate, Dihydroxyacetone phosphate, Glyceraldehyde 3-phosphate, 1,3-Bisphosphoglycerate, 2-Phosphoglycerate, 3-Phosphoglycerate, Phosphoenolpyruvate, Pyruvate, Lactate |
| Tricarboxylic Acid (TCA) Cycle |
Acetyl-CoA, Citrate, Isocitrate, Alpha-ketoglutarate, Succinate, Fumarate, Malate, Oxaloacetate |
| Pentose Phosphate Pathway |
6-Phosphogluconate, Ribulose 5-phosphate, Xylulose 5-phosphate, Ribose 5-phosphate, Sedoheptulose 7-phosphate, Erythrose 4-phosphate |
| Pyruvate Metabolism |
Pyruvate, Lactate, Acetyl-CoA, Oxaloacetate |
| Carbohydrate & Sugar Composition |
| Monosaccharides |
Glucose, Fructose, Galactose, Mannose, Ribose, Xylose, Arabinose, Rhamnose, Glucuronic acid, Galacturonic acid, Aminoglucose, Aminogalactose |
| Disaccharides |
Sucrose, Lactose, Maltose, Cellobiose, Fucose |
| Oligosaccharides |
Raffinose, Stachyose |
| Polysaccharides |
Starch, Glycogen, Cellulose |
| Carbohydrate Interconversion Pathways |
| Starch & Sucrose Metabolism |
Sucrose, Starch, UDP-glucose, ADP-glucose, related intermediates |
| Fructose & Mannose Metabolism |
Fructose, Mannose, Fructose-1-phosphate, Mannose-6-phosphate, related intermediates |
| Galactose Metabolism |
Galactose, Galactose-1-phosphate, UDP-galactose, Galactitol |
| Amino & Nucleotide Sugars |
N-Acetylglucosamine, N-Acetylgalactosamine, UDP-N-acetylglucosamine, Sialic acid |
| Ascorbate & Aldarate Metabolism |
Ascorbic acid, Dehydroascorbic acid, Gulonic acid, related metabolites |
| Organic Acid & Derivative Metabolism |
| Glyoxylate & Dicarboxylate Metabolism |
Glyoxylate, Glycolate, Oxalate, Tartrate, related dicarboxylates |
| Propanoate Metabolism |
Propionyl-CoA, Methylmalonyl-CoA, Succinyl-CoA, Propionate |
| Butanoate Metabolism |
Acetoacetate, Beta-hydroxybutyrate, Butyryl-CoA, Crotonyl-CoA |
| Inositol Phosphate Metabolism |
Inositol, Inositol 1-phosphate, Inositol phosphates (IP3, IP4, etc.) |
Targeted Glycolysis, TCA Cycle & Energy Cofactor Quantification Panels
In addition to pathway-level service panels, we offer focused quantification panels for researchers requiring targeted metabolite group analysis:
| Panel Name |
Detectable Compounds |
| Glycolysis / TCA / Nucleotide Panel |
Acetyl-CoA, Citrate/Isocitrate, Dihydroxyacetone Phosphate, 2-Phosphoglycerate, 3-Phosphoglycerate, 6-Phosphogluconate, 1,3-Bisphosphoglycerate, Phosphoenolpyruvate, Glyceraldehyde 3-Phosphate, Alpha-ketoglutarate, Oxaloacetate, Ribose 5-Phosphate, Erythrose 4-Phosphate, Fructose-6-phosphate, Glucose-6-phosphate, Fructose-bisphosphate |
| Energy & Redox Cofactor Panel |
AMP, ADP, ATP, FAD, NAD+, NADP+/NADPH |
| NAD-Related Substances Panel |
Nicotinic acid (NA), Quinolinic acid (QA), NAD+ Precursor (NaMN), Nicotinamide (NAM), Nicotinamide mononucleotide (NMN), Nicotinamide riboside (NR) |
For an expanded view of cellular energy metabolism, our central carbon metabolism analysis integrates glycolysis, TCA cycle, and PPP readouts in a single comprehensive panel. If your study requires detection of branched-chain energy metabolites or metabolic intermediates beyond the carbohydrate core, our polar metabolites analysis service covers a broader spectrum of charged metabolites including amino acids, organic acids, and phosphorylated intermediates.
LC-MS/MS Platform for Glycolysis, TCA Cycle & Carbohydrate Quantification
| Parameter |
Specification |
| LC-MS/MS System |
SCIEX QTRAP 6500+ series triple quadrupole MS coupled with Waters Acquity UPLC / Shimadzu Nexera LC systems |
| Ionization |
Electrospray ionization (ESI) in positive and negative ion modes with polarity switching for simultaneous detection of phosphorylated and non-phosphorylated metabolites |
| Separation Columns |
HILIC (amide/zic-HILIC) for polar carbohydrates; C18 reversed-phase for organic acids and nucleotide sugars; specialized chiral columns for enantiomer resolution where required |
| Detection Mode |
Multiple reaction monitoring (MRM) with scheduled acquisition for maximum sensitivity and specificity across 100+ analytes in a single 20-minute run |
| Calibration |
8-point standard curve with isotope-labeled internal standards (R² ≥ 0.99) spanning 4 orders of dynamic range |
| Sensitivity |
Lower limit of quantification (LLOQ) down to 0.1–10 ng/mL depending on analyte |
| Accuracy |
Spike recovery 85–115% across biological matrices; absolute concentrations reported in ng/mL, µM, or ng/mg tissue |
| Precision |
Intra-batch RSD ≤10%, inter-batch RSD ≤15% for majority of analytes |
| Quality Control |
Pooled QC samples at every 10-sample interval; blank samples and system suitability checks; batch-effect correction using QC-based normalization |
| Throughput |
Batch size up to 96 samples with comprehensive QC metrics reported for every project |
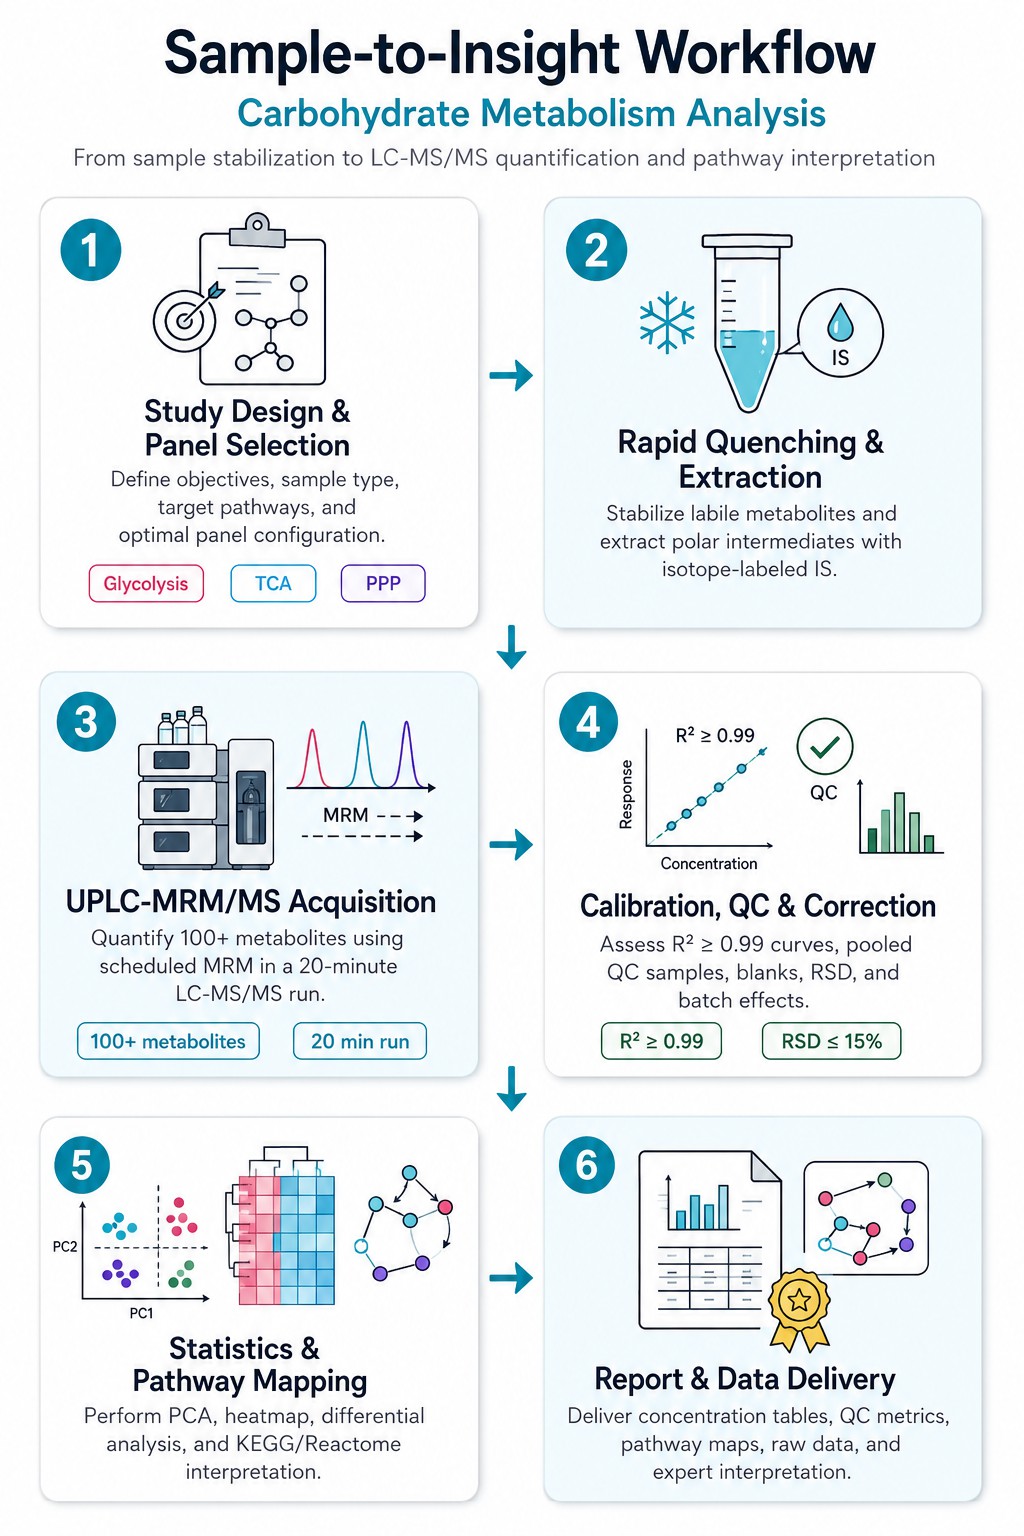
Carbohydrate Metabolism Analysis Workflow — From Sample to Quantification Report
Why Choose Our Targeted Carbohydrate Metabolism Analysis Service?
- Comprehensive Carbohydrate Pathway Coverage
Single-service access to 16+ carbohydrate metabolism pathways and 100+ individual metabolites — from glycolysis and TCA cycle to specialized sugar interconversion pathways — eliminating the need to coordinate multiple vendors for multi-pathway studies. Whether you need glycolysis quantification, TCA cycle metabolite panels, or complete central carbon metabolism analysis, our platform covers it all.
- LC-MS/MS Platform with Proven Sensitivity for Carbohydrate Detection
SCIEX QTRAP 6500+ series instruments deliver the sensitivity and specificity required for accurate quantification of low-abundance carbohydrate intermediates (LLOQ down to 0.1 ng/mL), with scheduled MRM acquisition enabling simultaneous detection of 100+ analytes — from phosphorylated glycolysis intermediates to neutral monosaccharides — in a single 20-minute run.
- Rigorous Quality Management for Publication-Ready Data
Pooled QC samples at regular intervals, isotope-labeled internal standards in every sample, calibration verification standards, and comprehensive batch-effect correction ensure carbohydrate metabolomics data quality that meets the expectations of high-impact peer-reviewed journals — critical for metabolic biomarker discovery and clinical metabolomics studies.
- Expert Metabolomics Support from PhD-Level Scientists
Our team provides end-to-end support from experimental design through data interpretation, helping you select the right panels for cancer cell metabolism, diabetes research, cardiac energy metabolism, or plant sugar metabolism profiling, and optimize sample collection protocols for reliable results.
- Flexible Project Scope for Diverse Research Needs
Services range from single-pathway targeted quantification (glycolysis assay, TCA cycle detection) to multi-pathway integrated panels, with optional stable isotope tracing for metabolic flux analysis, cross-platform data integration, and downstream bioinformatics — tailored to your specific research questions and budget.
- Custom Assay Development for Specialized Targets
For research requiring detection of unique carbohydrate metabolites, unusual matrices, or novel pathway combinations not covered by our standard panels, our method development team designs, optimizes, and validates custom LC-MS/MS assays — including stable isotope tracer method development, chiral separation of carbohydrate stereoisomers, and multi-platform integration.
Applications of Carbohydrate Metabolism Analysis — From Cancer Research to Food Science
Sample Requirements for Carbohydrate Metabolism Analysis
| Sample Type |
Minimum Amount |
Collection & Preparation |
Storage & Shipping |
| Plasma / Serum |
≥ 100 µL |
Collect in EDTA or heparin tube; centrifuge 1,500g × 10 min at 4°C; aliquot supernatant immediately; avoid hemolysis |
−80°C; ship on dry ice |
| Tissue (animal / plant) |
≥ 50 mg wet weight |
Snap freeze in liquid N₂ within 2 min of collection; remove excess blood or debris; store in pre-cooled cryovial |
−80°C; ship on dry ice |
| Cell Pellets |
≥ 1×10⁷ cells |
Wash with cold PBS (4°C); centrifuge at 500g × 5 min; remove supernatant completely; snap freeze pellet |
−80°C; ship on dry ice |
| Urine / Bile / Biofluids |
≥ 200 µL |
Centrifuge to remove particulates (10,000g × 5 min); aliquot supernatant; avoid repeated freeze-thaw cycles |
−80°C; ship on dry ice |
| Feces / Gut Content |
≥ 200 mg |
Homogenize in cold extraction solvent (methanol/water); aliquot into pre-weighed tubes |
−80°C; ship on dry ice |
| Plant Tissue / Yeast / Microorganisms |
≥ 100 mg fresh weight |
Quench in liquid N₂ immediately; lyophilize or extract in cold 70% methanol/water; centrifuge and collect supernatant |
−80°C (lyophilized: room temperature, desiccated); ship on dry ice |
Metabolomics Data Deliverables & Analysis Report
Carbohydrate Quantification Report: Absolute concentrations (ng/mL or µM) for each detected glycolysis intermediate, TCA cycle metabolite, and sugar compound across all samples, with isotope-labeled internal standard recovery data and detection limit documentation.
Quality Control Report: Calibration curves (R² ≥ 0.99), intra- and inter-batch precision (%CV <15%), QC sample performance, blank assessments, and system suitability test results — ensuring data meets publication standards.
Method Details: Complete LC-MS/MS acquisition parameters, sample preparation protocols, column specifications, MRM transition tables, and method validation data for full experimental transparency and methods section preparation.
Statistical Analysis: PCA scores plots, volcano plots, heatmaps, pathway enrichment bar charts (KEGG/Reactome), and pairwise comparison tables with fold-change and p-values — enabling identification of significant metabolic changes in glycolysis, TCA cycle, and sugar metabolism pathways.
Biological Interpretation Summary: Pathway-level interpretation connecting quantified carbohydrate metabolite changes to dysregulated biological processes, with KEGG pathway mapping and biological context for significant findings.
Raw Data Files: Vendor instrument files (.raw/.d) and processed peak lists (.mzML or equivalent open-format data matrices) for integration with other omics datasets or re-analysis.
Related Publications
Mechanisms underlying neonate-specific metabolic effects of volatile anesthetics
Stokes, J., Freed, A., Bornstein, R., et al.
Journal: eLife (2021)
DOI: https://doi.org/10.7554/eLife.65400
Service: TCA cycle, glycolysis, and related analyte quantification by LC-MS/MS
YAP mediates compensatory cardiac hypertrophy through aerobic glycolysis in response to pressure overload
Kashihara, T., Mukai, R., Oka, S.I., et al.
Journal: The Journal of Clinical Investigation (2022)
DOI: https://doi.org/10.1172/JCI150595
Service: U-¹³C-glucose stable isotope tracing by UPLC-Q-TOF MS
Insect derived extra oral GH32 plays a role in susceptibility of wheat to Hessian fly
Subramanyam, S., Nemacheck, J.A., Bernal-Crespo, V., & Sardesai, N.
Journal: Scientific Reports (2021)
DOI: https://doi.org/10.1038/s41598-021-81481-4
Service: UPLC-MS quantification of glucose and fructose with U-¹³C-labeled analogues
Insulin resistance does not impair mechanical overload-stimulated glucose uptake, but does alter the metabolic fate of glucose in mouse muscle
Weyrauch, L.A., McMillin, S.L., & Witczak, C.A.
Journal: International Journal of Molecular Sciences (2020)
DOI: https://doi.org/10.3390/ijms21134715
Service: NADP, NADPH, and 6-phosphogluconate quantification by UPLC-MRM/MS
Fructose and glucose from sugary drinks enhance colorectal cancer metastasis via SORD
Feng, T., et al.
Journal: Nature Metabolism (2025)
DOI: https://doi.org/10.1038/s42255-025-01368-w
Service: Absolute quantification of mevalonate pathway metabolites by LC-MS/MS
Proteolytic activation of fatty acid synthase signals pan-stress resolution
Wei, H., Weaver, Y.M., Yang, C., et al.
Journal: Nature Metabolism (2024)
DOI: https://doi.org/10.1038/s42255-023-00939-z
Service: Untargeted metabolomics by LC-MS
Metabolites and Genes behind Cardiac Metabolic Remodeling in Mice with Type 1 Diabetes Mellitus
Kambis, T.N., Shahshahan, H.R., & Mishra, P.K.
Journal: International Journal of Molecular Sciences (2022)
DOI: https://doi.org/10.3390/ijms23031392
Service: Individual metabolite LC-MS analysis for cardiac remodeling study
Exogenous lipase administration alters gut microbiota composition and ameliorates Alzheimer's disease-like pathology in APP/PS1 mice
Menden, A., Hall, D., Hahn-Townsend, C., et al.
Journal: Scientific Reports (2022)
DOI: https://doi.org/10.1038/s41598-022-08840-7
Service: Untargeted plasma metabolomics by UPLC-MS for Alzheimer's disease research
Polyamine metabolism impacts T cell dysfunction in the oral mucosa of people living with HIV
Mahalingam, S.S., Jayaraman, S., et al.
Journal: Nature Communications (2023)
DOI: https://doi.org/10.1038/s41467-023-36163-2
Service: Targeted metabolite quantification by LC-MS
NUDT22 promotes cancer growth through pyrimidine salvage and the TCA cycle
Walter, M., Mayr, F., Hanna, B.M.F., et al.
Journal: Oncogene (2022)
DOI: https://doi.org/10.1038/s41388-022-02462-1
Service: LC-MS nucleotide measurements for TCA cycle and pyrimidine metabolism