What is Blood / Plasma / Serum Metabolomics and Why Choose These Matrices?
Blood, plasma, and serum are among the most informative and widely used matrices in metabolomics. They integrate metabolites from multiple organs and the microbiome, providing a systemic snapshot of physiological and metabolic states. Compared with tissues, blood sampling is less invasive, more repeatable, and suitable for large-scale or longitudinal studies.
With high-resolution mass spectrometry, these matrices enable:
- Comprehensive profiling across amino acids, lipids, bile acids, and more
- Sensitive detection of biological responses to compounds, nutrition, or environmental exposures
- Robust integration with other omics for systems-level insights
Plasma (anticoagulated supernatant) and serum (post-clot fraction) each have unique characteristics, but both offer well-established, standardized protocols that support consistent, comparable, and decision-ready metabolomics data.
How to Choose Between Blood / Plasma / Serum?
| Matrix |
What it is |
When to Choose |
Key Advantages |
Things to Keep in Mind |
Best Fit (RUO) |
| WholeBlood |
Contains both the cellular fraction and plasma. |
When you need insights from both intracellular and extracellular metabolites, such as redox balance or glycolysis. |
Broad systemic snapshot including cell-derived metabolites. |
Very sensitive to handling; processing must be strict and consistent. |
Untargeted: Good
Targeted: Good |
| Plasma (EDTA / Heparin) |
The cell-free fraction obtained after anticoagulation and centrifugation. |
When you want a versatile, standardized, and widely benchmarked matrix. |
Minimizes clotting artifacts; highly reproducible; ideal for discovery and quantitation. |
Anticoagulant choice matters (EDTA for polar metabolites; heparin for lipidomics). |
Untargeted: Excellent
Targeted: Excellent |
| Serum |
The liquid fraction collected after clotting and centrifugation. |
When you rely on biobanked or legacy samples, or need comparability with published serum data. |
Broad availability in existing collections; strong alignment with literature. |
Clotting alters certain peptides/lipids; ensure clotting conditions are standardized. |
Untargeted: Good–Excellent
Targeted: Good–Excellent |
Comprehensive Blood, Plasma & Serum Metabolomics Solutions
- Broad-spectrum metabolite profiling using LC–MS (HILIC/RP, ESI±) and GC–MS (EI).
- Captures a wide range of small molecules, from amino acids and organic acids to sugars and lipids.
- Ideal for exploratory studies, biomarker discovery, and hypothesis generation.
Stable Isotope Tracing (Optional)
Bioinformatics & Statistical Support
- Advanced data processing, normalization, and metabolite annotation.
- Comprehensive statistical and pathway analyses to contextualize results.
- Designed to integrate seamlessly with multi-omics datasets.
Why Choose Our Metabolomics Analysis: Key Advantages
- Broad Metabolite Coverage
Untargeted LC–MS and GC–MS can detect >1,000 metabolites/features, spanning amino acids, organic acids, nucleotides, sugars, bile acids, and lipids.
- High Sensitivity & Reproducibility
Targeted LC–MS/MS achieves nM–pM detection limits with typical CV ≤15–20%, ensuring robust quantitation.
Workflows require only 50–200 μL per channel, enabling analysis of valuable or limited-volume samples.
Automated pipelines process hundreds of samples per week, supporting both pilot and large-cohort studies.
Profiles map to 50+ metabolic pathways, enabling system-level interpretation and integration with other omics.
- Cross-Study Comparability
Plasma and serum are the most common matrices in metabolomics publications, ensuring alignment with public datasets and literature.
Analytical Platforms for Blood, Plasma and Serum Metabolomics Services
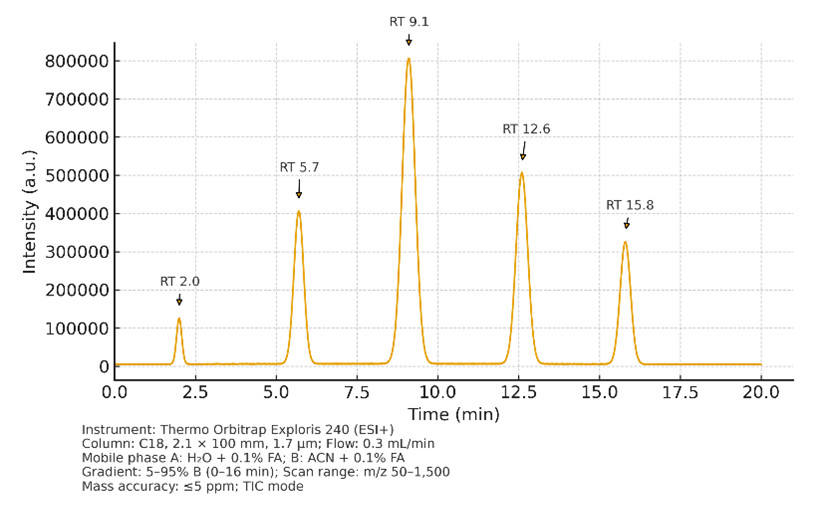
High-Resolution LC–MS (Untargeted)
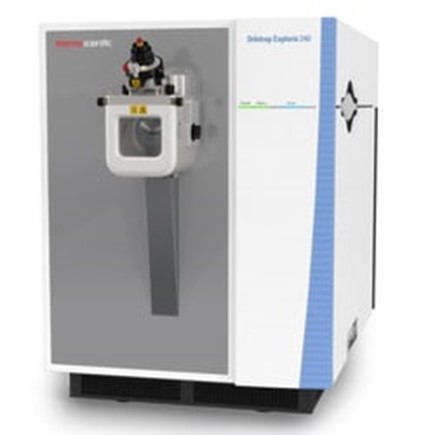
- Instruments: Thermo Orbitrap Exploris 240/480, Q Exactive
- Parameters: Resolution 60,000–120,000 FWHM, accuracy ≤5 ppm, scan range m/z 50–1,500, polarity switching
- Use: Global profiling of amino acids, organic acids, nucleotides, sugars, bile acids, and lipids
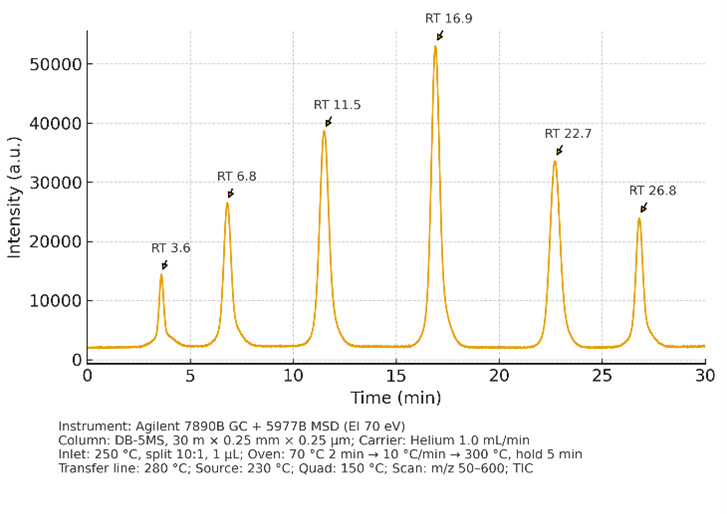
GC–MS (Volatile & Derivatized Metabolites)
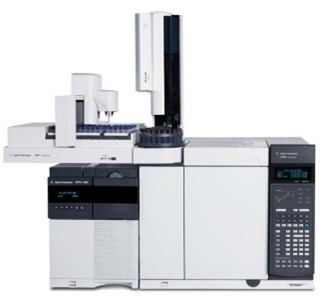
- Instruments: Agilent 7890B GC + 5977B MSD (EI, 70 eV)
- Parameters: Scan m/z 50–600, retention index calibration
- Use: Organic acids, sugars, amino acids (derivatized), SCFAs, volatiles
Triple Quadrupole LC–MS/MS (Targeted Panels)
- Instruments: Sciex 6500+ QTRAP, Agilent 6495C
- Parameters: MRM/SRM, quantitation across 3–4 orders of magnitude, LLOQ in nM–pM range
- Use: Absolute quantitation of amino acids, bile acids, acylcarnitines, TCA intermediates, biogenic amines, vitamins, lipids
Stable Isotope Tracing (Optional)
- Instruments: Orbitrap / QTOF platforms
- Parameters: Full-scan + MS/MS, isotopologue correction
- Use: Pathway routing and metabolic flux studies
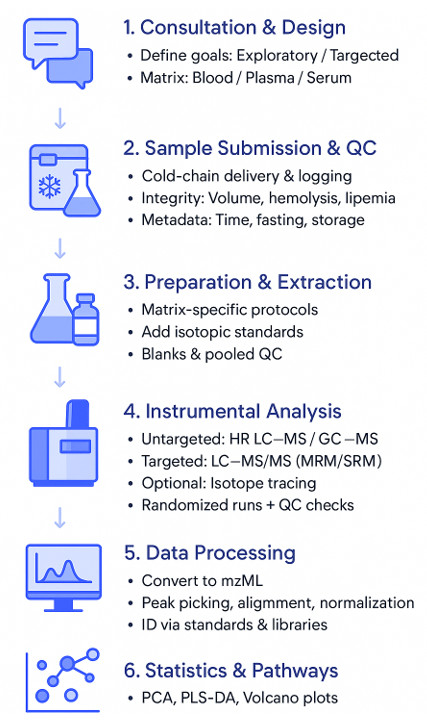
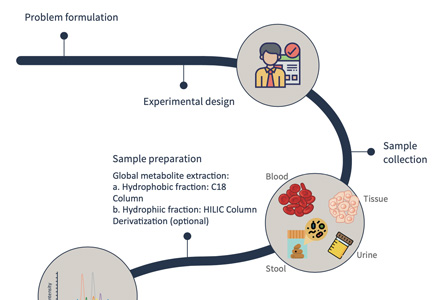
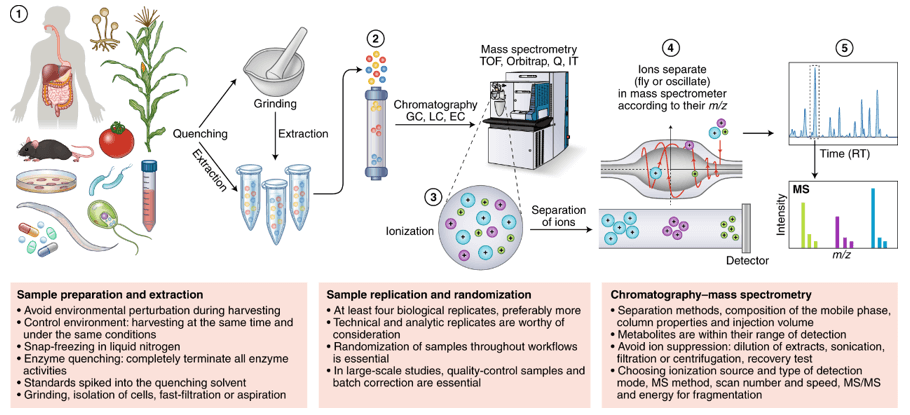
How Our Blood, Plasma & Serum Metabolomics Assay Works — Step-by-Step Process
Sample Requirements for Metabolomics Service
| Matrix |
Untargeted LC–MS* |
Targeted LC–MS/MS* |
GC–MS* |
Key Notes |
| Whole Blood |
100–200 μL |
50–100 μL |
50–100 μL |
Handling-sensitive; avoid hemolysis; chill immediately and freeze promptly. |
| Plasma (EDTA) |
100–200 μL |
50–100 μL |
50–100 μL |
Preferred for polar/untargeted work; keep cold after draw; minimize freeze–thaw. |
| Plasma (Heparin) |
100–200 μL |
50–100 μL |
50–100 μL |
Common for lipid-focused assays; keep the anticoagulant consistent across the cohort. |
| Serum |
100–200 μL |
50–100 μL |
50–100 μL |
Standardize clot time/temperature; centrifuge promptly; document pre-analytical variables. |
*Volumes are per single analytical channel. For multi-channel designs (e.g., untargeted + targeted + GC–MS), sum the volumes and add 10–20% reserve for repeats/QC.
General Rules for Sample Handling
- Aliquot: 50–100 μL per cryovial; prepare enough to avoid repeat freeze–thaw.
- Storage: Low-bind screw-cap tubes, -80°C; ship on dry ice.
- Metadata: Record anticoagulant type, hemolysis/lipemia, diet/fasting, clot time (serum), storage history.
- Consistency: Use one matrix + one anticoagulant across the study.
- Micro-volume: Low-volume workflows available on request.
Deliverables: What You Receive from Our Blood / Plasma / Serum Metabolomics Analysis
- Raw data files: instrument vendor formats (e.g., .raw, .wiff) and converted open formats (.mzML*).
- Processed datasets: feature/peak tables with retention time, m/z, intensities, and metabolite annotations (with MSI confidence levels).
- Quantitative results: absolute concentrations for targeted panels; normalized relative abundances for untargeted assays.
- QC reports: summaries of internal standards, pooled QCs, blanks, and key acceptance metrics (mass accuracy, %CV, retention time stability).
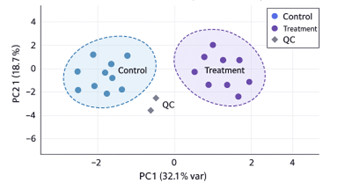
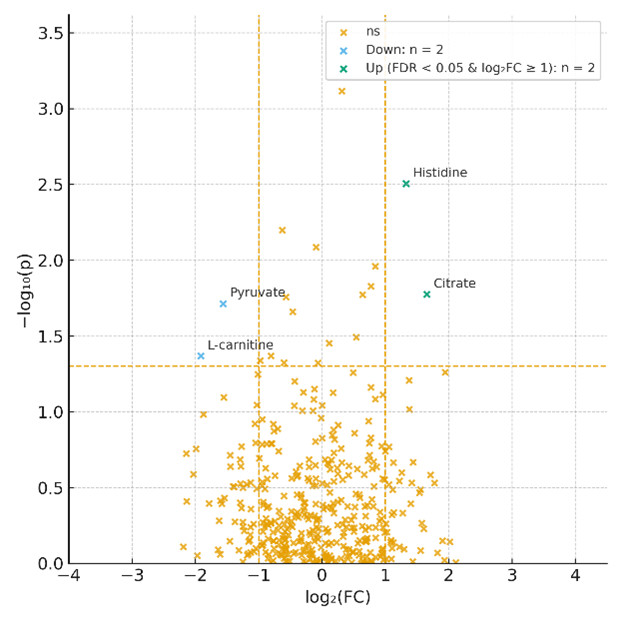
- Statistical outputs: PCA, PLS-DA, volcano plots, clustering heatmaps, and pathway enrichment results (KEGG, Reactome, LIPID MAPS).
Methyl donor supplementation reduces phospho‐Tau, Fyn and demethylated protein phosphatase 2A levels and mitigates learning and motor deficits in a mouse model of tauopathy
van Hummel, A., Taleski, G., Sontag, J. M., Feiten, A. F., Ke, Y. D., Ittner, L. M., & Sontag, E.
Journal: Neuropathology and Applied Neurobiology
Year: 2023
Exogenous lipase administration alters gut microbiota composition and ameliorates Alzheimer's disease-like pathology in APP/PS1 mice
Menden, A., Hall, D., Hahn-Townsend, C., Broedlow, C. A., Joshi, U., Pearson, A., ... & Ait-Ghezala, G.
Journal: Scientific Reports
Year: 2022
Quantification of choline in serum and plasma using a clinical nuclear magnetic resonance analyzer
Garcia, E., Shalaurova, I., Matyus, S. P., Wolak-Dinsmore, J., Oskardmay, D. N., & Connelly, M. A.
Journal: Clinica Chimica Acta
Year: 2022
Function and regulation of a steroidogenic CYP450 enzyme in the mitochondrion of Toxoplasma gondii
Asady, B., Sampels, V., Romano, J. D., Levitskaya, J., Lige, B., Khare, P., ... & Coppens, I.
Journal: PLoS Pathogens
Year: 2023