What One Carbon Metabolism Analysis Measures
One-carbon units are single-carbon groups — methyl, methylene, methenyl, formyl, and formimino — that
cannot exist free in a cell. They are carried on tetrahydrofolate (THF) and handed to three competing
destinations: nucleotide synthesis, homocysteine remethylation, and the methyltransferase reactions that set
DNA, histone, and protein methylation. We quantify the folate vitamer ladder, the methionine cycle, and the
transsulfuration branch from a single extract by targeted LC-MS/MS, and report the derived indices —
methylation potential, vitamer partitioning, and the pre-analytical oxidation flag — beside the
concentrations rather than leaving them to be calculated afterwards.
Serine is the main supply route into the network, so serine and
glycine availability sets how much methylene carbon the pool can carry at all; glycine, choline,
betaine, histidine, and formate add to that supply. From there the network has three measurable outputs, and
they answer different questions. The distribution of carbon forms across THF says how the folate pool is
loaded — which matters when methylenetetrahydrofolate reductase activity is restricted and the pool
accumulates in the methyl form. The ratio of S-adenosylmethionine to S-adenosylhomocysteine says how much
methylation capacity is actually available, because S-adenosylmethionine is the methyl donor for nearly
every cellular methyltransferase and S-adenosylhomocysteine is the product that inhibits them. The
transsulfuration branch, which routes homocysteine through cystathionine to cysteine and then to
glutathione, says what happens to homocysteine that is not remethylated, and how much reducing capacity the
cell can build from it.
One caution belongs in the interpretation of any one-carbon dataset. Concentrations report the size of a
pool, not the rate of flow through it: a methyl donor can raise a metabolite pool without changing how
quickly that metabolite is consumed. Compartmentation adds a second layer — mitochondria and the cytosol run
separate one-carbon pools on different enzyme sets, so a total lysate averages a cytosolic increase against
a mitochondrial decrease and reports no change. We state these limits in the report rather than leaving them
for the reader to discover.
One Carbon Metabolism Panel — Folate Vitamers, Methionine Cycle & Transsulfuration
The panel follows the network rather than stopping at one branch, because the branches are what constrain
each other. Each segment answers a specific question, and the composition is adjusted at study design to the
matrices and comparisons you plan to run.
| Panel Segment |
Representative Analytes |
What It Answers |
| Folate vitamer pool |
THF, 5-methyl-THF, 5,10-methylene-THF, 5,10-methenyl-THF, 10-formyl-THF, 5-formyl-THF, folinic
acid, dihydrofolate, and MeFox reported as a separate measurand |
Which carbon form the THF pool is carrying, and whether methyl folate has accumulated at the
expense of the non-methyl forms. Where the folate branch is the study question on its own, the same
analytes are read as folate-bound one-carbon
pools, resolved vitamer by vitamer instead of reported as a single total. |
| Methionine cycle |
Methionine, S-adenosylmethionine (SAM),
S-adenosylhomocysteine (SAH), homocysteine, cystathionine |
Methylation potential and remethylation capacity, built from SAM and SAH extracted and acquired in the
same run, so the ratio comes from one recovery rather than two. Accuracy of both analytes is the
whole value of the index. |
| Transsulfuration and redox |
Cysteine, cystine, glutathione (GSH), glutathione disulfide (GSSG), taurine |
Whether homocysteine is being cleared through cystathionine, and how much reduced antioxidant
capacity the sample carries. The GSH/GSSG
pair is the endpoint of that same branch, so it is reported as both the redox ratio and the
transsulfuration output. |
| Methyl donors and sources |
Choline, betaine, dimethylglycine, sarcosine, serine, glycine |
Substrate supply entering the network, including the microbial contribution to circulating choline
derivatives. Choline and its methylated
derivatives are quantified with betaine and dimethylglycine, because the donor pool is only
interpretable as a set — one methyl donor can compensate for another. |
| Cofactors |
Vitamin B12 (as methylcobalamin), vitamin B6 (pyridoxal-5-phosphate), riboflavin, folate |
Whether the enzymes that move one-carbon units have the cofactors they depend on. Methionine
synthase needs B12; transsulfuration needs B6. |
| Nucleotide branch |
dUMP, dTMP, and selected deoxynucleoside precursors where the study requires them |
Whether one-carbon supply is limiting thymidylate synthesis — the readout that connects the
network to proliferation and to antifolate or thymidylate synthase-directed treatment. |
Not every analyte is measurable in every matrix, and the achievable limit of quantification differs between
a tissue extract with high folate content and a low-volume serum sample. Panel feasibility is confirmed
against your matrices before analysis begins. Where the methionine cycle is the central question rather than
one branch of a larger network, the panel and the normalization scheme are configured around that cycle
alone.
Key Challenges in One Carbon Metabolism Analysis and How We Solve Them
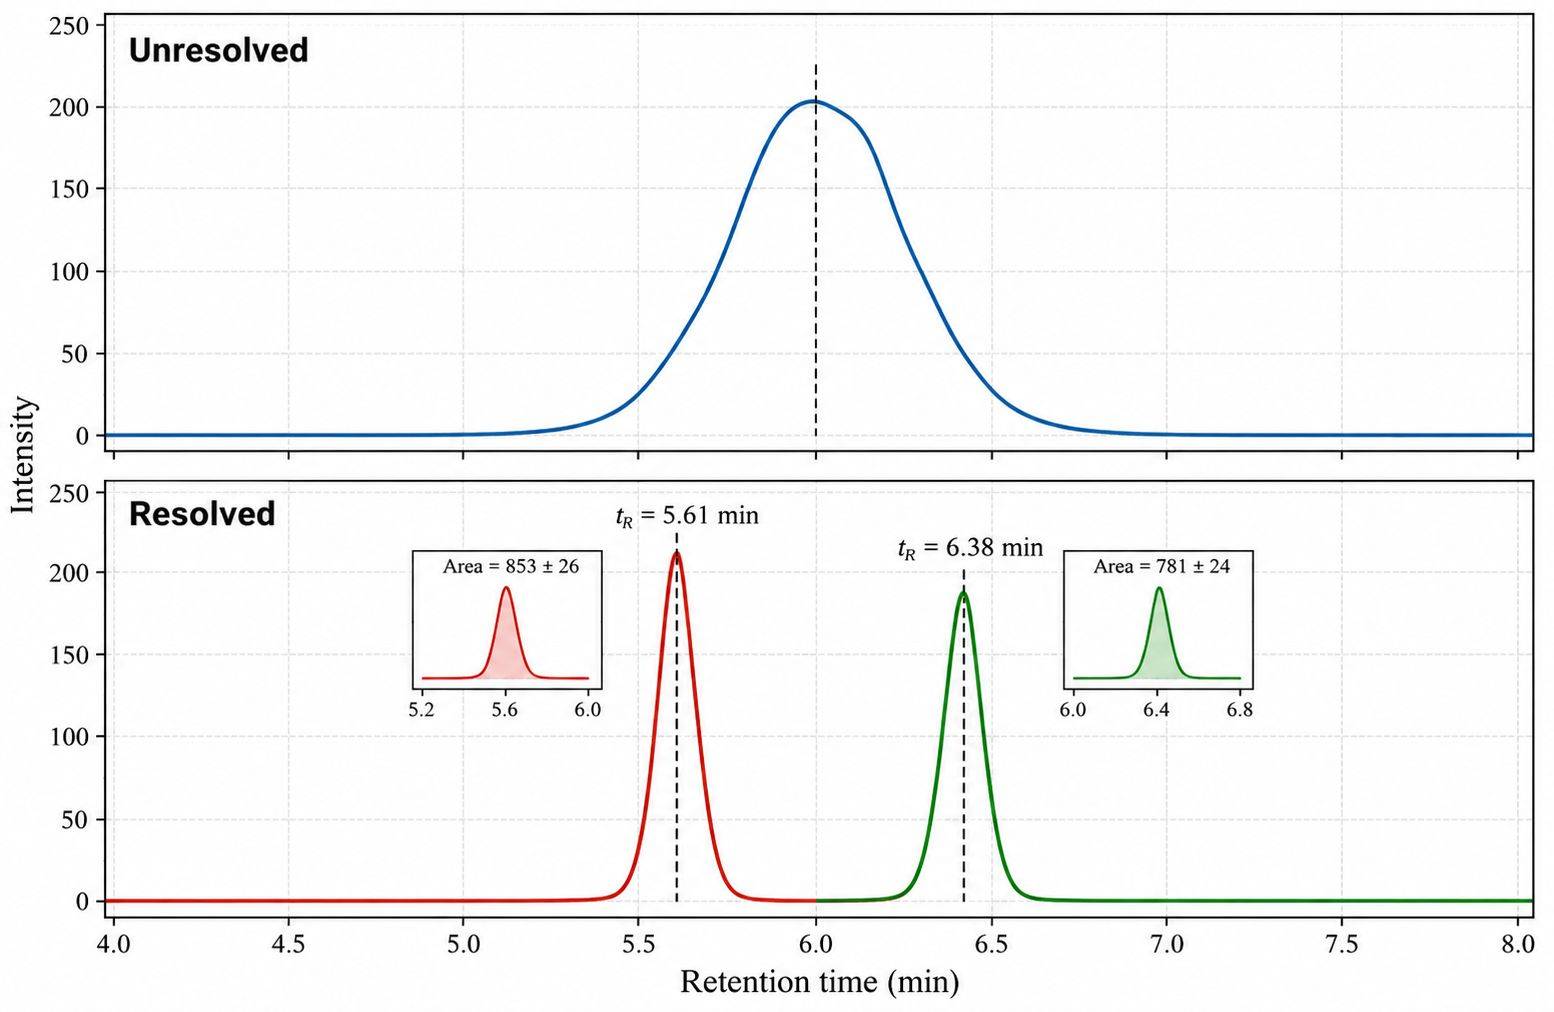
- MeFox and 5-Formyltetrahydrofolate Are Isobaric — 5-methyl-THF oxidizes through
5-methyldihydrofolate into MeFox, a biologically inactive product that shares its mass with 5-formyl-THF
and produces the same precursor-to-product transition. A method that does not separate the pair records
MeFox as folate and inflates total folate by an amount that varies from sample to sample. We resolve the
isobaric pair and report MeFox as its own analyte, so an elevated MeFox-to-5-methyl-THF ratio flags folate
that oxidized during collection or storage.
- Intracellular Folates Arrive as Polyglutamates — Inside the cell, folates carry a
poly-γ-glutamyl tail that prevents direct measurement by reversed-phase separation, so deconjugation is
required — and the conventional way to run it, holding the lysate at body temperature for hours, is the
condition under which labile vitamers degrade. Enzymatic deconjugation with a γ-glutamyl hydrolase reaches
the same completeness far more quickly. Direct measurement in washed red cells has run about 15 percent
below the whole-blood lysate value.
- Stabilization Is Matrix-Specific, Not Universal — Ascorbate holds folates in their
reduced state, but the concentration and pH have to be matched to the sample type: whole blood stored in
ascorbate solution at low pH lost 53 to 90 percent of its non-methyl folate fraction — a stabilization
step that destroyed the analytes it was meant to protect. Prolonged thawing also produces measurable
5-methyl-THF loss. We assign the buffer, pH, light protection, and hold time to each matrix in advance.
- SAM and SAH Need Different Chemistry From the Folate Ladder — S-adenosylmethionine and
S-adenosylhomocysteine are acid-labile and their recovery is strongly matrix-dependent, so the methylation
potential ratio is only interpretable when both are extracted and acquired under identical conditions in
the same run. Our extraction for the methionine-cycle analytes is handled separately from the folate
ladder, and both are spiked with isotope-labeled standards at the earliest point in processing, so
recovery is corrected per sample.
- A Whole-Cell Lysate Blends Two Pools — Mitochondria and the cytosol run distinct
one-carbon pools on distinct enzymes — MTHFD2 and SHMT2 in the mitochondrion, MTHFD1 and SHMT1 in the
cytosol — with different directions of flux, and a total lysate averages them. For most designs that total
is the intended measurement, but it cannot show a redistribution between compartments. Where the question
requires it, we fractionate before extraction and report the pools separately.
One Carbon Metabolism Indices — Methylation Potential, Remethylation & Transsulfuration
Ratios
Concentrations alone rarely answer the question a one-carbon study was designed around, so every dataset is
delivered with the derived values that carry the biological signal. Each index is computed from analytes
quantified in the same batch, and the report states which samples entered each calculation.
| Index |
How It Is Computed |
What a Shift Indicates |
| Methylation potential |
SAM divided by SAH, both quantified in the same run |
A fall indicates reduced methyltransferase capacity or SAH accumulation from impaired clearance;
this is the index most often linked to epigenetic endpoints. |
| Vitamer partitioning |
5-methyl-THF as a fraction of total folate vitamers |
A shift toward methyl folate with a depleted non-methyl fraction is the signature of restricted
methylenetetrahydrofolate reductase activity — the folate trap. |
| Pre-analytical oxidation load |
MeFox divided by 5-methyl-THF |
A quality flag rather than a biological endpoint: a high value means folate oxidized during
collection or storage, and the vitamer data from that sample should be interpreted with caution.
|
| Remethylation balance |
Homocysteine read against 5-methyl-THF and methionine |
Separates a supply problem — low methyl folate or low B12 — from a clearance problem in the
transsulfuration or renal route. |
| Transsulfuration output |
Cystathionine, cysteine, and the GSH/GSSG ratio |
Whether homocysteine is being routed toward antioxidant capacity, and whether the redox buffer is
under strain. |
| Serine–glycine handling |
Serine and glycine, with serine synthesis pathway intermediates where requested |
Direction of the serine hydroxymethyltransferase reaction, which sets how much of the one-carbon
supply is generated from scratch rather than salvaged. |
Analytical Platform & Method for One Carbon Metabolism Profiling
Platform
- Chromatographic separation — UHPLC with a
polar-endcapped or pentafluorophenyl stationary phase, chosen for the resolution of the isobaric and
oxidation-related pairs in the folate pool. Mobile phases are formic acid-based so that the same
separation serves both ion modes.
- Quantification — triple quadrupole mass spectrometry in
scheduled multiple reaction monitoring, acquiring in positive and negative ion mode within one
injection for the analytes that require each.
- Structural confirmation — high-resolution accurate mass
acquisition on an Orbitrap platform for unexpected vitamer species, oxidized forms, and any analyte
whose identity needs confirmation beyond its transition ratio.
- Internal standards — stable isotope-labeled analogues
spiked before extraction for SAM, SAH, homocysteine, methionine, and the folate vitamers, so that
recovery and matrix effects are corrected for each sample individually.
- Batch structure — calibration standards and pooled
quality control samples are interleaved through every acquisition batch, and all groups belonging to
one comparison are acquired together.
Method Performance
| Parameter |
What We Report |
| Calibration |
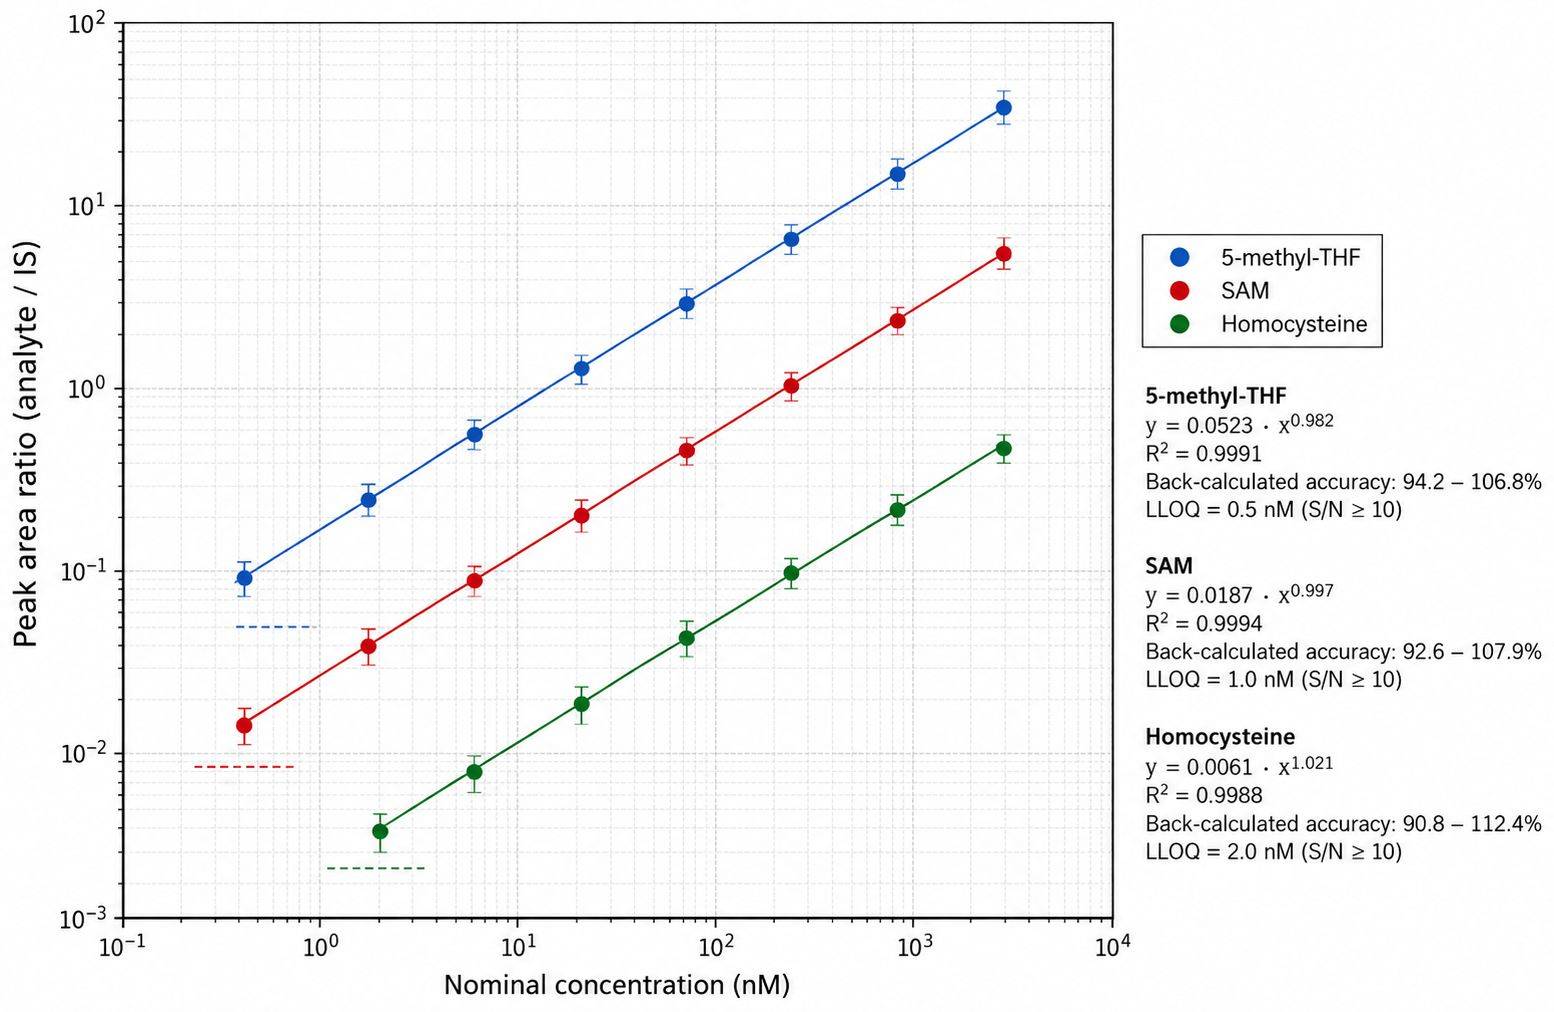
Matrix-matched curves with weighted regression; R² ≥ 0.995 for analytes covered by authentic
standards, with back-calculated accuracy at every level. |
| Precision |
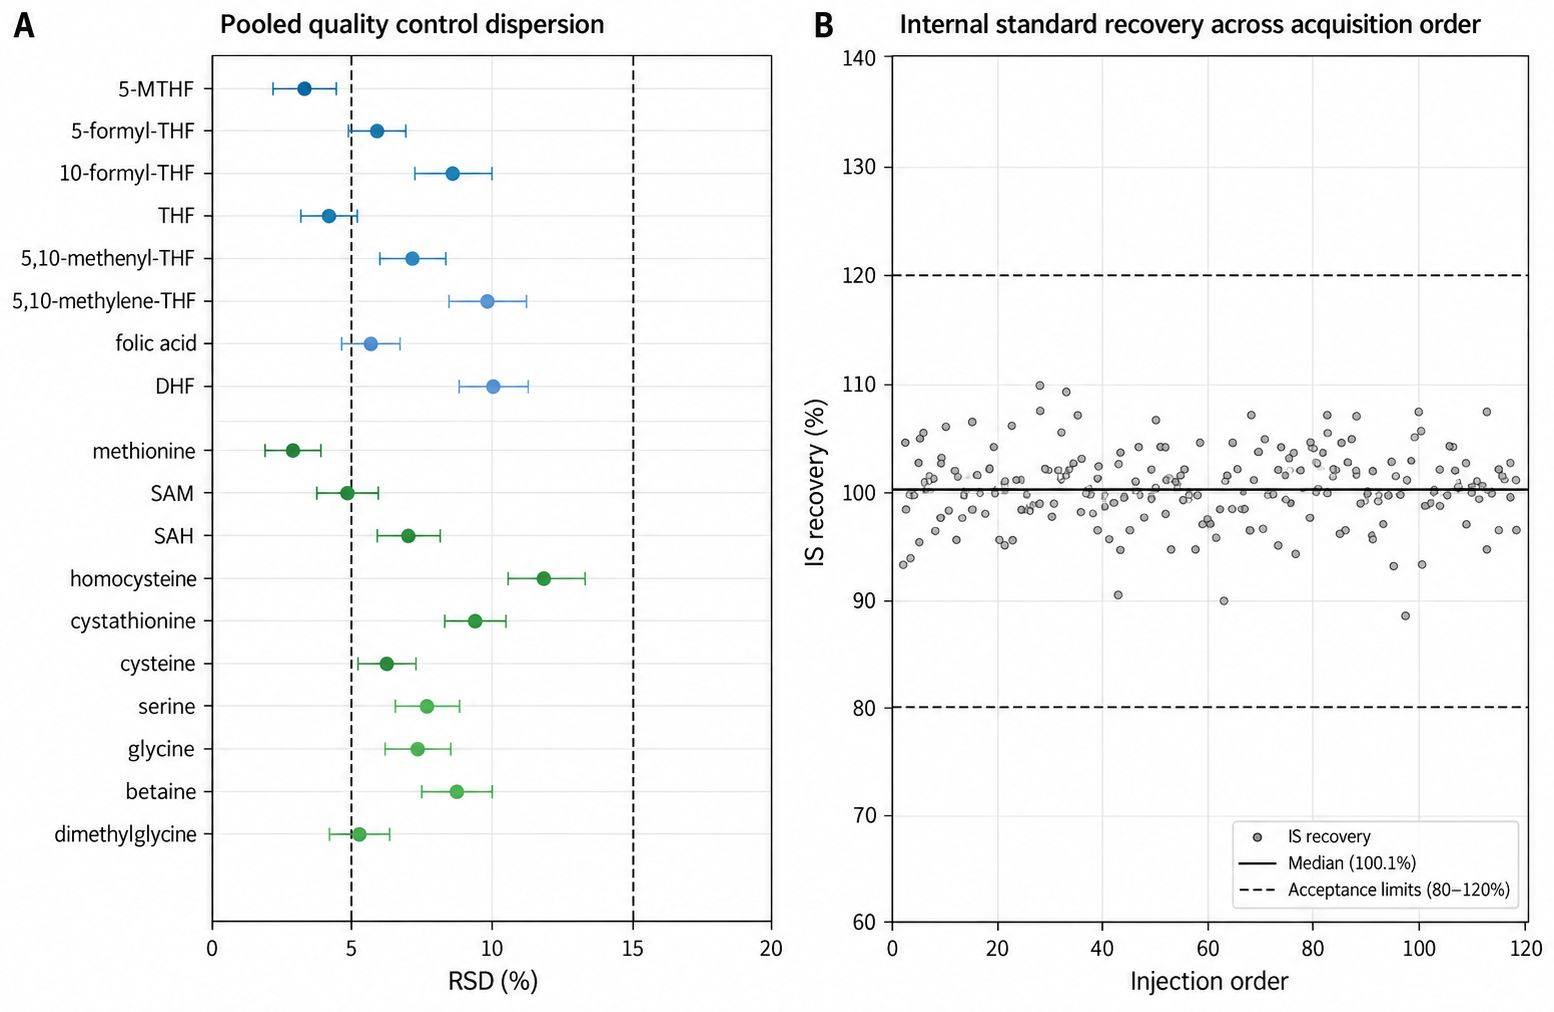
Replicate CV ≤ 10% for quantified analytes, with pooled quality control dispersion reported
per analyte across the batch. |
| Accuracy |
Recovery corrected per sample against isotope-labeled internal standards spiked before
extraction, reported alongside the uncorrected response. |
| Sensitivity |
Analyte-dependent and typically in the low nanomolar range for folate vitamers and B-vitamin
cofactors. The achieved limit of quantification is reported per analyte rather than as a single
assay-wide figure. |
| Selectivity |
Chromatographic resolution demonstrated against isobaric and oxidative interferences in spiked
blank matrix for every reported analyte, including the MeFox and 5-formyl-THF pair. |
| Sample-level QC |
Retention time drift, carryover, internal standard response, and the MeFox ratio reported for
every sample, so that individual results can be accepted or flagged on evidence. |
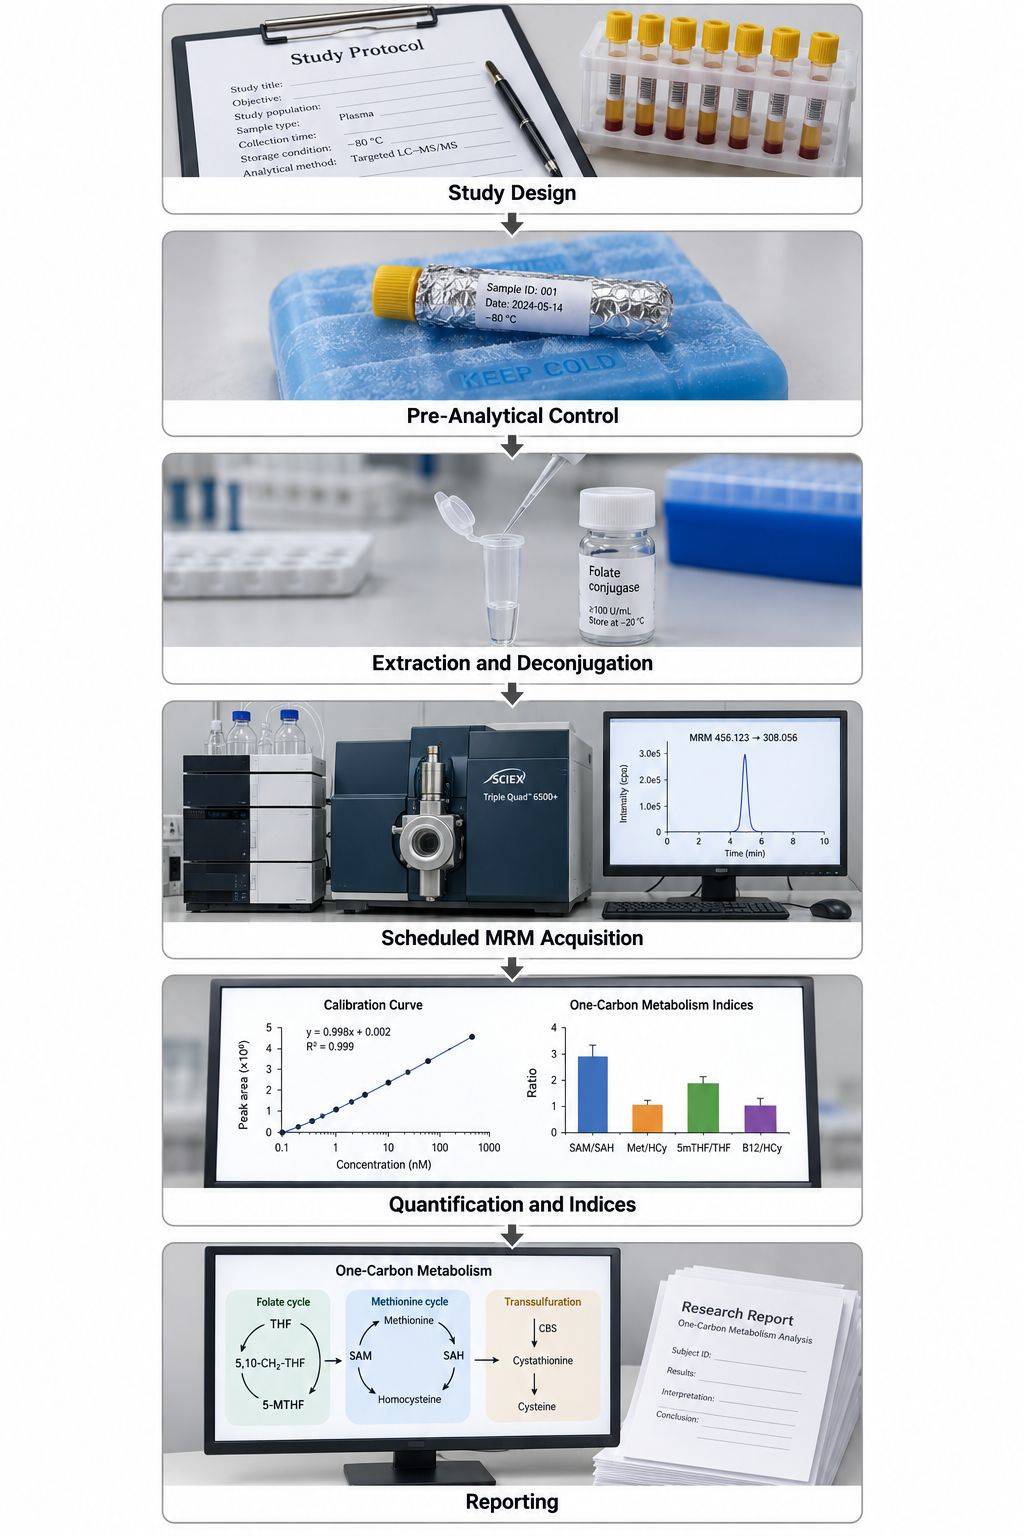
One Carbon Metabolism Analysis Workflow
Sample Requirements for One Carbon Profiling
| Sample Type |
Amount Required |
Preparation Instructions |
Storage and Shipping |
| Plasma / Serum |
≥ 10 µL |
Collect in EDTA or heparin tube, centrifuge promptly, aliquot the supernatant, avoid hemolysis
|
Store at −80°C; ship on dry ice |
| Whole Blood / DBS |
≥ 10 µL |
Dried blood spot cards dried completely before packing, or whole blood aliquoted directly; state
the format at study design, since lysate and spot require different deconjugation |
Store at −80°C; ship on dry ice |
| Urine |
≥ 10 µL |
Centrifuge to remove debris, record the collection interval, aliquot |
Store at −80°C; ship on dry ice |
| Tissue (liver, kidney, brain) |
≥ 10 mg |
Snap freeze in liquid nitrogen immediately after collection; record wet weight before freezing
where possible |
Store at −80°C; ship on dry ice |
| Feces |
≥ 10 mg |
Aliquot promptly; freeze the aliquot rather than the bulk sample; relevant where the microbial
contribution to the methyl donor pool is part of the question |
Store at −80°C; ship on dry ice |
| Plant Material |
≥ 20 mg |
Freeze in liquid nitrogen, grind while frozen, keep the powder at −80°C |
Store at −80°C; ship on dry ice |
| Cell Pellets |
≥ 1 × 10⁶ cells |
Wash with cold PBS, centrifuge, remove the supernatant, freeze the pellet; record the treatment
and collection time |
Store at −80°C; ship on dry ice |
| Cell Culture Medium |
≥ 100 µL |
Centrifuge, collect the supernatant, record the time from treatment to collection |
Store at −80°C; ship on dry ice |
Notes
- Keep folate samples protected from light from collection onward. Vitamers oxidize under ordinary
laboratory lighting, and that oxidation appears in the data as MeFox.
- Do not add a reducing agent or an acid to a sample type before confirming the buffer with us. The
correct ascorbate concentration and pH differ by matrix, and the wrong combination destroys the non-methyl
folate fraction.
- Freeze in single-use aliquots. A second thaw changes the vitamer distribution in a way that cannot be
corrected after the fact.
- Submit every group belonging to one comparison together, so that extraction and acquisition batches do
not align with treatment groups.
- Record collection time relative to food intake and to any methyl donor or B-vitamin supplementation for
every sample; homocysteine, betaine, and the substrate pool all respond to both.
- Where the study also requires the full vitamer ladder, the nucleotide-branch analytes, or a fractionated
pool, plan for more material than the minimum volumes listed above so that a repeat extraction remains
possible.
- Contact us before shipping samples of limited volume — pediatric draws, microdialysis fractions, sorted
cell populations — so that extraction and deconjugation scale to what is available.
One Carbon Metabolism Analysis Deliverables — What You Receive
- Quantitative concentration tables — Absolute concentrations
for every reported analyte, per sample, in Excel and CSV, with units and the matrix they were quantified
in stated for each column.
- Calibration and quality control report — Calibration curves
with regression parameters and back-calculated accuracy, internal standard recovery per sample, pooled
quality control dispersion, carryover, and retention time stability per analyte.
- Network index tables — Methylation potential, vitamer
partitioning, the pre-analytical oxidation flag, remethylation balance, transsulfuration output, and
serine–glycine handling, each with the analyte inputs and the samples included.
- Chromatographic and accurate mass data — Extracted ion
chromatograms for every quantified analyte, including the resolved MeFox and 5-formyl-THF pair, plus
accurate mass spectra for any vitamer species confirmed by high-resolution acquisition.
- Pathway annotation — Metabolites annotated to KEGG and HMDB
identifiers and mapped onto the one-carbon network, delivered as tables and as figures that can be used
directly.
- Methods documentation — Collection and stabilization
protocol, extraction and deconjugation procedure, chromatographic and MS parameters, transition lists,
internal standard assignments, and data-processing settings, written so that a methods section can be
assembled from it.
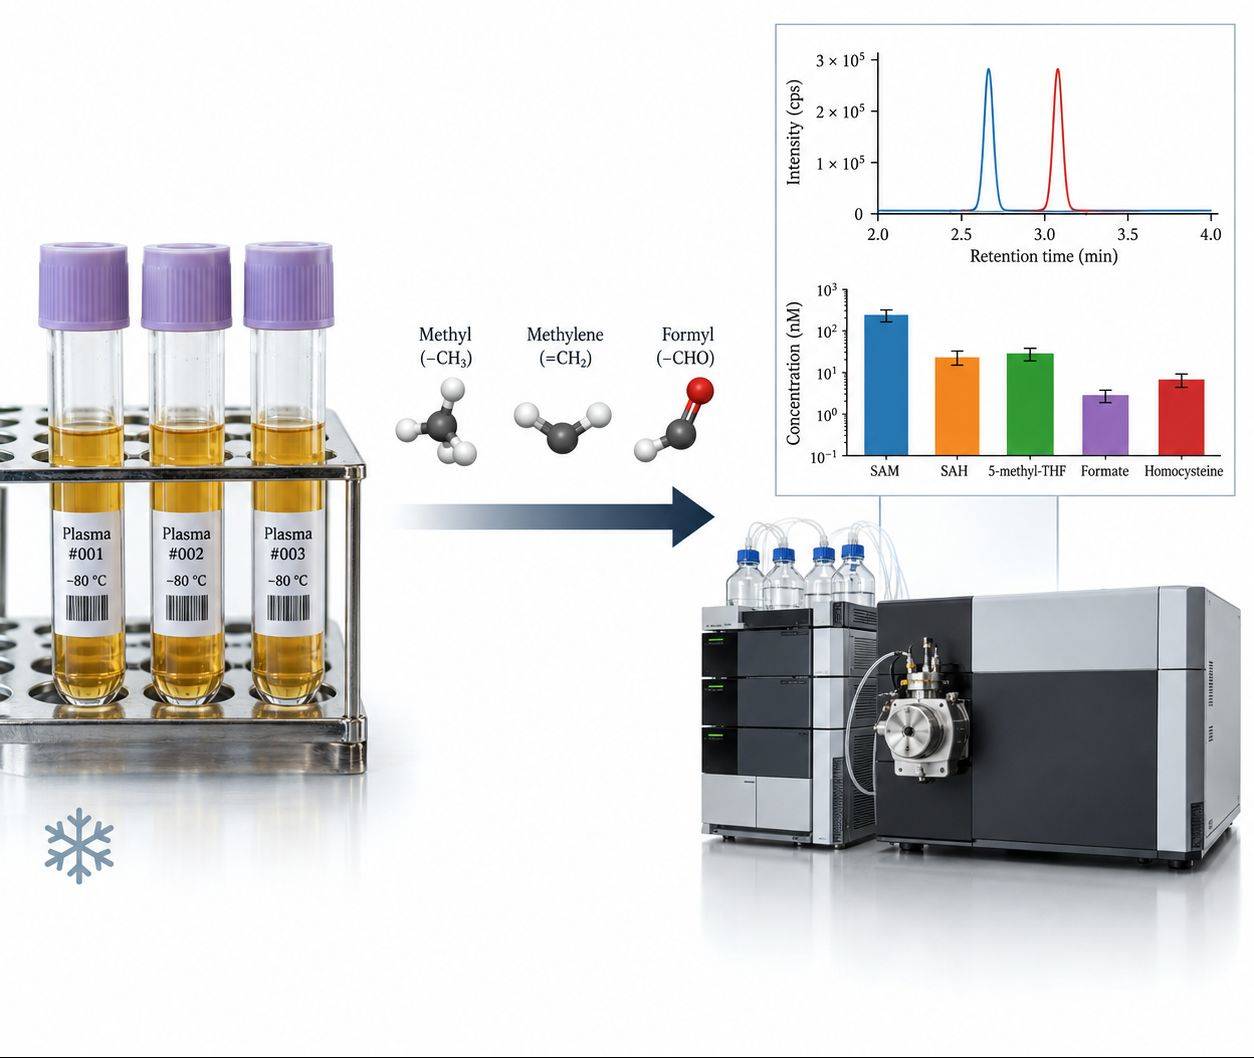
One Carbon Metabolism Data — Chromatograms, Calibration & Network Ratio Reports
Applications of One Carbon Metabolism Analysis
A Plasma One Carbon Panel Separates a Methyl
Donor Diet From Control and Tracks With Tau Pathology
Background
Lower folate status and elevated circulating homocysteine are modifiable risk factors for cognitive
decline, and disturbed one-carbon metabolism is associated with the accumulation of phosphorylated tau — the
pathological hallmark of tauopathy and of a subgroup of frontotemporal dementia. Because the intervention in
question acts on a network rather than on a single compound, validating it required the substrate side, the
remethylation product, and the redox output to be quantified from the same plasma sample with the labile
analytes intact.
The challenge was to determine whether a methyl donor-supplemented diet changes the circulating one-carbon
network at all, in small groups of animals, and do it with enough analytical control that a difference in
the folate pool reflects the diet rather than degradation between collection and analysis.
Findings (from the published study)
- TAU58/2 mice were placed on a control diet or a methyl donor-enriched diet from weaning, the latter
supplemented with L-methylfolate at 30 mg/kg, choline bitartrate at 9.09 g/kg, betaine at 5 g/kg, and 0.5%
ascorbic acid, and terminal plasma was collected at five months of age.
- Plasma from six animals per diet group was sent to Creative Proteomics (Shirley, NY, USA) for triplicate
analysis of key one-carbon metabolites by HPLC-MS/MS on an Agilent 1290 UHPLC coupled to a Sciex 4000
QTRAP operated in multiple reaction monitoring mode with positive and negative ion detection.
- Basal plasma betaine rose roughly 1.5-fold (P = 0.0004) and choline roughly 1.3-fold
(P = 0.0049) on the supplemented diet.
- 5-methyltetrahydrofolate, the circulating vitamer that delivers the methyl group for homocysteine
remethylation, rose roughly 2.4-fold (P = 0.0006), and circulating acetylcholine rose roughly
2.5-fold (P = 0.0101).
- Total plasma homocysteine fell by about 20 percent (P = 0.0106) and remained below the
threshold for mild hyperhomocysteinemia in the supplemented group.
- Plasma glutathione was below the level of detection on the control diet and significantly elevated on
the methyl donor diet (P < 0.0001), indicating greater routing of homocysteine through the
transsulfuration branch toward antioxidant capacity.
- Downstream, the supplemented diet reduced cortical tau phosphorylation at the pathological CP13 and
PHF-1 epitopes, increased methylation of protein phosphatase 2A, and lowered Fyn protein levels, with
improvements in motor and learning performance.
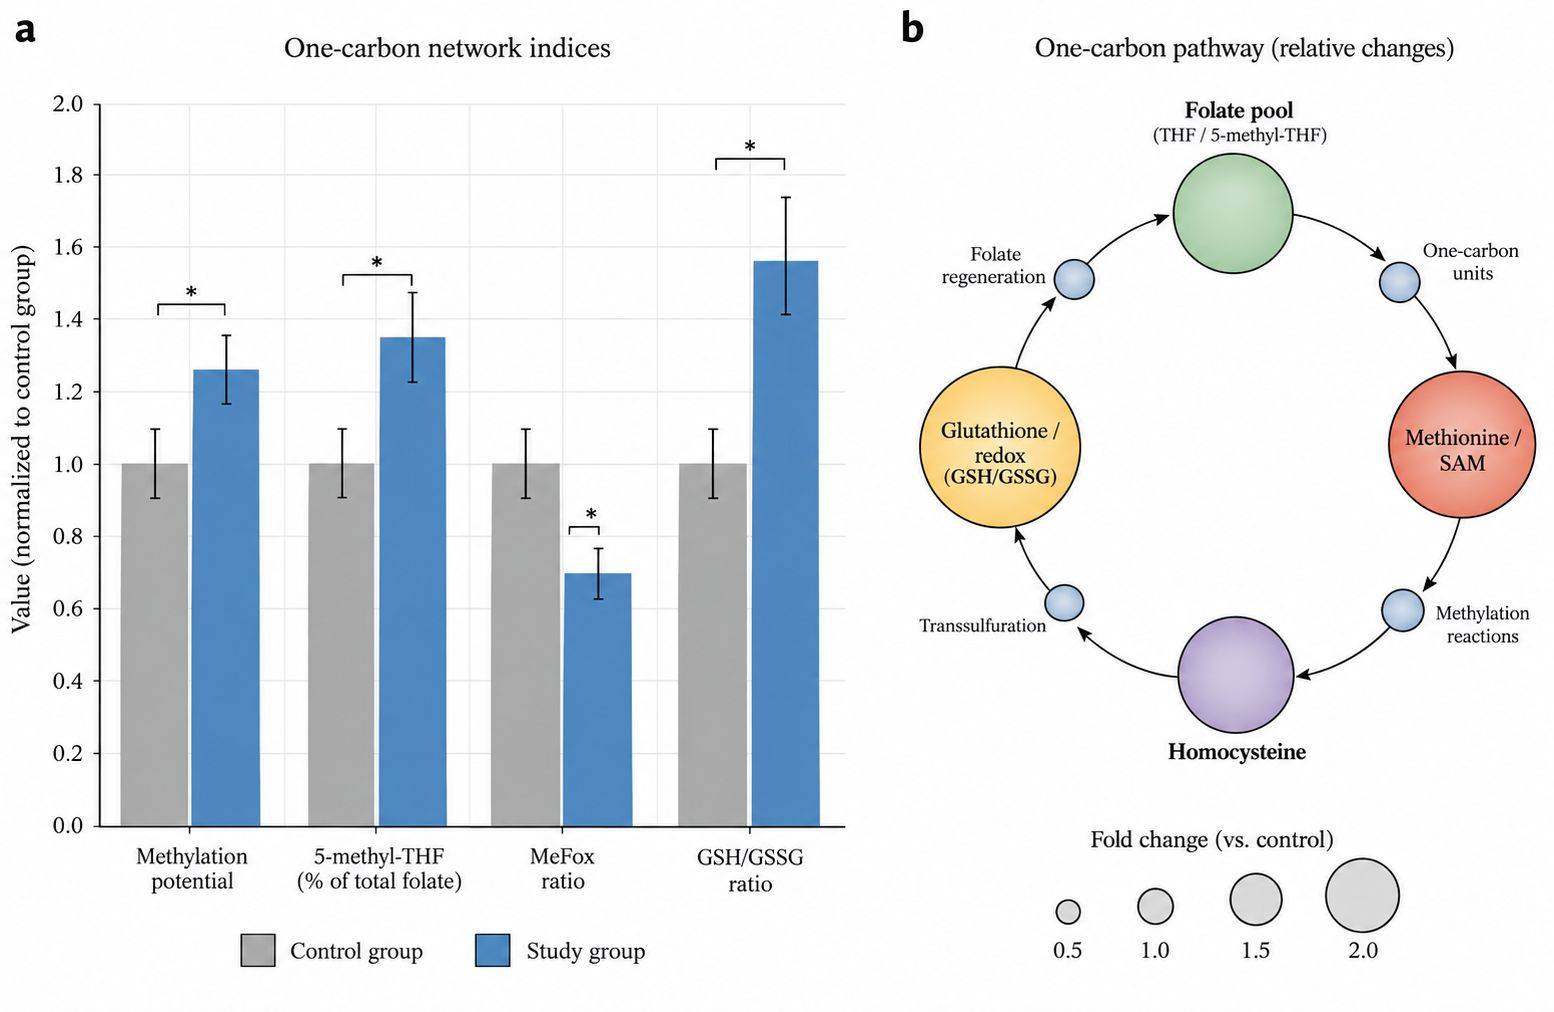
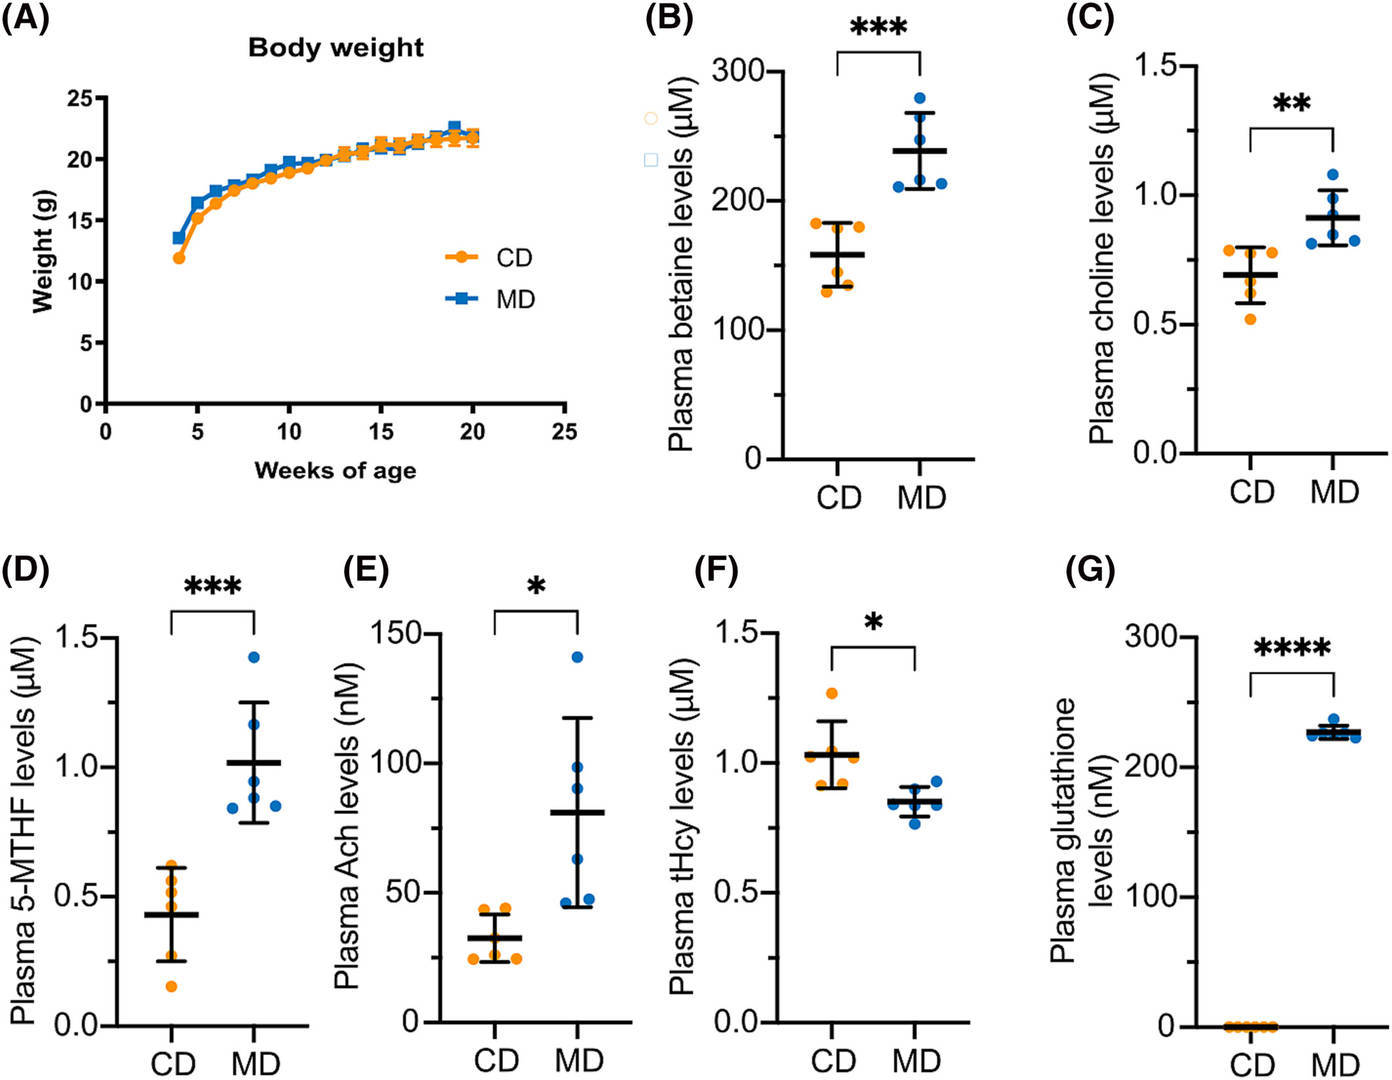 Figure 2. Impact of dietary supplementation with methyl donors on one-carbon metabolism in TAU58/2 mice.
Process Insight
The intervention could have been argued from a single analyte, and the study would have been weaker for it.
5-methyltetrahydrofolate alone shows that a substrate became available. The fall in homocysteine shows that
remethylation actually consumed it. The glutathione result shows where the surplus homocysteine went — into
the transsulfuration branch and out toward antioxidant capacity — and the betaine and choline values show
how much methyl donor load entered the system in the first place. Read as a set, the panel describes a
direction of flow rather than a set of isolated differences, which is the form the biology is discussed in.
Two operational decisions shaped the data. The first was stability: 5-methyltetrahydrofolate and the
non-methyl vitamers degrade in transit and during processing, so the result depends on collection, shipping,
and extraction being controlled as a single chain rather than treated as independent steps. The second was
batching: because the interpretation rests on ratios, the analytes in each ratio have to be quantified in
the same analytical batch, where a shared recovery correction applies to both terms. Sample sets split
across runs can still yield concentrations, but the derived indices become partly artifacts of batch.
Where Our One Carbon Metabolism Analysis Service Fits
The plasma one-carbon analyses in this study were performed by Creative Proteomics on the study's own
samples, and the panel was used to connect a nutritional intervention to a pathological outcome. The same
analytical basis is available for your program:
- The same platform family for the same analytes — UHPLC separation with triple
quadrupole detection in multiple reaction monitoring, positive and negative ion mode within one injection,
and isotope-labeled internal standards spiked before extraction. Triplicate acquisition is available where
a study requires it.
- Stability treated as a design decision — collection buffer, pH, light protection, and
hold times are assigned per matrix before samples are drawn, and deconjugation is enzymatic, which is what
keeps the folate vitamer pool intact across shipping and processing.
- Ratios computed inside one batch — methylation potential and the other network indices
are derived from analytes quantified together, so the index is not assembled from two independent
recoveries.
- Interpretable rather than raw output — concentrations are delivered together with the
derived indices and pathway annotation, so substrate, product, and redox readouts arrive in the form that
a mechanistic discussion needs.
Reference
- van Hummel, A., Taleski, G., Sontag, J.M. et al.
Methyl donor supplementation
reduces phospho-Tau, Fyn and demethylated protein phosphatase 2A levels and mitigates learning and motor
deficits in a mouse model of tauopathy. Neuropathology and Applied Neurobiology 49(4),
e12931 (2023).





 Contact Us


