What is actually happening inside your cells right now? Transcriptomics tells you what could happen. Proteomics tells you what machinery is present. But only the metabolome — the ATP being consumed, the lactate being secreted, the acetyl-CoA being channeled into the TCA cycle — tells you what the cell is doing.
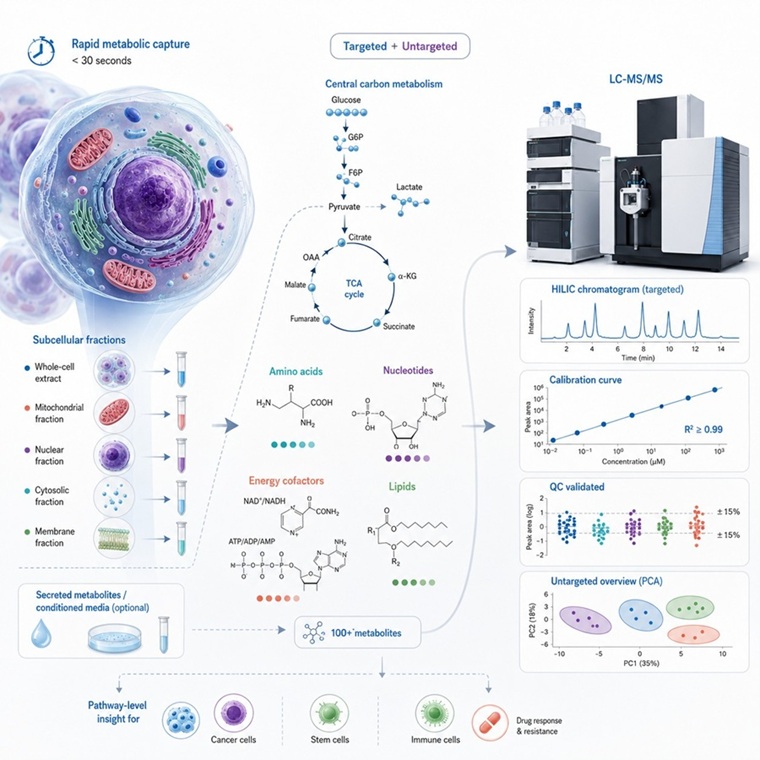
That is the value of cell metabolomics: a direct readout of metabolic pathway activity, substrate utilization, and the integrated response to genetic, pharmacological, or environmental perturbation. Our platform covers the full range — from targeted quantification of glycolysis, TCA cycle, and energy cofactor panels to untargeted global profiling and subcellular organelle metabolomics — on a single LC-MS/MS platform with pooled QC validation. For stable isotope tracing experiments, our metabolic flux analysis service captures ¹³C isotopologue distributions in central carbon intermediates. Need subpopulation resolution? Our single cell metabolomics service pushes profiling to individual cell level. For pathway-specific absolute quantification, see our targeted metabolomics service.
Our Cellular Metabolomics Capabilities — Targeted Quantification, Global Profiling & Subcellular Analysis
Key Challenges in Cell Metabolomics and How We Solve Them
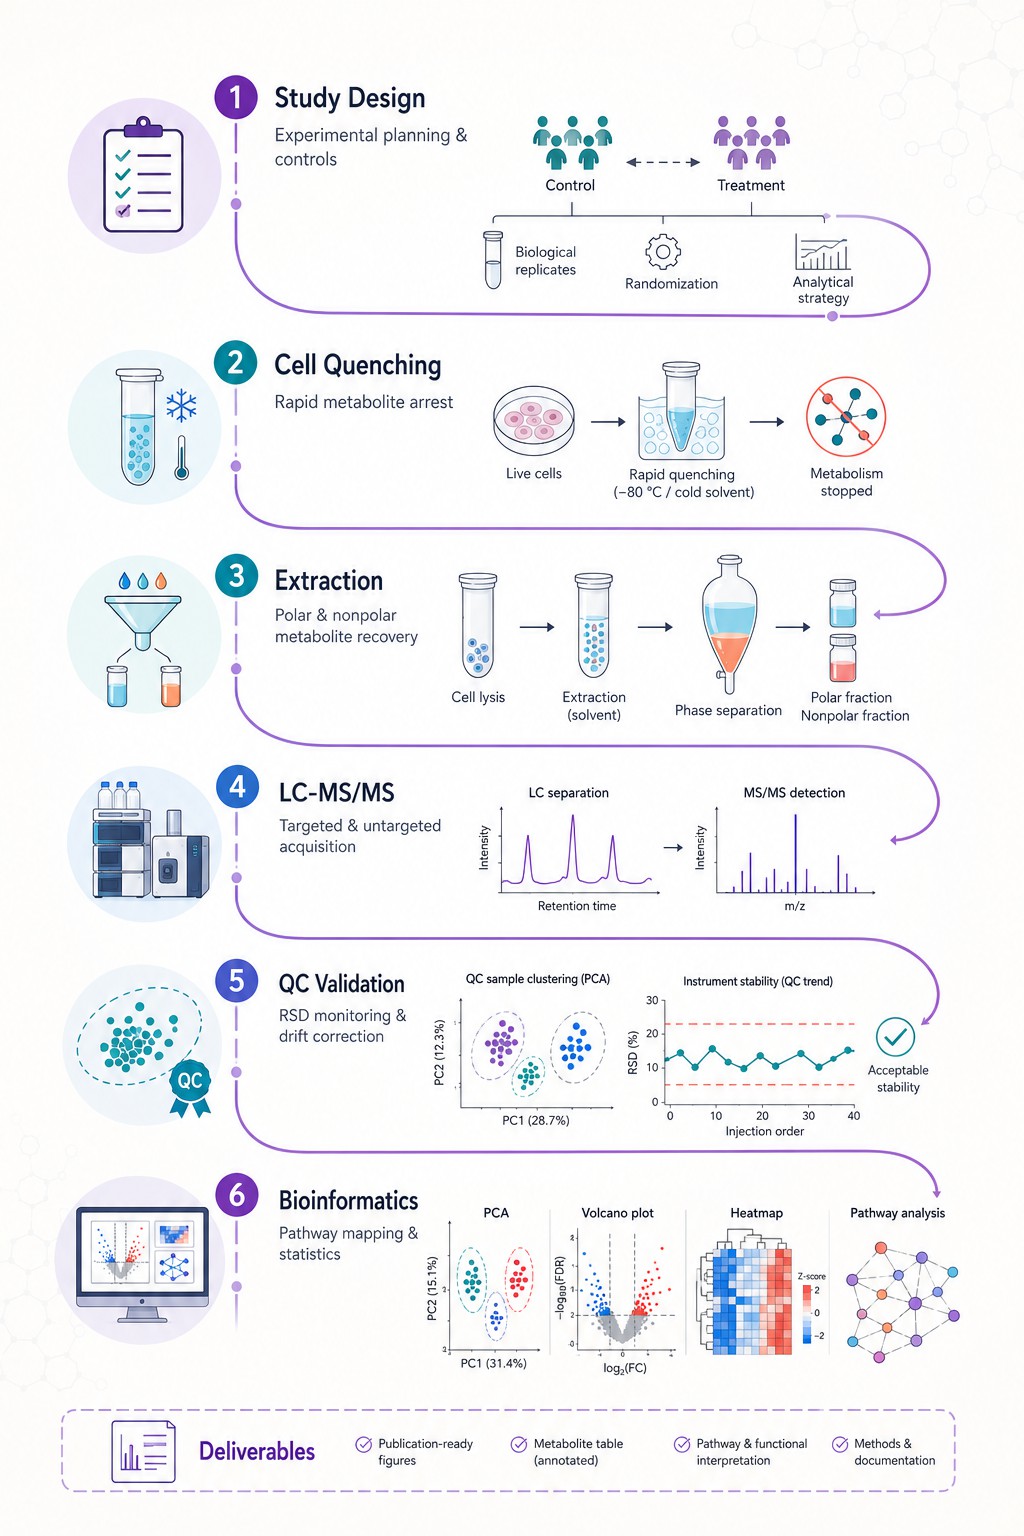
- Metabolite Quenching & Turnover Artifacts — ATP has a half-life under 2 seconds in harvested cells; NADH is similar. If your quenching protocol takes minutes instead of seconds, you are not measuring metabolism — you are measuring degradation. Our cold methanol protocol completes quenching in under 30 seconds from dish to −80°C, validated at >95% recovery of ATP/ADP ratios versus fast-filtration reference methods.
- Low Biomass from Rare Cell Populations — FACS-sorted subsets, primary isolates, laser-capture microdissection — these yield micrograms of material, not milligrams. Standard extraction workflows drown the signal. Our micro-scale protocols handle inputs as low as 1×10⁵ cells, with MRM sensitivity down to 0.1 ng/mL, making pooling unnecessary for most targeted panels.
- Media Interference in Conditioned Media Analysis — FBS contains hundreds of metabolites. Without proper subtraction, you cannot distinguish what the cell secreted from what the serum contributed. We use dialyzed serum controls and media-blank subtraction as standard for exometabolome workflows — a simple step that many labs skip.
- Culture-Induced Metabolic Drift — Passage 5 cells are not metabolically identical to passage 25 cells. Confluence at harvest matters. Serum lot matters. We document these variables per sample and recommend n ≥ 6 biological replicates from independent wells — the minimum needed to resolve treatment effects from culture noise in most cell models.
- Multi-Omics Data Integration — A metabolite list alone does not tell you why the change happened. Is it transcriptional? Post-translational? Substrate-limited? Coordinated sampling for metabolomics, proteomics, and transcriptomics from the same experiment enables cross-platform correlation, and our multi-omics integration service provides the analytical framework to connect these layers.
Service Scope — Cell Metabolomics Panels & Analytical Coverage
Our cell metabolomics services cover the following analytical panels and metabolite categories. Each panel is optimized for cell extract matrices with pooled QC validation. Panels can be ordered individually or combined for broader metabolic coverage.
Core Quantification Panels
| Panel |
Detectable Compounds (Representative) |
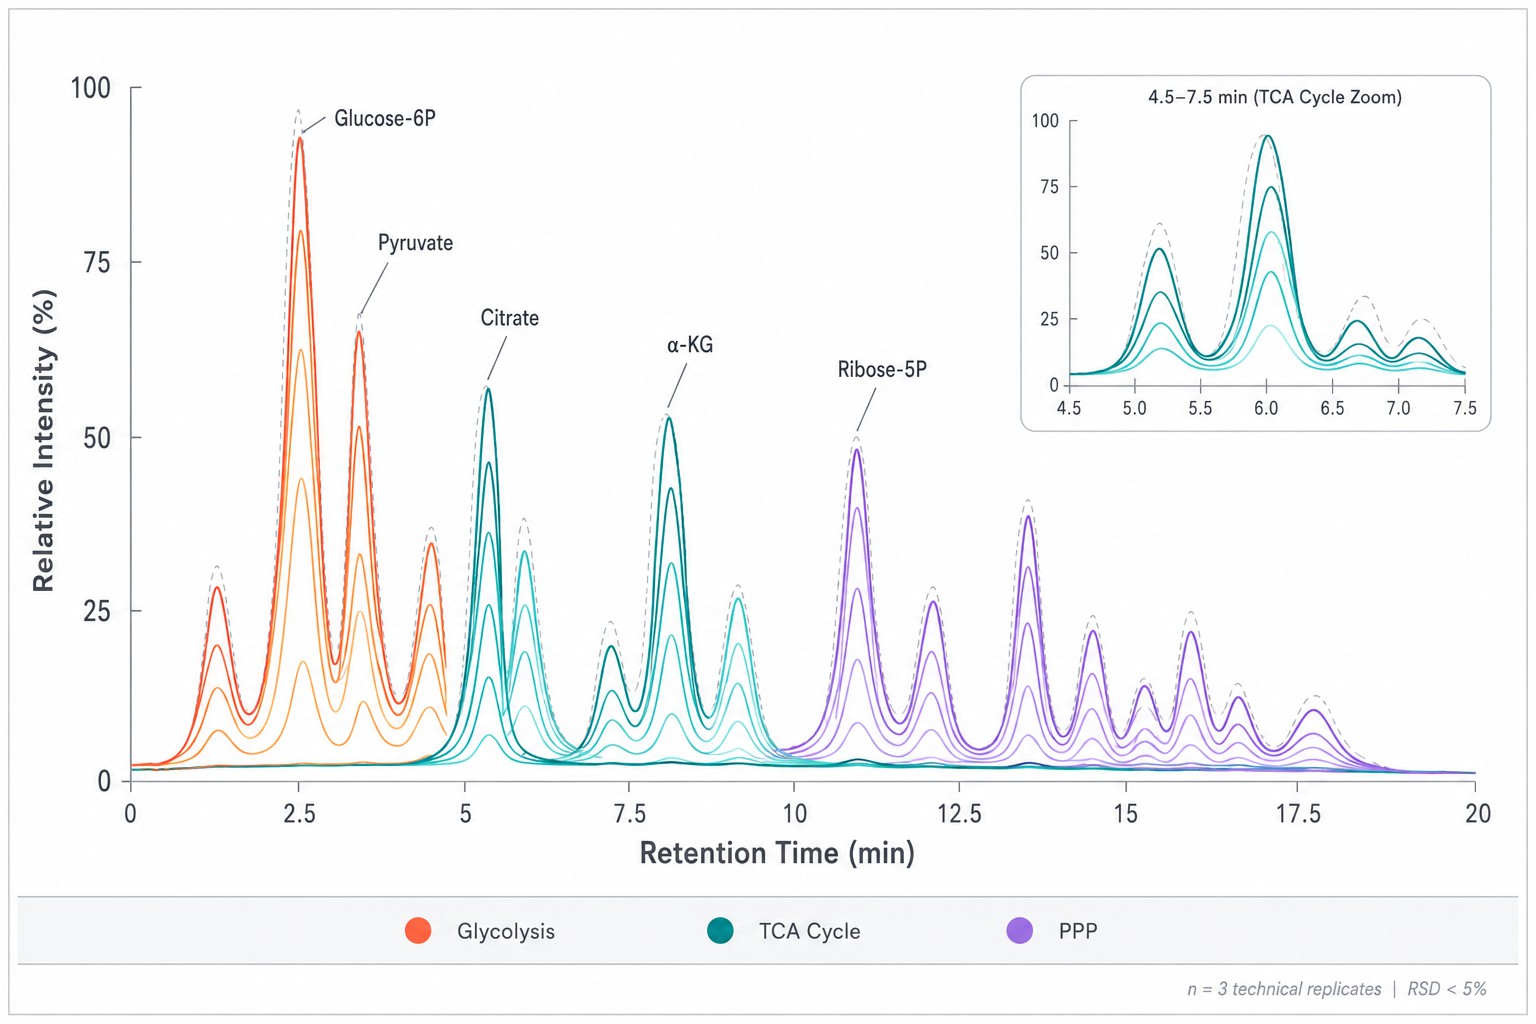
| Glycolysis, TCA Cycle & PPP |
Glucose, Glucose-6-phosphate, Fructose-6-phosphate, Fructose-1,6-bisphosphate, Dihydroxyacetone phosphate, 3-Phosphoglycerate, Phosphoenolpyruvate, Pyruvate, Lactate, Acetyl-CoA, Citrate, Alpha-ketoglutarate, Succinate, Fumarate, Malate, 6-Phosphogluconate, Ribose-5-phosphate, Erythrose-4-phosphate |
| Energy Cofactors & Redox |
ATP, ADP, AMP, NAD+, NADH, NADP+/NADPH, FAD, FMN, Coenzyme A, Acetyl-CoA |
| Amino Acid Profiling |
All 20 proteinogenic amino acids plus ornithine, citrulline, taurine, hydroxyproline, and GABA; BCAA catabolism intermediates; methionine cycle metabolites (SAM, SAH, homocysteine) |
| Polyamine & Cell Proliferation |
Putrescine, Spermidine, Spermine, Ornithine, Agmatine, N1-Acetylspermidine |
| Nucleotide & Nucleoside |
Purines (ATP, ADP, AMP, GTP, GDP, GMP, cGMP, cAMP, IMP, xanthine, uric acid); Pyrimidines (CTP, CDP, CMP, UTP, UDP, UMP, TTP, TMP); Nucleosides (adenosine, guanosine, cytidine, uridine, thymidine) |
| Targeted Lipid Mediators |
Eicosanoids, prostaglandins, leukotrienes, resolvins, lysophospholipids, ceramides, sphingosine-1-phosphate; free fatty acids (saturated, monounsaturated, polyunsaturated) |
| Phospholipid & Membrane Lipid Profiling |
PC, PE, PS, PI, PG, CL classes with fatty acyl composition; cholesterol and oxysterols; cardiolipin molecular species for mitochondrial membrane analysis |
Advanced & Specialized Workflows
| Workflow |
Coverage & Application |
| Subcellular Fraction Metabolomics |
Mitochondrial: TCA cycle intermediates, acyl-CoAs, cardiolipins, ubiquinone; Nuclear: nucleotide pools, SAM, acetyl-CoA, NAD+; Cytosolic: glycolytic intermediates, amino acids, GSH/GSSG; Membrane: phospholipids, cholesterol, sphingolipids |
| Exometabolome / Conditioned Media |
Secreted metabolites: lactate, pyruvate, glutamate, glutamine, alanine, branched-chain keto acids, ketone bodies, TCA cycle intermediates, amino acids — for metabolic flux analysis and cell communication studies |
| Untargeted Global Metabolomics |
Data-dependent acquisition LC-MS/MS profiling across polar and non-polar phases; 1,000+ metabolite features annotated via MS/MS spectral libraries; statistical workflow with PCA, PLS-DA, and pathway enrichment mapping |
Instrumentation & Method Performance for Cell Metabolomics
Analytical Platform
LC-MS/MS (Primary Platform)
Mass Spectrometer: SCIEX QTRAP 6500+ series triple quadrupole with linear ion trap; high-resolution Q-Exactive Orbitrap for untargeted workflows
Ionization: ESI in positive and negative ion modes with polarity switching; HESI-II probe for low-flow sensitivity
LC System: Waters Acquity UPLC / Shimadzu Nexera
Separation: HILIC (amide/ZIC-HILIC) for polar metabolites and central carbon intermediates; C18 reversed-phase for lipids; dedicated low-flow micro-LC for subcellular fractions
Detection: Targeted — scheduled MRM, 500+ transitions per 20-min run; Untargeted — DDA at 17,500 resolution, top-10 precursor selection
Method Performance
| Parameter |
Typical Performance |
| LLOQ |
0.1–10 ng/mL (analyte-dependent); 0.5–5 ng/mL for phosphorylated glycolytic intermediates |
| Linear Range |
4–5 orders of magnitude |
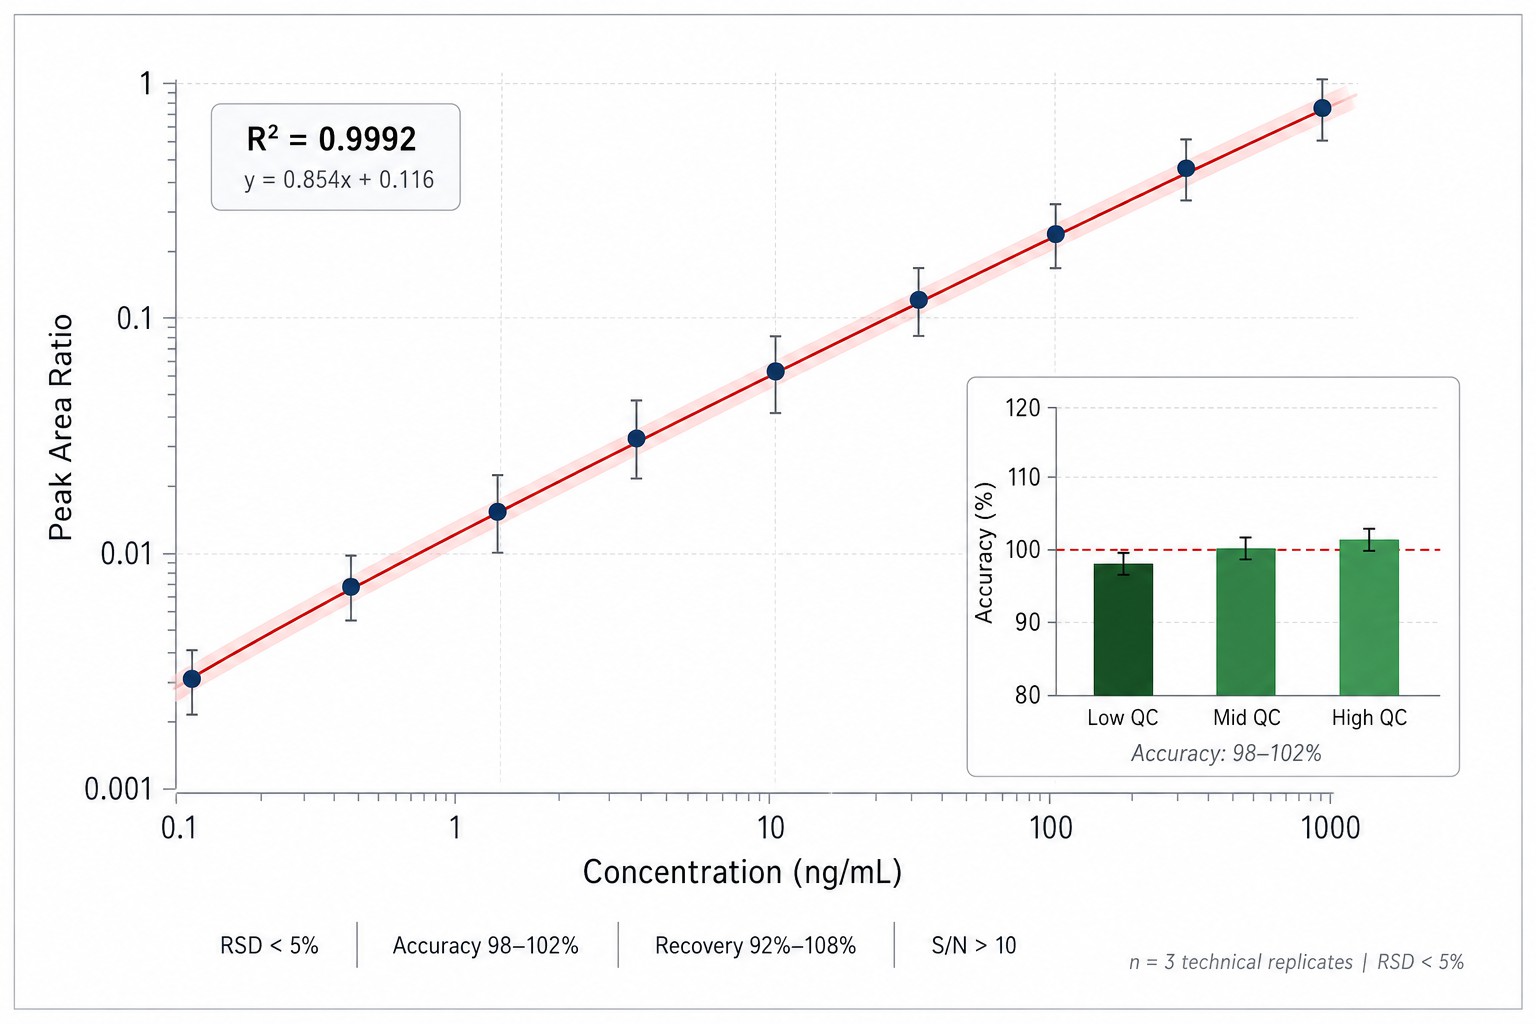
| Calibration |
8-point curves with isotope-labeled IS; R² ≥ 0.99 |
| Precision (CV) |
≤10% intra-batch; ≤15% inter-batch |
| Accuracy |
Spike recovery 85–115% in cell extract matrix |
| Minimum Cell Input |
1×10⁵ cells (targeted panels) |
Subcellular Fractionation
Differential centrifugation with OptiPrep density gradient enrichment. Mitochondrial, nuclear, cytosolic, and membrane fractions isolated from cell homogenates; organelle purity validated by western blot (COX IV, Lamin B1, GAPDH, Na+/K+-ATPase markers) per preparation.
Internal Standards & Calibration
- Internal Standards: Isotope-labeled analogs spiked at extraction for each metabolite class (¹³C/²H-labeled central carbon metabolites, ¹³C/¹⁵N-labeled amino acids, ¹³C-labeled energy cofactors)
- Calibration Strategy: 8-point standard curves, matrix-matched in cell extract
- System Suitability: Retention time stability (±0.1 min), mass accuracy (<5 ppm), ion ratio QC, carryover checks — at batch start and end
Data Processing & Metabolite Identification
- Targeted: Skyline / MultiQuant for automated peak integration with manual review
- Untargeted: XCMS / MS-DIAL for feature detection, peak alignment, gap-filling
- Identification: MS/MS spectral matching against HMDB, METLIN, and in-house libraries (matching score ≥ 0.7)
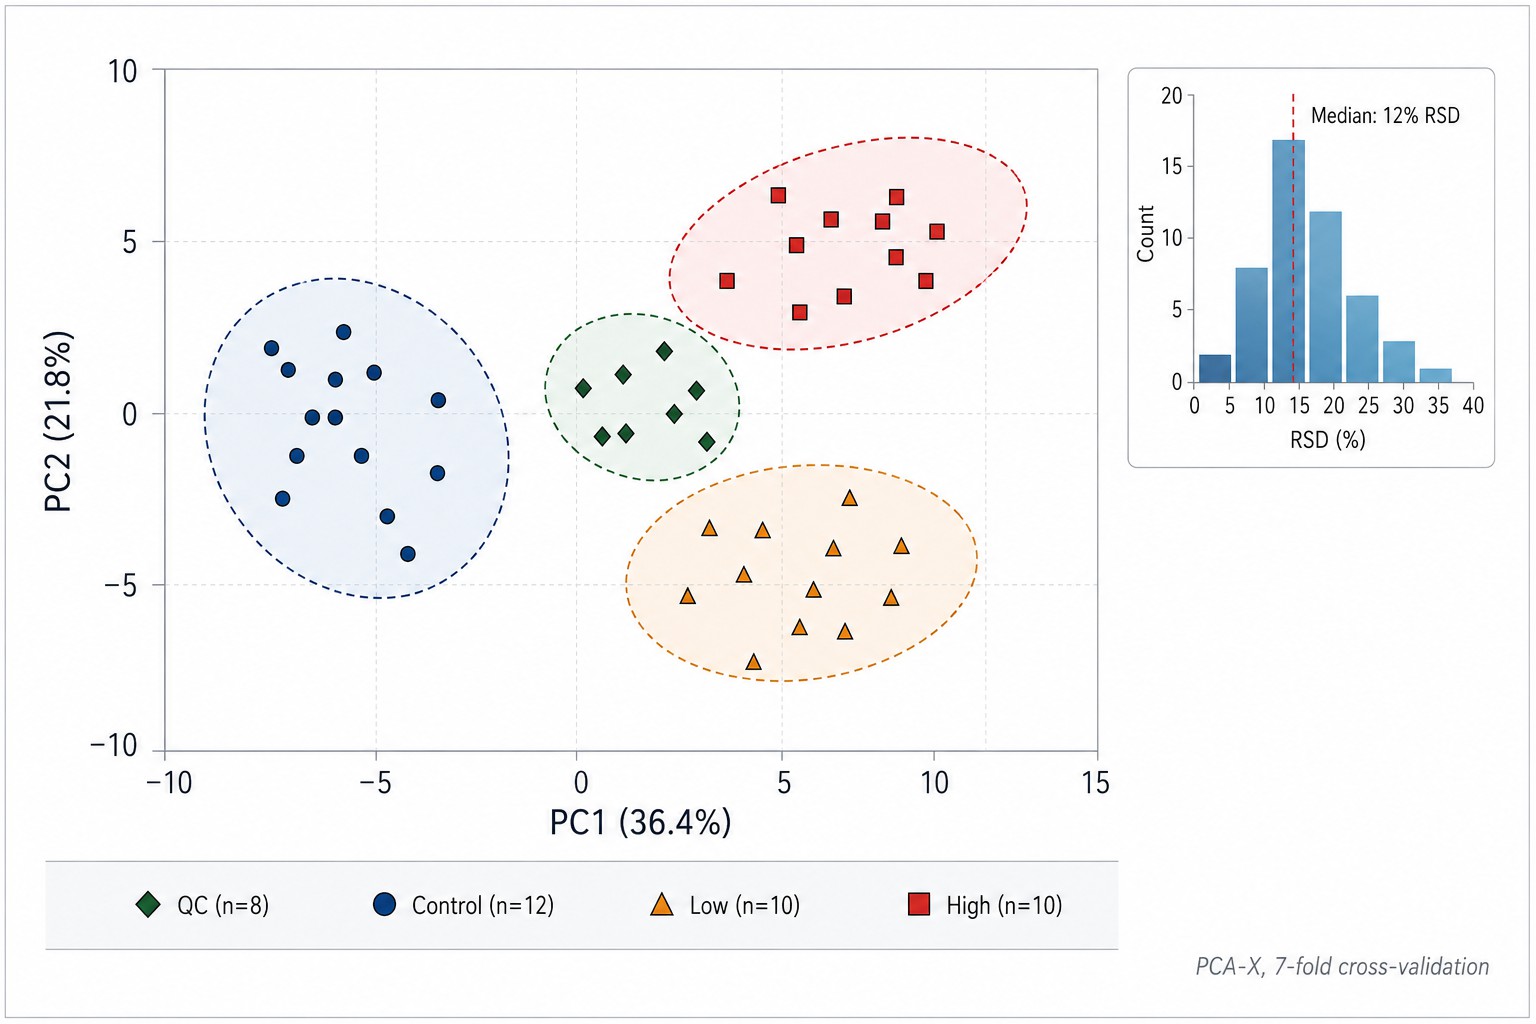
- QC Correction: Signal drift modeled and removed via LOESS fitting to pooled QC injections distributed across the batch; metabolites exceeding 30% RSD in pooled QCs are flagged in the final report
Cell Metabolomics Analysis Workflow — From Cell Culture to Biological Interpretation
Why Choose Our Cell Metabolomics Services?
- Subcellular Metabolomics
Whole-cell extracts average the compartment-specific signals that matter most. Our validated fractionation protocol isolates mitochondria, nuclei, cytosol, and membranes — each confirmed by organelle-marker western blot — so you see TCA cycle activity where it happens, nuclear acetyl-CoA pools where epigenetics is regulated, and cytosolic glycolysis separate from mitochondrial oxidation. This is not a niche add-on; for many questions it is the difference between signal and noise.
- Targeted + Untargeted from One Pellet
Split a single cell extract for both absolute quantification of known pathways and discovery profiling of the unexpected. Targeted gives you concentration numbers reviewers demand (pmol/10⁶ cells, R² ≥ 0.99); untargeted catches the metabolite changes you did not hypothesize. Run both and correlate the results — regulated pathways validate each other.
- Rigorous QC, Documented
Pooled QCs every 8 samples. Isotope-labeled IS in every tube. Extraction blanks. System suitability before and after each batch. QC-LOESS drift correction. RSD flags at 30%. If a metabolite fails QC, you know before you interpret it — and every metric is in the report for your methods section and reviewer scrutiny.
- Cell Type Experience Matters
Protocols we validate on HeLa do not automatically transfer to primary neurons or suspension T cells. We maintain optimized extraction and quenching SOPs per cell category — cancer lines, primary cells, stem cells, immune subsets, 3D cultures — and we match the protocol to your model during study design, not after the first batch fails.
- True Multi-Omics Integration
Metabolomics answers "what changed." To answer "why," coordinate with proteomics and lipidomics from parallel pellets of the same experiment. Same cells, same time points, same biological noise — different analytical windows. Cross-platform correlation analysis connects metabolite shifts to enzyme abundance changes directly.
- PhD-Level Support, Start to Finish
Study design. Cell culture prep. Quenching validation. Panel selection. Data QC review. Multivariate modeling. Pathway interpretation. Figure preparation. Your project has a dedicated scientist who understands the biology, not just the chromatography.
Applications of Cell Metabolomics — From Cancer Biology to Drug Discovery
Supported Cell Types & Culture Models
| Cell Category |
Representative Cell Types |
Culture System |
Typical Input Requirement |
| Cancer Cell Lines |
HeLa, MCF-7, MDA-MB-231, A549, HCT116, HepG2, PC-3, U2OS, K562, Jurkat |
Adherent monolayer / Suspension |
1×10⁵–5×10⁶ cells per sample |
| Primary Cells |
Hepatocytes, neurons, cardiomyocytes, fibroblasts, keratinocytes, endothelial cells |
Adherent monolayer / Sandwich culture |
1×10⁵–1×10⁶ cells per sample |
| Stem Cells |
Embryonic stem cells (ESC), Induced pluripotent stem cells (iPSC), Mesenchymal stem cells (MSC), Neural stem cells |
Feeder-dependent / Feeder-free / Differentiation media |
5×10⁵–2×10⁶ cells per sample |
| Immune Cells |
CD4+ / CD8+ T cells, B cells, NK cells, Monocytes, Macrophages (M0/M1/M2), Dendritic cells |
Suspension / Adherent (macrophages) |
5×10⁵–1×10⁷ cells per sample |
| 3D Models |
Tumor spheroids, Organoids (intestinal, cerebral, hepatic), Co-culture systems |
Matrigel / Ultra-low attachment / Microfluidic |
Varies by model; consult for guidance |
| Isolated Organelles |
Mitochondria, nuclei, microsomes, synaptic vesicles |
N/A (freshly isolated from cells/tissue) |
≥50 µg protein per organelle fraction |
Cell Metabolomics Data Deliverables & Analysis Report
Quantification Report — Absolute concentrations (pmol/10⁶ cells or nmol/mg protein) for every detected compound, plus IS recovery rates, LOD/LLOQ per analyte, and calibration curve metrics. Excel + CSV.
QC Report — PCA clustering of pooled QCs, RSD distribution histogram, intra- and inter-batch CV, IS recovery plots, blank assessment, system suitability. Everything reviewers ask for, pre-packaged.
Methods Documentation — Harvesting and quenching protocol, extraction details, LC gradient and column specs, full MRM transition table (targeted) or MS/MS library matching criteria (untargeted). Drop into your methods section.
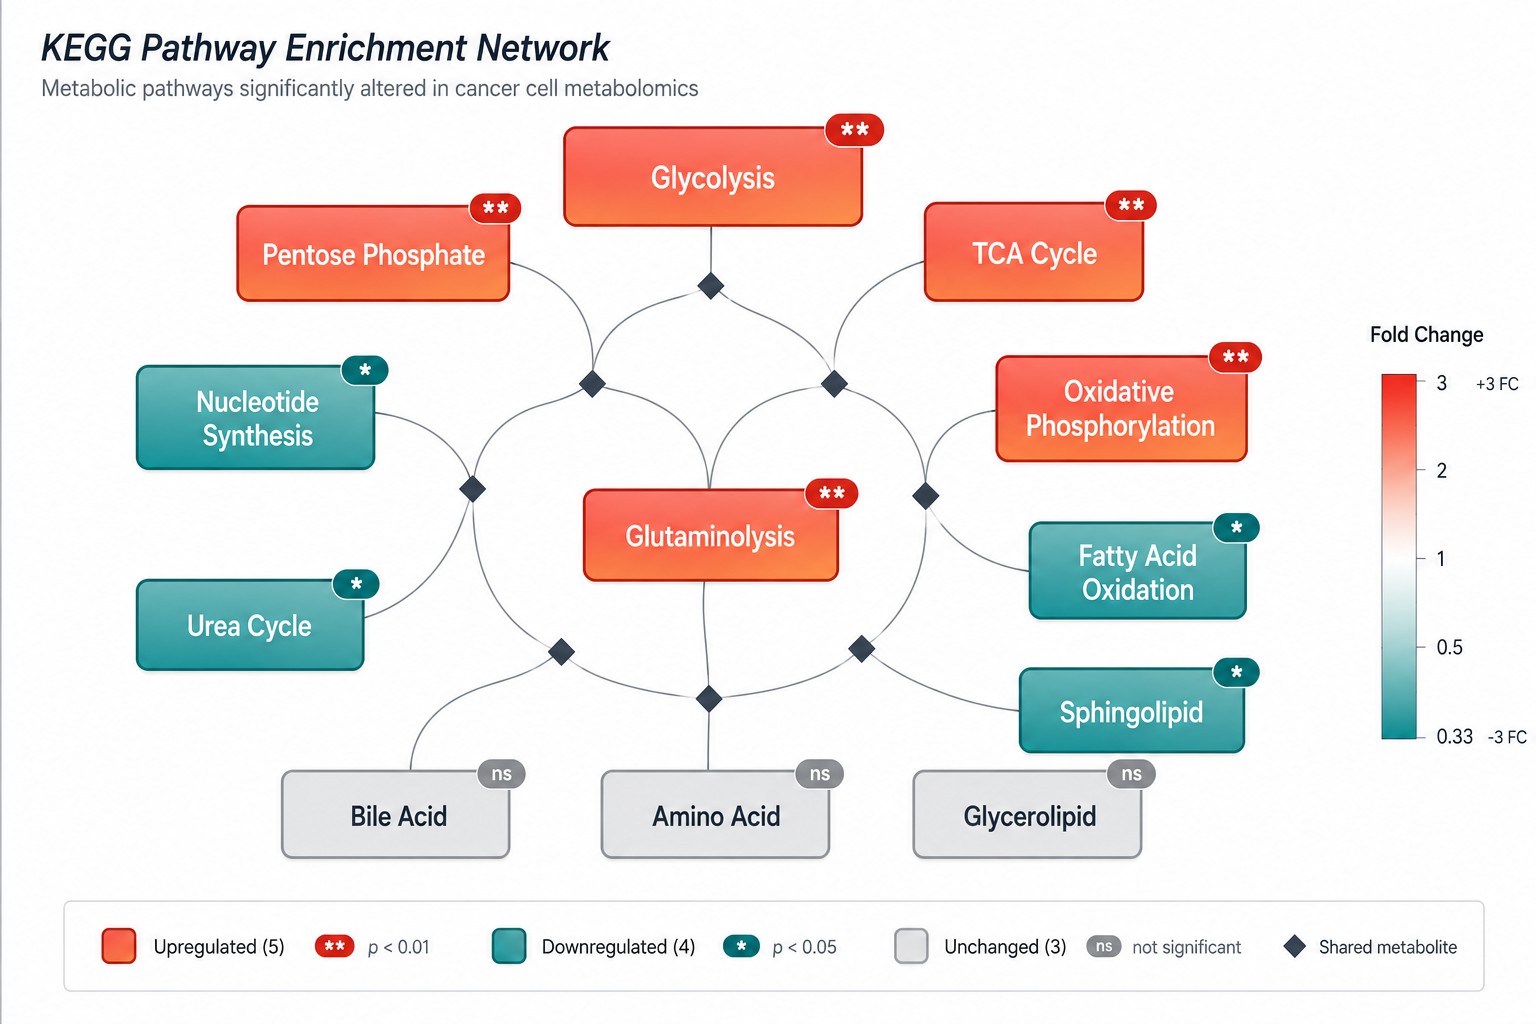
Statistical Analysis — PCA, PLS-DA with VIP scores and permutation testing, volcano plots, hierarchical clustering heatmaps, KEGG/Reactome pathway enrichment (bar charts and bubble plots), box plots, pairwise comparison tables with fold-change, p-values, and FDR q-values.
Biological Interpretation — Pathway-level narrative connecting your metabolite changes to dysregulated biology, with KEGG overlay maps showing which nodes shifted and in which direction. Not just a list of p-values — context for what the patterns mean.
Raw Data — Vendor files (.wiff/.raw) and processed peak tables (.mzML, .csv) for your own re-analysis, repository deposition, or multi-omics integration.
Case Study — iPSC-Derived Hepatocyte Drug Screening with Targeted Metabolomics
A human iPSC-derived hepatocyte screen identifies compounds that inhibit production of Apolipoprotein B
Liu, J.T., Doueiry, C., Jiang, Y.L., et al. | Communications Biology, 2023
DOI: 10.1038/s42003-023-04739-9
Background
Excess Apolipoprotein B (ApoB) drives LDL cholesterol accumulation and cardiovascular disease risk. Small-molecule inhibitors of ApoB secretion represent an attractive therapeutic strategy — but primary human hepatocytes, the gold-standard model, are scarce, donor-variable, and lose function within days in culture. Human iPSC-derived hepatocytes (hiPSC-Heps) offer a replenishable, genetically human alternative, yet had not been systematically validated for metabolic drug screening at scale.
Challenge: Establish a high-throughput, human-relevant hepatocyte screening platform that recapitulates hepatic lipid metabolism and ApoB secretion, and validate it with targeted metabolomic readouts that confirm on-target pharmacology.
Findings (from the published study)
- hiPSC-Heps were differentiated, characterized for hepatocyte markers, and deployed in a 384-well format screen of 6,000+ compounds for ApoB-lowering activity.
- Multiple hit compounds were identified that reduced ApoB secretion without cytotoxicity, confirmed by orthogonal ELISA and metabolic assays.
- Targeted bile acid quantification by LC-MS/MS — performed by Creative Proteomics — measured 9 bile acid species (cholic acid, glycocholic acid, glycochenodeoxycholic acid, taurocholic acid, chenodeoxycholic acid, taurochenodeoxycholic acid, deoxycholic acid, glycodeoxycholic acid, taurodeoxycholic acid) in conditioned media from compound-treated hiPSC-Heps.
- Bile acid profiles confirmed that hepatic metabolic function was preserved in the iPSC model and that hit compounds modulated bile acid metabolism alongside ApoB secretion — demonstrating coordinated lipid pathway effects.
- The study validates hiPSC-Heps as a scalable, human-relevant platform for metabolic drug discovery, bridging the gap between immortalized cell lines and primary human tissue.
Process Insight
This study established a workflow connecting iPSC differentiation QC, high-content screening, ELISA-based ApoB quantification, and targeted LC-MS/MS metabolomic validation — all within the same cellular model. The integration of bile acid profiling with ApoB secretion data provided a richer pharmacological picture than either readout alone, distinguishing compounds that specifically target ApoB processing from those that broadly disrupt hepatocyte lipid metabolism.
Where Our Cell Metabolomics Service Fits
Creative Proteomics supports cell-based drug screening programs with targeted metabolomics readouts that complement phenotypic screening:
- Targeted bile acid, central carbon, energy cofactor, and lipid mediator panels — from the same conditioned media or cell pellet — to characterize compound mechanism of action beyond the primary screen readout.
- LC-MS/MS (MRM) with isotope-dilution absolute quantification, delivering concentration data (pmol/10⁶ cells) suitable for dose-response modeling, cross-compound comparisons, and regulatory documentation.
- Cell-type-matched protocols including validated quenching and extraction SOPs for iPSC-derived models, primary cells, and 3D organoids — ensuring data quality from human-relevant cell platforms, not just immortalized lines.
Reference
- Liu, J.T., Doueiry, C., Jiang, Y.L., et al. A human iPSC-derived hepatocyte screen identifies compounds that inhibit production of Apolipoprotein B. Communications Biology 6, 452 (2023).
Related Publications
Polyamine metabolism impacts T cell dysfunction in the oral mucosa of people living with HIV
Mahalingam, S.S., Jayaraman, S., et al.
Journal: Nature Communications (2023)
DOI: https://doi.org/10.1038/s41467-023-36163-2
Service: Targeted metabolite quantification by LC-MS in T cell metabolomics study
Resting natural killer cell homeostasis relies on tryptophan/NAD+ metabolism
Brenner, D., et al.
Journal: EMBO Reports (2023)
DOI: https://doi.org/10.15252/embr.202357016
Service: Targeted NAD+ metabolism analysis by LC-MS/MS in immune cells
B cell-intrinsic epigenetic modulation of antibody responses by dietary fiber-derived short-chain fatty acids
Sanchez, H.N., et al.
Journal: Nature Communications (2020)
DOI: https://doi.org/10.1038/s41467-019-13603-6
Service: Short-chain fatty acid quantification by LC-MS in B cell metabolism study
Neddylation inhibition prevents perinatal cardiac development
Yu, J., et al.
Journal: Cell Reports (2023)
DOI: https://doi.org/10.1016/j.celrep.2023.112333
Service: Targeted metabolomics by LC-MS/MS in cardiac cell models
N-acetylaspartate from fat cells regulates postprandial body temperature
Wu, Q., et al.
Journal: Nature Metabolism (2025)
DOI: https://doi.org/10.1038/s42255-025-01570-5
Service: LC-MS metabolomics analysis of N-acetylaspartate in adipose cells
Disruption of placenta-brain axis in trophoblast cells
Zhang, Y., et al.
Journal: International Journal of Molecular Sciences (2025)
DOI: https://doi.org/10.3390/ijms26020587
Service: Targeted metabolomics analysis by LC-MS/MS in trophoblast cell models
Elevated SLC7A2 expression mediates Huntington's disease metabolic dysfunction
Yang, S., et al.
Journal: Journal of Neuroinflammation (2024)
DOI: https://doi.org/10.1186/s12974-024-03034-4
Service: Targeted amino acid and polyamine metabolomics by LC-MS/MS in neuronal cell models
Evidence for phosphate-dependent control of symbiont cell division in a nitrogen-fixing symbiosis
Benoit, J.B., et al.
Journal: mBio (2024)
DOI: https://doi.org/10.1128/mbio.01952-24
Service: Targeted quantitative metabolomics by LC-MS/MS in bacterial cell models
Activity of aryl hydrocarbon receptor in T cells regulates autoimmunity
Quintana, F.J., et al.
Journal: PLoS Biology (2023)
DOI: https://doi.org/10.1371/journal.pbio.3001974
Service: Targeted metabolomics profiling by LC-MS in T cell autoimmunity models
YAP mediates compensatory cardiac hypertrophy through aerobic glycolysis in response to pressure overload
Kashihara, T., Mukai, R., Oka, S.I., et al.
Journal: The Journal of Clinical Investigation (2022)
DOI: https://doi.org/10.1172/JCI150595
Service: U-¹³C-glucose stable isotope tracing by UPLC-Q-TOF MS in cardiac cell models