Why Analyze Arginine?
L-Arginine is a central amino acid involved in:
- Urea cycle – ammonia detoxification and nitrogen excretion
- NO (nitric oxide) synthesis – vascular tone, immune response, neuronal signaling
- Creatine and polyamine synthesis – energy metabolism and cell proliferation
- Proline, glutamate and related pathways – tissue repair and redox balance
Changes in arginine metabolism are closely linked to:
- Tumor and immune metabolism
- Inflammation and endothelial function
- Liver and kidney function
- Nutritional status and animal performance
- Plant stress responses and microbial metabolism
Instead of measuring arginine alone, our targeted panel allows you to monitor arginine together with its key metabolites, giving you pathway-level insight rather than a single number.
Creative Proteomics provides a LC–MS/MS and HRAM LC–MS platform for targeted and absolute quantification of arginine across diverse biological and nutritional matrices. Our method supports high sensitivity, multi-metabolite coverage, and publication-ready reporting for mechanism studies and non-clinical R&D.
Key Research Applications of Arginine Quantification
Arginine Metabolites We Can Quantify
Standard Research Panels
| Pathway / Module |
Representative metabolites* |
Typical research focus (examples) |
| Urea cycle |
L-Arginine, L-Citrulline, L-Ornithine, Urea, Argininosuccinate |
Urea cycle function, nitrogen disposal, hepatic or renal metabolism |
| Nitric oxide (NO) pathway |
L-Arginine, L-Citrulline, ADMA, SDMA, selected NO-related species (e.g., nitrite, nitrate) |
Vascular tone, endothelial function, immune and inflammatory models |
| Polyamine pathway |
Putrescine, Spermidine, Spermine, precursor and degradation intermediates |
Cell proliferation, immune activation, tumor metabolism, stress |
| Creatine and guanidino compounds |
Guanidinoacetate, Creatine, Creatinine |
Energy metabolism, muscle physiology, organ function assessment |
| Arginine methylation and related species |
ADMA, SDMA, other methylated arginine derivatives |
Methylation status, cardiovascular risk markers (research only) |
| Extended arginine-related metabolites |
Additional arginine-linked amino acids and small molecules, as requested |
Custom panels for specific pathways or project-driven hypotheses |
*Representative list only. The final analyte panel depends on platform availability and project design.
Customized Panels
If you already have a target list (e.g., from literature or an untargeted study), we can:
- Check standard and method availability for each metabolite
- Propose a custom arginine-focused panel aligned with your model and sample type
- Adjust calibration range and QC design according to expected concentration levels
Why Choose Creative Proteomics for Arginine Analysis?
- Arginine-focused expertise
Dedicated methods for arginine, urea cycle, NO pathway, polyamines and related markers – not just a generic amino acid panel.
- Fit-for-purpose LC–MS/MS platforms
Triple-quadrupole LC–MS/MS with optimized sample prep for plasma/serum, tissues, cells, food, feed, plant and microbial matrices.
- Standard panels + easy customization
Ready-to-use panels for metabolism, PK/PD, nutrition, animal and plant studies, with flexible add-on targets based on your project.
- Controlled data quality
Internal standards, QC samples and standardized SOPs to ensure sensitivity, linearity and reproducibility across batches.
Analytical Platforms & Methodology
Core instruments
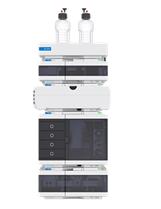
- LC–MS/MS (triple quadrupole)
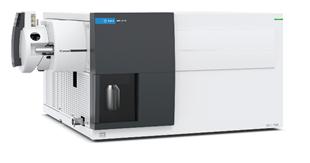
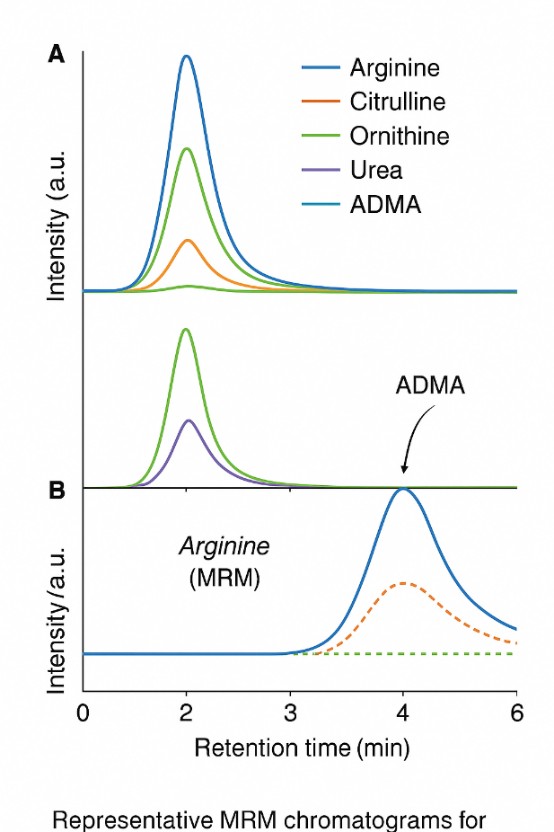
Routine absolute quantification of L-arginine and core pathway metabolites using MRM methods on triple quadrupole platforms (e.g., Agilent 6495C). Ideal for plasma, tissues, cell extracts, large cohorts, and PK/PD time courses.
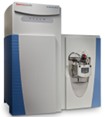
- High-resolution LC–MS (Orbitrap/Q-TOF)
Extended arginine-related panels and complex matrices (plant tissues, fermentation broth, food/feed) on Orbitrap-class or Q-TOF instruments (e.g., Q Exactive HF-X). Well suited for custom panels and integration with untargeted metabolomics.
For high-arginine formulations or routine content checks, HPLC-UV or FLD can be used as a simple orthogonal assay alongside LC–MS data.
Method Performance and QC Parameters
| Parameter |
Typical value / range* |
Notes |
| Calibration range |
From low nM up to high µM (matrix-dependent) |
Covers basal and stimulated / treated conditions |
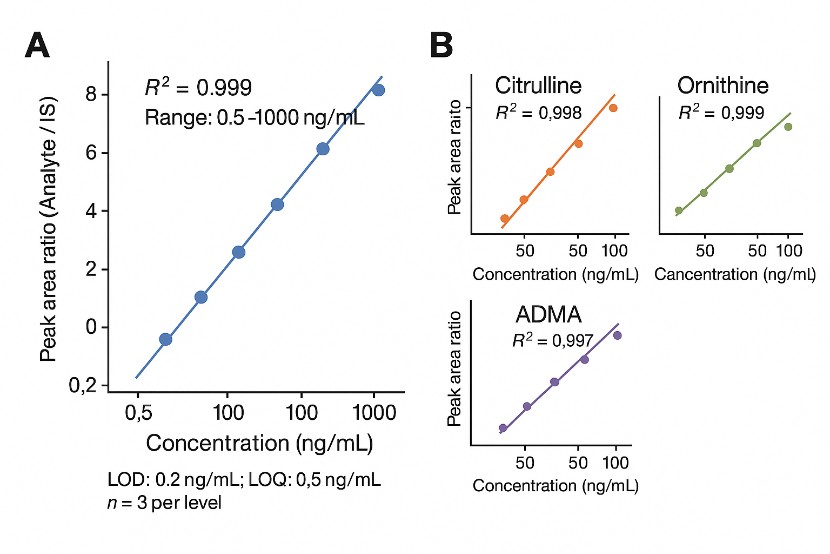
| Linearity (R²) |
≥ 0.99 across the validated range |
For most core metabolites under optimized conditions |
| LOD / LOQ |
Down to low nM levels in plasma and tissues |
Exact values reported per analyte and matrix |
| Precision (CV%) |
Intra-batch ≤ 10%; inter-batch ≤ 15% (typical) |
Evaluated using QC and pooled samples |
| Accuracy / recovery |
Typically 80–120% in validated matrices |
Based on spiked and matrix-matched standards |
| QC frequency |
Pooled QC every 10–15 samples; batch-level checks |
Monitors drift and supports large cohort designs |
*Values are representative and may vary by analyte, matrix, and project design. Detailed method parameters can be provided in the final report on request. All assays are for research use only and are not intended for diagnostic applications.
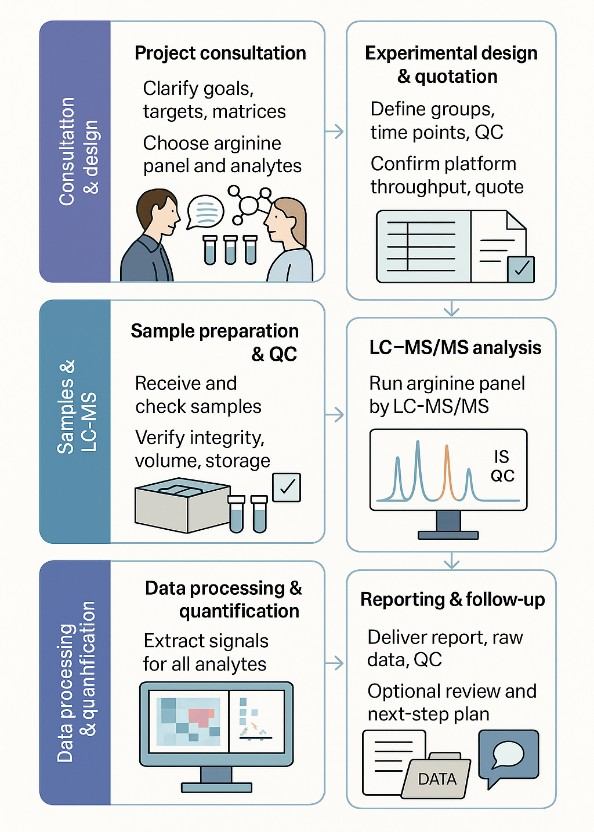
Arginine Targeted Quantification Workflow
- Project discussion and panel design
Define study goals, sample matrices, and target metabolites.
- Sample preparation and extraction
Apply matrix-specific extraction, cleanup, or derivatization steps when necessary.
- Instrumental analysis
Perform LC–MS/MS or HRAM LC–MS acquisition with validated conditions.
- Quantification and QC validation
Integrate peaks, check calibration, evaluate QC points, and ensure data quality.
- Reporting and optional data interpretation
Deliver structured tables, pathway summaries, and visual data outputs.
Sample Types & Recommended Amounts for Arginine Analysis
| Sample type |
Recommended amount (per sample) |
Container & storage |
Notes |
| Plasma / Serum |
≥ 150–200 µL |
1.5 mL microtube, –80°C |
Separate within 2 h; avoid hemolysis; record fasting/status if needed |
| Whole blood (for plasma/serum prep) |
≥ 1–2 mL |
EDTA / heparin / serum tube, 4°C → –80°C |
Centrifuge promptly; prepare plasma/serum before shipment |
| Urine |
≥ 0.5–1 mL |
1.5–2 mL tube, –80°C |
Mix well; no preservatives unless agreed in advance |
| Tissue (animal / human, incl. tumor) |
≥ 30–50 mg |
Cryovial, snap-frozen, –80°C |
Rinse briefly if needed, blot dry; note tissue type and treatment |
| Cultured cells |
≥ 1–5 × 10⁶ cells |
Cell pellet in tube, –80°C |
Remove medium, wash with cold PBS, remove supernatant completely |
| Cell culture supernatant / medium |
≥ 500 µL |
1.5–2 mL tube, –80°C |
Clarify by centrifugation; record cell line, density, time point |
| CSF / other low-volume fluids |
≥ 50–100 µL |
Low-bind tube, –80°C |
Indicate available volume in advance; avoid repeated freeze–thaw |
| Food / nutrition products (solid) |
≥ 100–200 mg |
Sealed tube or bag, 4°C / –20°C* |
Homogenized; representative of batch; avoid adding amino acid preservatives |
| Food / nutrition products (liquid) |
≥ 0.5–1 mL |
Tightly sealed tube, 4°C / –20°C |
Mix well; avoid repeated freeze–thaw |
| Feed / diet samples |
≥ 100–200 mg |
Sealed bag or tube, dry, room temp / 4°C |
Mix thoroughly; avoid amino acid preservatives unless pre-agreed |
| Plant tissues (leaf, root, seed, etc.) |
≥ 50–100 mg |
Cryovial, liquid N₂ snap-freeze, –80°C |
Remove surface moisture; record species, tissue and growth stage |
| Fermentation broth / microbial sup. |
≥ 0.5–1 mL |
1.5–2 mL tube, –80°C |
Mix thoroughly; centrifuge if heavy particulates |
| Microbial pellets |
Pellet from ≥ 10–20 mL culture |
Cryovial, snap-frozen, –80°C |
Remove supernatant completely; note strain and culture conditions |
| Other / special matrices |
Please inquire |
To be defined case-by-case |
We will provide specific instructions during project setup |
Arginine Analysis Data Deliverables & Reporting
Standard data package
Raw LC–MS/MS data files (instrument-specific formats; open formats on request).
Processed data tables (Excel/CSV) including:
- Sample IDs and metadata
- Analyte names
- Quantitative results (concentrations or normalized signals)
Brief technical summary describing platform, methods and QC approach.
Optional enhancements
QC summary reports (precision, stability, batch performance).
Simple statistics and visualizations (e.g., group comparisons, trend plots, heatmaps, PCA).
Pathway-focused comments concentrating on arginine, urea cycle, NO-related metabolites and polyamines.
Support in integrating arginine data with your existing experimental endpoints.
Case. Transcriptomics and Metabolomics Changes Triggered by Exogenous 6-Benzylaminopurine in Relieving Epicotyl Dormancy of Polygonatum cyrtonema Hua Seeds
Background:
Polygonatum cyrtonema Hua, a valuable medicinal plant, faces cultivation challenges due to seed epicotyl dormancy, requiring two winters for germination.
Cytokinins like 6-benzylaminopurine (6-BA) promote dormancy release, but the molecular mechanisms in P. cyrtonema are unclear. This study uses transcriptomics and metabolomics to elucidate these mechanisms, aiding large-scale cultivation and commercial use.
Samples:
After 60 days in wet sand at 4°C, Polygonatum cyrtonema seeds were sown in soil and grown in a climate chamber (25°C, dark).
After 30 days, 200 mg/L 6-BA was applied to seeds with 0.1–0.2 cm epicotyl buds, with water as the control.
Samples were collected at various intervals, snap-frozen in liquid nitrogen, and stored at -80°C. Germination rate, root length, and bud length were measured every 5 days.
Technical methods procedure:
High-throughput mRNA sequencing was performed on seeds at three stages (12 h, 7 days, and 28 days post-6-BA treatment). RNA was extracted using the CTAB method, sequenced using the Illumina NovaSeq 6000 platform, and analyzed to identify differentially expressed genes (DEGs).
RNA-seq reads were mapped and quantified using Bowtie2 and RSEM software. DEGs were identified using DESeq with criteria |log2 (fold-change)| ≥ 1 and adjusted p-value < 0.05. Gene Ontology (GO) and KEGG pathway enrichment analyses were performed.
Metabolic profiling was conducted simultaneously with transcriptomic sampling. Freeze-dried samples were processed and analyzed using UHPLC-MS. Data were processed and annotated using SCIEX Analyst Workstation and in-house R programs.
Correlation analysis of DEGs and differentially expressed metabolites (DEMs) was performed, and networks were visualized using Cytoscape. Integrated analyses, including significance and PCA, were conducted using R software. Visualization was done using GraphPad Prism and Adobe Photoshop.
Results
Germination rates increased over time, peaking at 60% by day 30. Application of 6-BA increased emergence rates, particularly at concentrations between 100-300 mg/L. Seeds treated with 6-BA showed faster emergence compared to untreated seeds.
Seed samples were collected at various stages post-6-BA treatment. Significant changes were observed in flavonoid biosynthesis, arginine/proline metabolism, and zeatin biosynthesis pathways. Correlation between gene expression and metabolite levels highlighted key pathways influencing dormancy release.
Differentially expressed genes were identified across stages, particularly related to carbohydrate metabolism, photosynthesis, and hormonal pathways. Gene functions were associated with dormancy release processes, including flavonoid biosynthesis and hormone signaling.
 Fig 1. Metabolomics analysis on dormancy release of epicotyl in P. cyrtonema seeds. (A) PCA analysis of T1 vs. C1. (B) PCA analysis of T2 vs. C2. (C) PCA analysis of T3 vs. C3. (D) Venn diagram of metabolite distributions across different stages. (E) KEGG analysis of T1 vs. C1. (F) KEGG analysis of T2 vs. C2. (G) KEGG analysis of T3 vs. C3.
 Fig 2. Integrated transcriptomics and metabolomics analysis of flavonoid biosynthesis, arginine and proline metabolism, and zeatin biosynthetic pathways. (A) The DEGs and DEMs involved in the flavonoid biosynthesis, arginine and proline metabolism, and zeatin biosynthetic pathway at different stages. T, Treatment group; C, Control group. (B–G) Verification of related genes in transcriptome by qRT-PCR. IPT, isopentenyl transferases gene; CYP735A, cytokininhydroxylase gene; CKX, cytokinin degrading enzyme gene; CHS, chalcone synthase gene; C4H, cinnamate-4-hydroxylase; DFR, dihydroflavonol 4-reductase.
Reference
- Zhang, W. (2022). "Transcriptomics and metabolomics changes triggered by exogenous 6-benzylaminopurine in relieving epicotyl dormancy of Polygonatum cyrtonema Hua seeds." Frontiers in Plant Science 13, 961899.
Elevated SLC7A2 expression is associated with an abnormal neuroinflammatory response and nitrosative stress in Huntington's disease
Gaudet, I. D., Xu, H., Gordon, E., Cannestro, G. A., Lu, M. L., & Wei, J.
Journal: Journal of Neuroinflammation
Year: 2024
DOI: https://doi.org/10.1186/s12974-024-03038-2
Water-soluble saponins accumulate in drought-stressed switchgrass and may inhibit yeast growth during bioethanol production
Chipkar, S., Smith, K., et al.
Journal: Biotechnology for Biofuels and Bioproducts
Year: 2022
DOI: https://doi.org/10.1186/s13068-022-02213-y
Polyamine metabolism impacts T cell dysfunction in the oral mucosa of people living with HIV
Mahalingam, S. S., Jayaraman, S., et al.
Journal: Nature Communications
Year: 2023
DOI: https://doi.org/10.1038/s41467-023-36163-2
Metabolites and Genes behind Cardiac Metabolic Remodeling in Mice with Type 1 Diabetes Mellitus
Kambis, T. N., Shahshahan, H. R., & Mishra, P. K.
Journal: International Journal of Molecular Sciences
Year: 2022
DOI: https://doi.org/10.3390/ijms23031392