Chlorophyll f Analysis Service
Submit Your InquiryAbout chlorophyll f
Chlorophyll f was accidentally extracted by researchers from a cyanobacteria colony in Shark Bay, Western Australia, and named it chlorophyll f. Its discoverer is the School of Life Sciences, University of Sydney, Australia.
Chlorophyll f can absorb low-energy light waves-red light to infrared light (infrared light has a wavelength of 0.78 to 1000 microns, divided into near-infrared and mid-infrared), and even low-frequency light waves of 720 nanometers. Therefore, it becomes the "reddest" chlorophyll found so far.
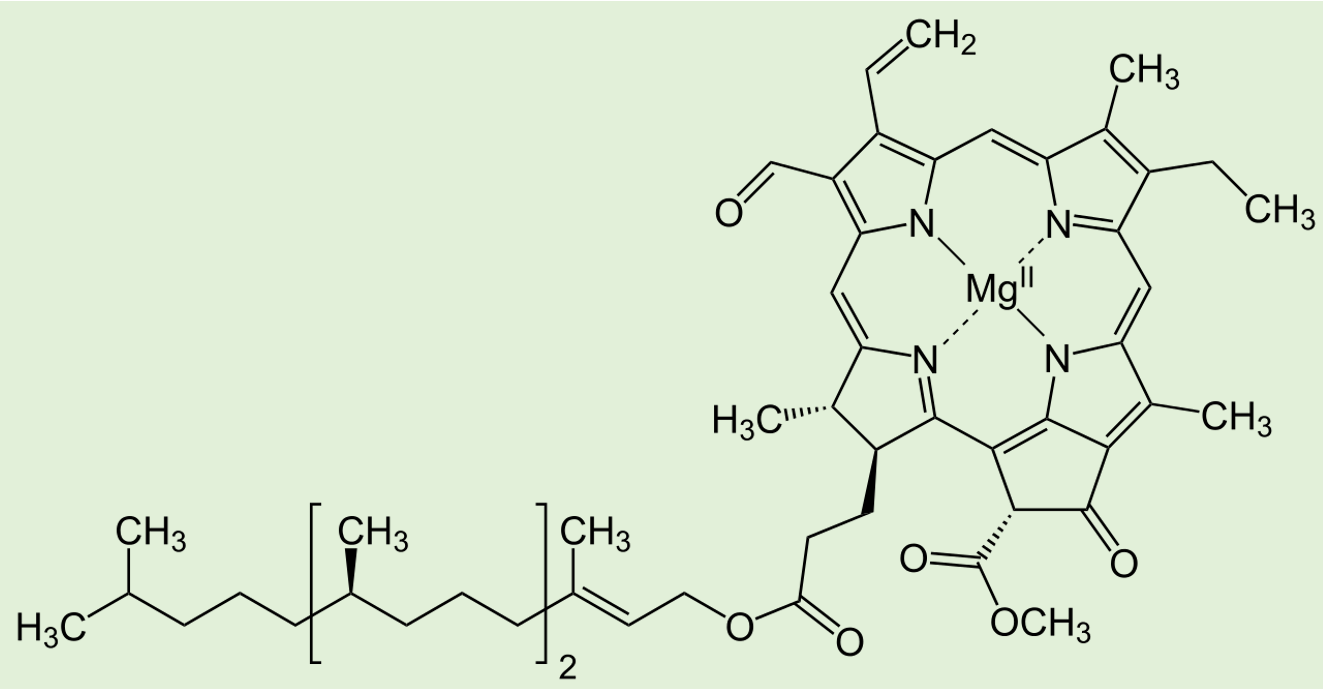 Molecular structure of chlorophyll f
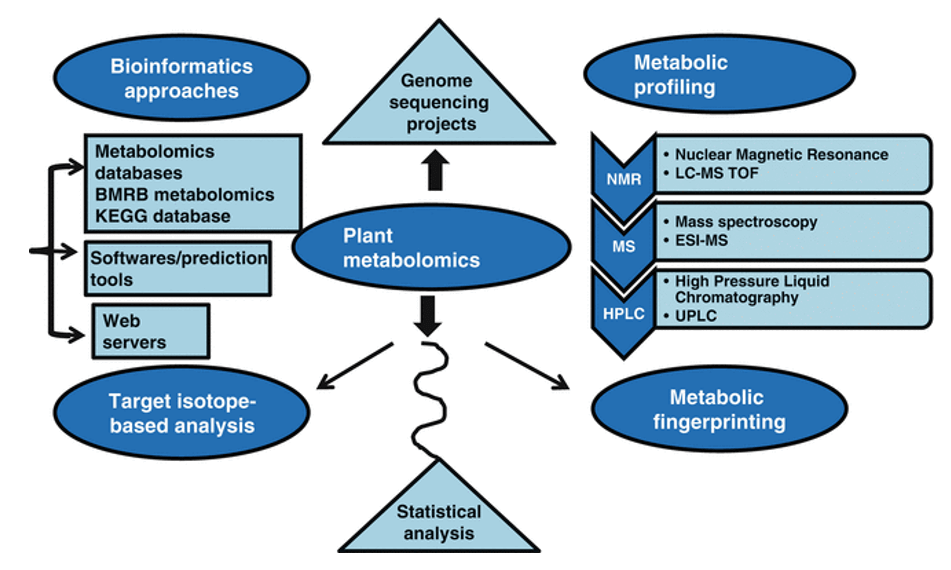
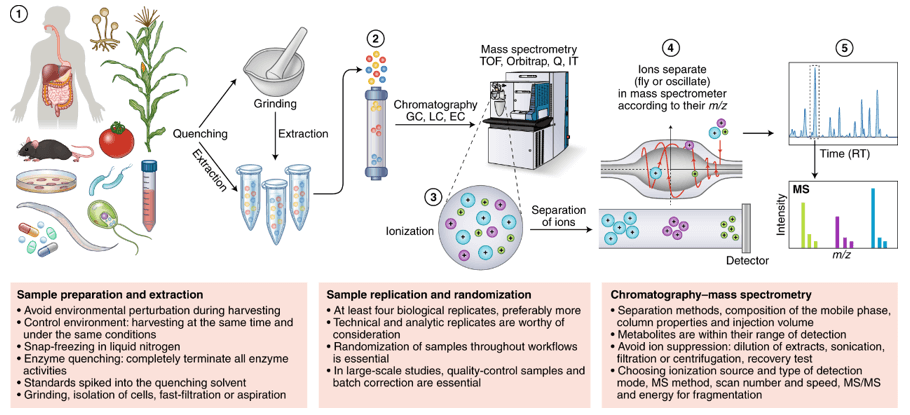
Targeted metabolomics is mainly used to identify and quantitatively analyze specific metabolites in samples, this method has been widely used to analyze and compare multiple target metabolites in different physiological states. It is a key analysis method for researches on green plants to improve nutrition and so on. Based on the LC-MS/MS platform, Creative Proteomics use analytical standard detection methods to perform accurate qualitative and quantitative analysis on the pre-screened and validated or identified potential biomarkers (chlorophyll f).
Sample requirements
Algae
Fresh algae ≥ 300mg
Algae freeze-dried powder ≥ 30mg
And need more than 6 biological replicates
Plant tissue
Plant samples need to be freeze dried, fresh plant samples need more than 3g. And it is necessary to mix the tissues from 3 plants together as a sample. And need more than 6 biological replicates.
※All samples should be stored at -80°, transported on dry ice, and cannot be repeatedly frozen and thawed.
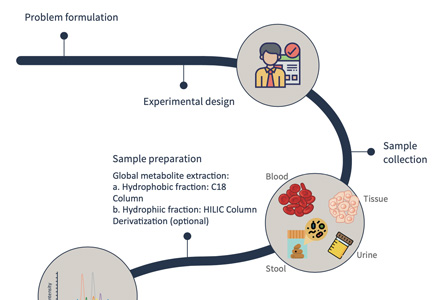
Workflow of targeted metabolomics of chlorophyll f
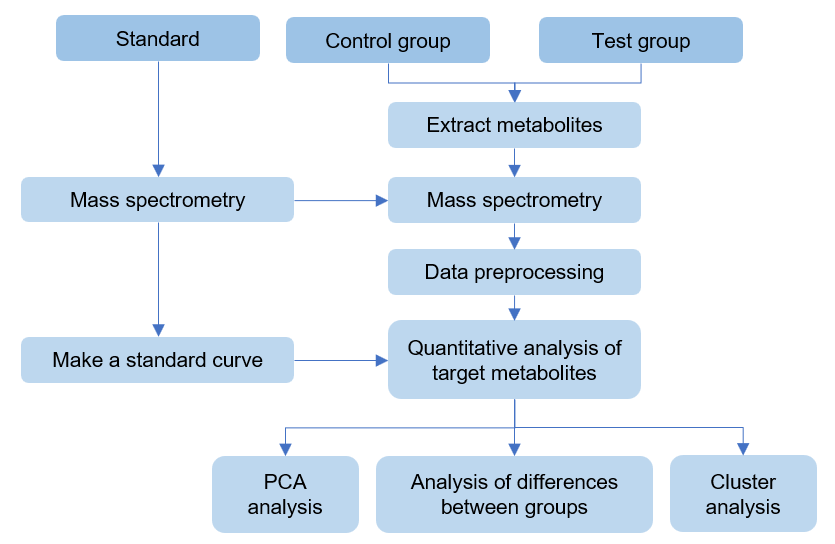
Design experiments and sample processing
Standard preparation and mass spectrometry detection
Make standard curve
Extraction of metabolites in samples
Raw data preprocessing
Qualitative and quantitative target metabolites
Bioinformatics analysis (PCA analysis, cluster analysis, difference analysis, etc.)
Analysis of differences between different groups
Extended analysis, such as metabolite screening, KEGG pathway analysis and hierarchical clustering
Provided by Creative Proteomics
After the project is completed, Creative Proteomics will provide detailed technical reports, including
Experimental steps
Related mass spectrometry parameters
Mass spectrum picture
Raw data
Chlorophyll f content information
Project cycle
About 1-3 weeks
Technical advantages
Qualitatively accurate
Check the secondary spectra of sample materials and of standard products one by one.
Quantitatively accurate
Choose the best ion pair to ensure accurate quantification of the substance.
High sensitivity
Based on advanced mass spectrometry platform to ensure high sensitivity.
Targeted metabolomics based on mass spectrometry can more sensitively and more accurately quantify target metabolites. With decades of experience in mass spectrometry services, Creative Proteomics undertakes the qualitative and quantitative analysis of a variety of plant metabolites, provides accurate and detailed data and analysis reports. From sample extraction and detection to bioinformatics, Creative Proteomics can meet your special needs, and has a good record. If you want to know more, please contact us immediately.