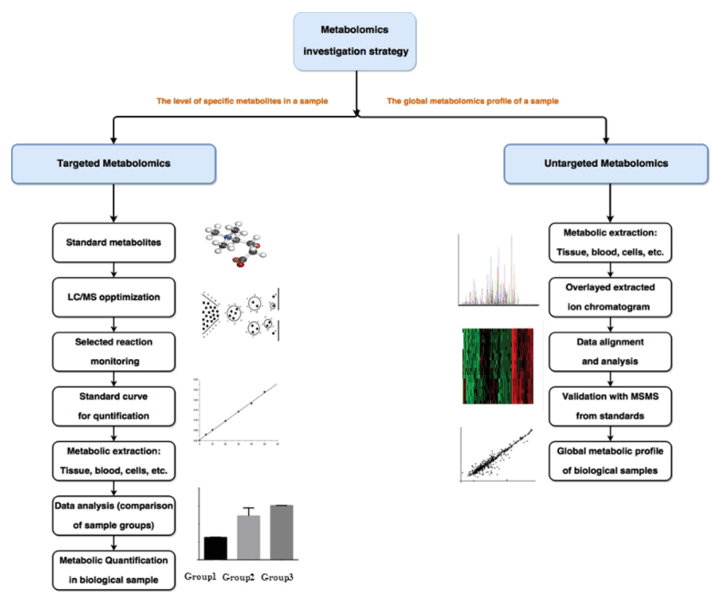
What Is GAG Analysis and LC–MS/MS Profiling?
Glycosaminoglycans (GAGs) – including heparan sulfate (HS)/heparin (HP), chondroitin sulfate (CS), dermatan sulfate (DS), keratan sulfate (KS), and hyaluronan (HA) – are key components of the extracellular matrix and cell surface glycocalyx. Their chain length, sulfation pattern, and degradation dynamics are tightly linked to:
- Cell signaling and growth factor binding
- Tumor and immune microenvironment remodeling
- Vascular/endothelial glycocalyx integrity
- Cartilage and intervertebral disc degeneration
- Metabolic and rare disease mechanisms
Our GAG profiling and LC–MS/MS analysis service characterizes GAGs at multiple levels: overall content, class-specific composition, disaccharide patterns, and structural remodeling under different experimental conditions. The service is designed for basic and translational research, and can be seamlessly integrated with broader metabolomics studies.
GAG Analysis Services We Provide
Quantitative GAG profiling
- Total and class-specific levels of HS/HP, CS, DS, KS and HA
- Relative or absolute quantification where suitable standards are available
Disaccharide and sulfation-pattern profiling
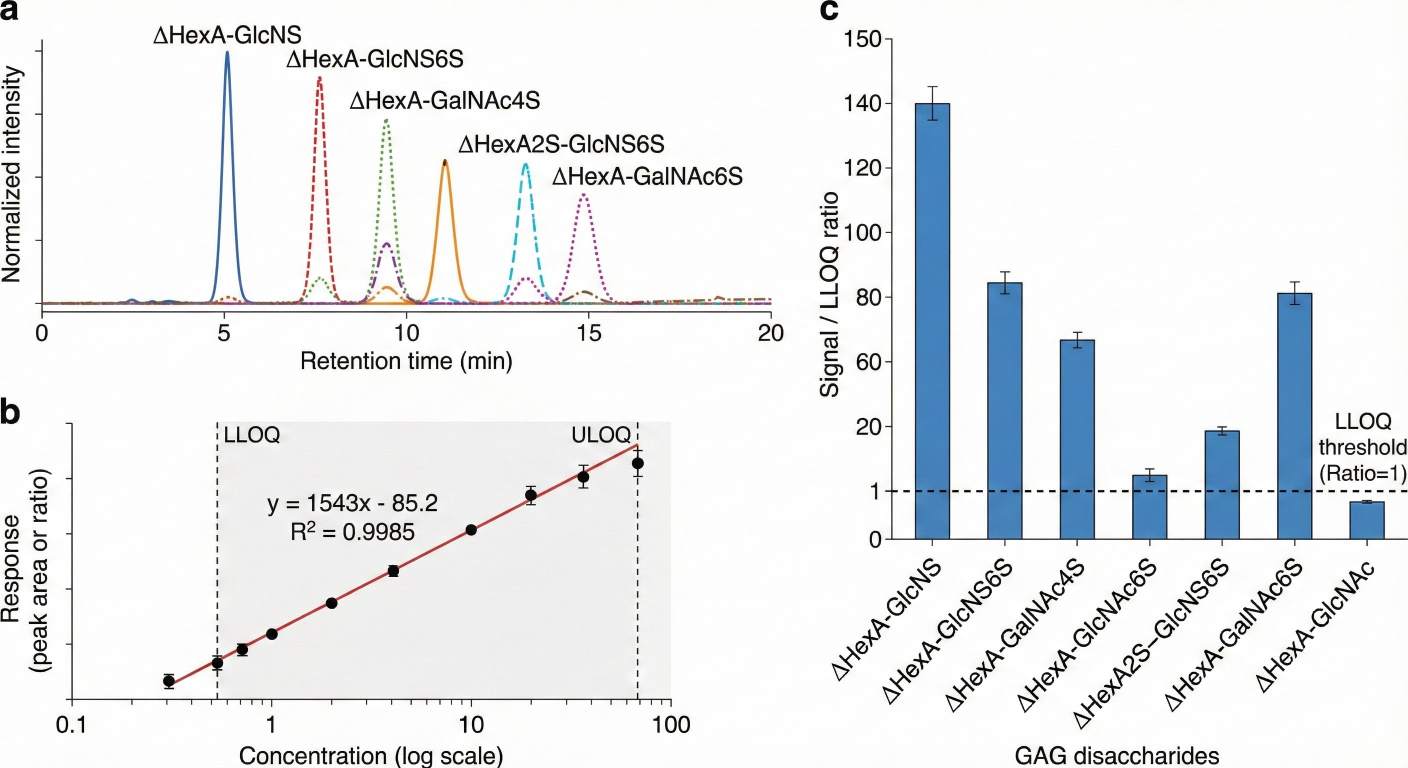
- Enzymatic depolymerization of GAG chains to defined disaccharides
- LC–MS/MS measurement of non-sulfated and sulfated disaccharides to reveal composition and remodeling
Focused HS / CS structural profiling
- Higher-resolution disaccharide panels for HS and CS/DS
- Detection of changes in key N- and O-sulfation motifs relevant to signaling and microenvironment studies
Integration with metabolomics and other omics
- Optional combination with global or targeted metabolomics
- Pathway-level interpretation of GAG metabolism, ECM–receptor interaction and related metabolic networks
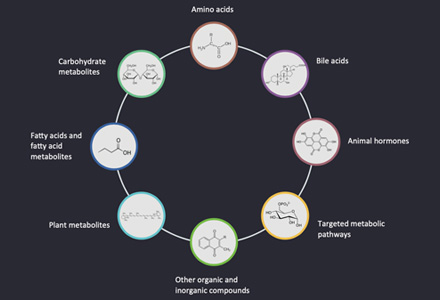
Analytical Coverage: GAG Types and Disaccharide Panels
GAG Classes and LC–MS/MS Coverage
| GAG class |
Abbreviation |
Typical research focus |
| Heparan sulfate / Heparin |
HS / HP |
Tumor and immune microenvironment, endothelial glycocalyx, signaling studies |
| Chondroitin sulfate |
CS |
Cartilage and intervertebral disc biology, ECM remodeling |
| Dermatan sulfate |
DS |
Connective tissue, skin and vascular ECM research |
| Keratan sulfate |
KS |
Cartilage and disc homeostasis and degeneration models |
| Hyaluronan (Hyaluronic acid) |
HA |
Biofluids, ECM extracts, tissue engineering and biomaterials |
Disaccharide Panel Options
| Panel type / level |
Typical disaccharides included |
Typical research focus |
| Non-sulfated disaccharides |
HA-derived and non-sulfated HS/CS/DS disaccharides |
Baseline GAG content; comparison of overall chain abundance |
| Mono-sulfated disaccharides |
4-O-, 6-O-, 2-O- and N-sulfated HS/CS/DS disaccharides (depending on standards) |
Detection of subtle changes in sulfation motifs under different conditions |
| Di- and multi-sulfated species |
Selected di- and multi-sulfated HS/CS/DS disaccharides |
Studies of highly sulfated regions linked to growth factor and chemokine binding |
| HS-focused disaccharide panel |
HS/HP disaccharides with distinct N- and O-sulfation motifs |
HS/HP remodeling in tumor microenvironment, glycocalyx and signaling pathways |
| CS/DS/KS-focused panel |
CS, DS and KS disaccharides relevant to cartilage, disc and ECM biology |
Cartilage degeneration, disc disease, tissue engineering and ECM quality assessment |
| Broad multi-GAG panel |
Combined HS/HP + CS/DS + KS + HA disaccharides |
Plasma/serum/urine and multi-tissue profiling in systemic or longitudinal studies |
Why Choose Our GAG Analysis Services?
- Specialized in GAGs and ECM biology
Our methods and reporting are built around real projects in oncology, vascular biology, cartilage/disc research and functional polysaccharides – not generic, one-size-fits-all metabolomics.
- High information per run
Multi-class panels (HS/HP, CS/DS, KS, HA) and broad disaccharide coverage in a single LC–MS/MS workflow help reduce batch effects and keep per-sample costs under control.
- Efficient with precious samples
The workflow works with small volumes and diverse matrices, including plasma/serum, tissues, cell pellets, organoids, ECM extracts and biomaterials.
- Robust QC and easy-to-use results
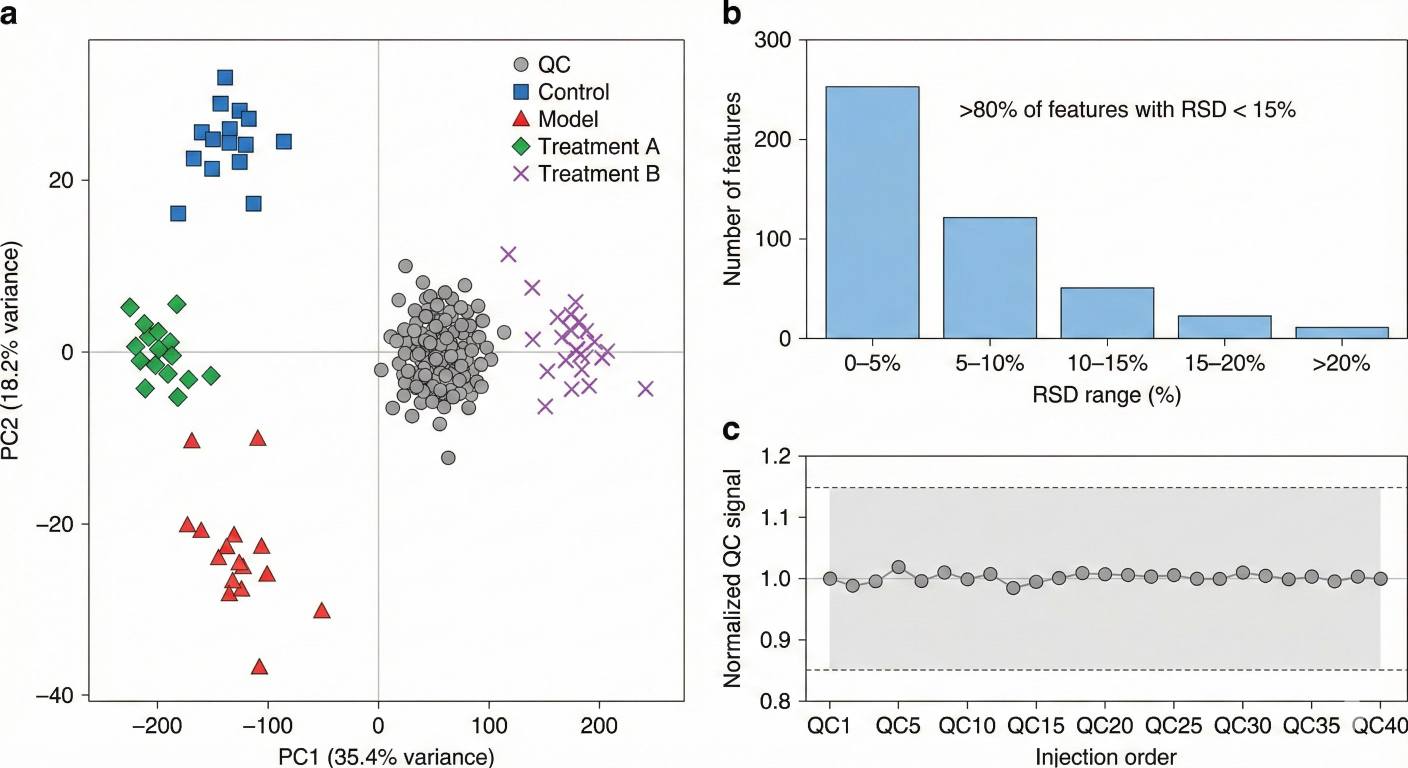
Internal standards, pooled QCs and controlled batch design support reproducible quantitation, while standardized tables and clear visual summaries make downstream analysis and reporting straightforward.
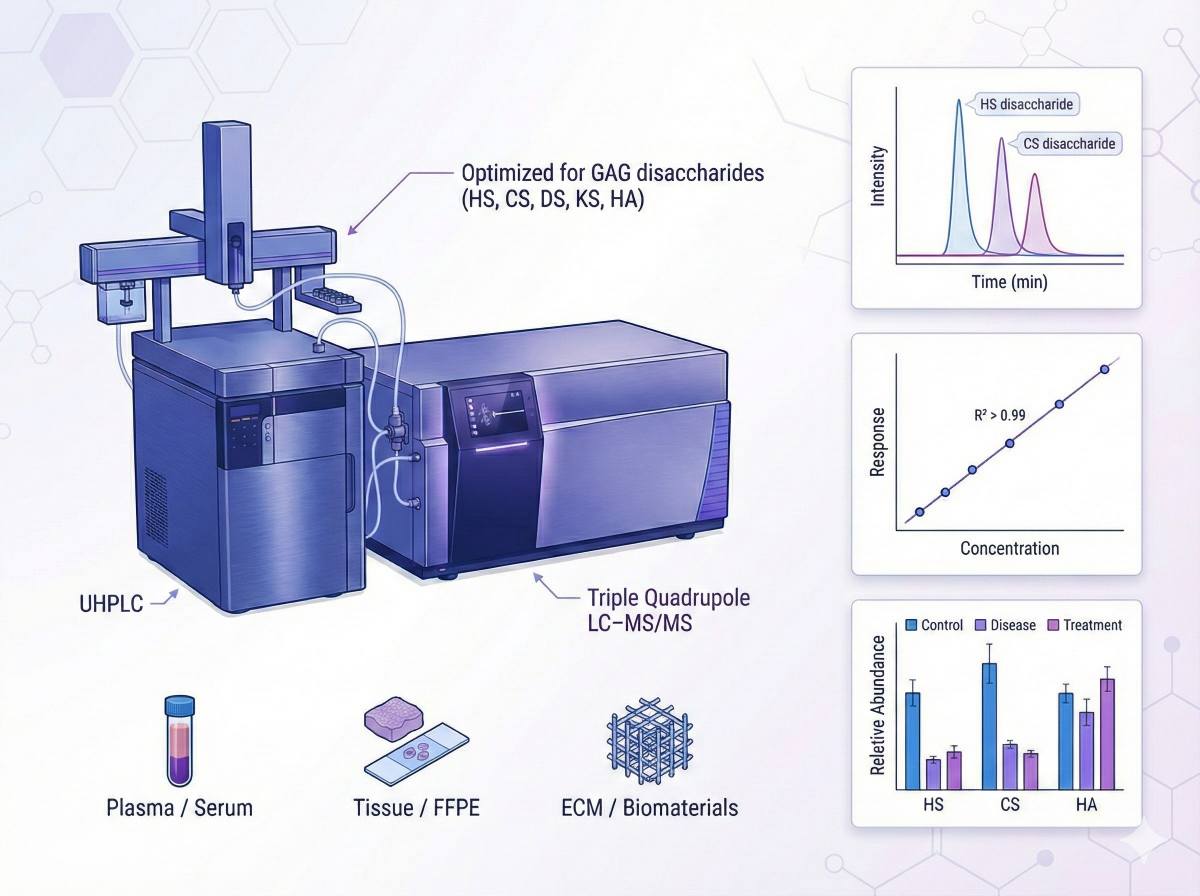
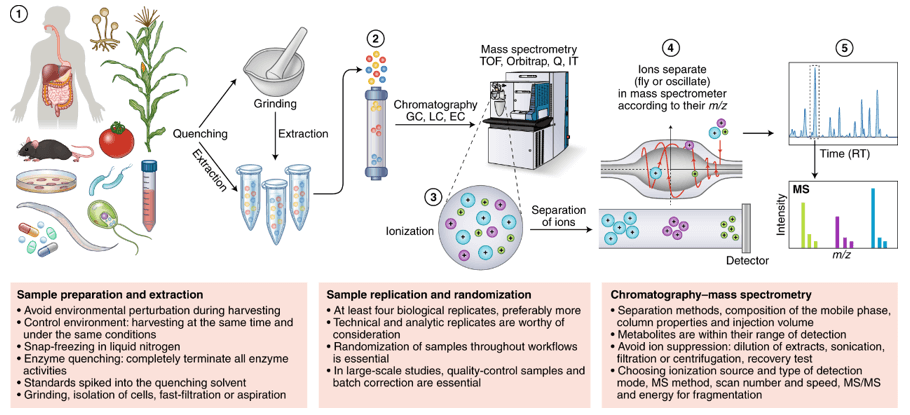
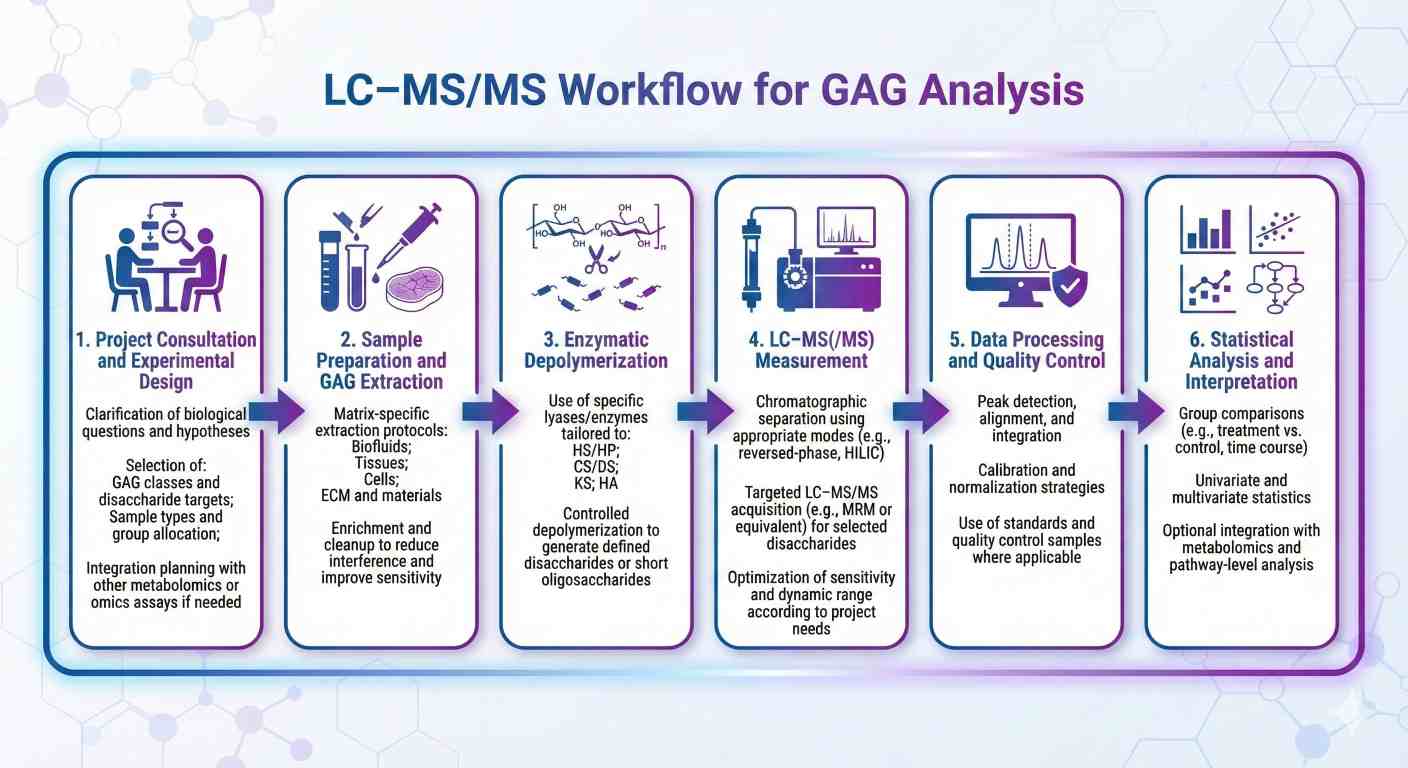
Platform and Analytical Methods for GAG Analysis
Our GAG assays are built on mainstream LC–MS platforms widely used in metabolomics and glycomics, with settings optimized for disaccharide sensitivity and reproducibility.
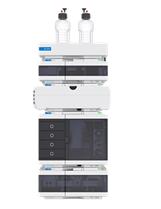
UHPLC separation
- Systems: high-performance UHPLC (e.g., Agilent 1290)
- Columns: 2.1 × 100–150 mm, 1.7–2.6 μm amide or C18 columns for GAG disaccharides
- Typical run time: ~20–30 min per sample, optimized for baseline separation of key GAG species
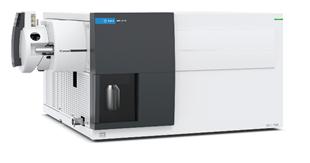
Targeted LC–MS/MS quantification
- Mass spectrometers: triple quadrupole instruments (e.g., Agilent 6495C)
- Ionization & mode: ESI negative, MRM transitions for each disaccharide
- Performance: linear dynamic range ≥ 3–4 orders of magnitude; typical intra-batch CVs < 15% for qualified peaks
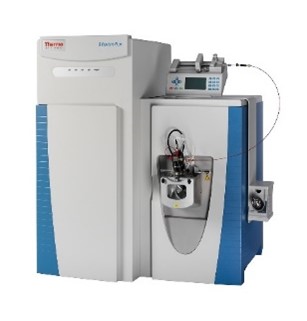
High-resolution LC–MS for structural confirmation (on demand)
- Platforms: Orbitrap-type MS (e.g., Q Exactive class) for selected samples
- Use: full-scan and MS/MS to confirm disaccharide identities and complex sulfation motifs when required
Built-in QC and stability control
- Stable or structural analog internal standards where available
- Pooled QC injections throughout the batch to monitor retention time, signal stability and system performance
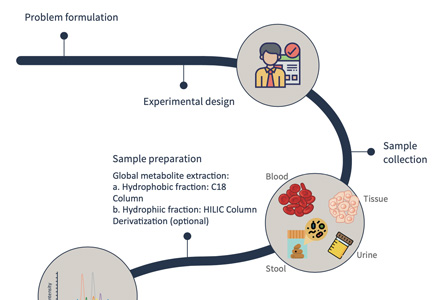
How Our GAG Analysis Works
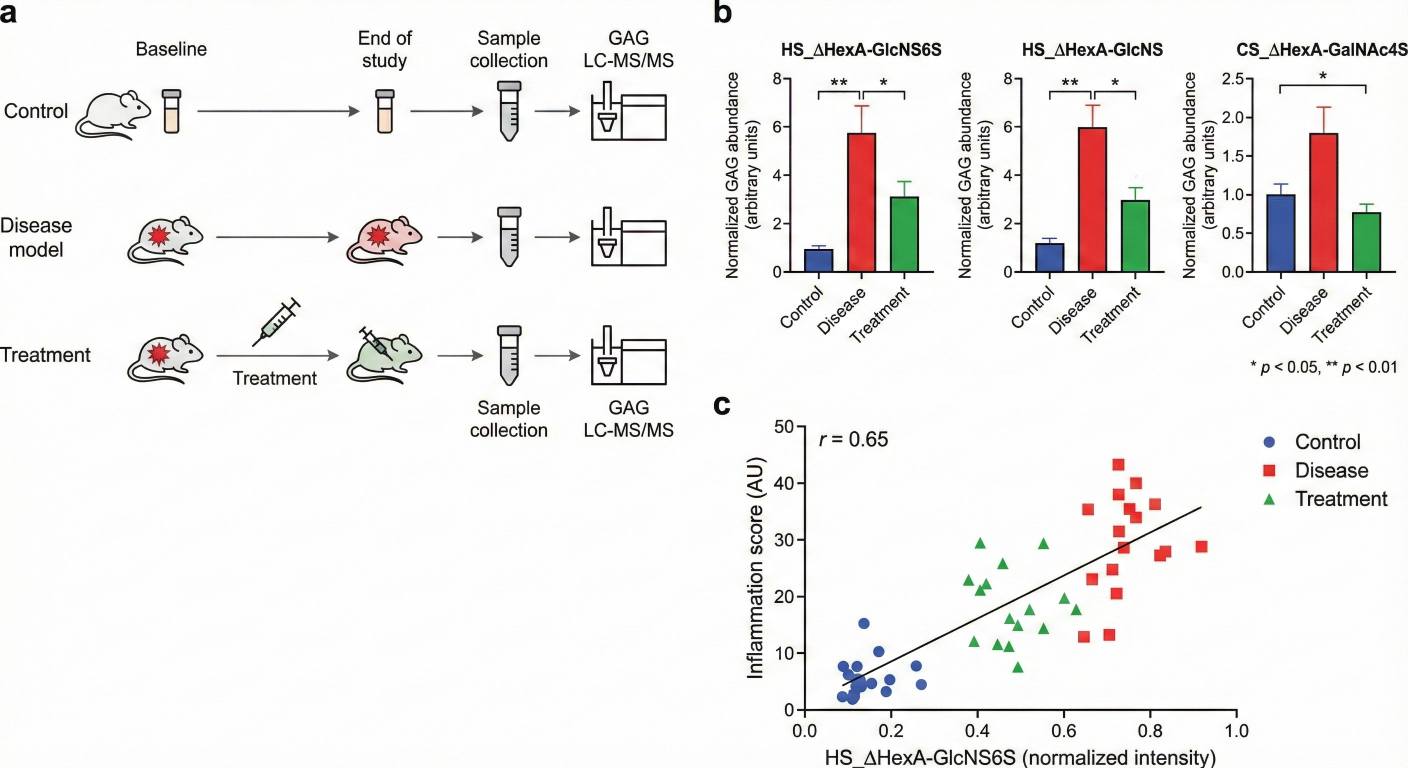
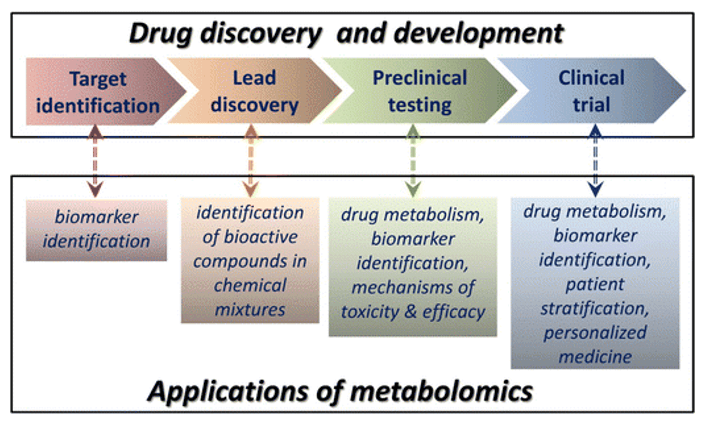
Research Applications of GAG Profiling
How to Prepare and Submit Samples for GAG Analysis
| Sample type |
Minimum amount (per sample) |
Recommended container |
Storage conditions |
Shipping notes |
| Plasma / Serum |
≥ 100 µL |
Low-protein-binding microtube (1.5 mL) |
Store at −80 °C; avoid repeated freeze–thaw |
Ship on dry ice; clearly label sample ID and matrix |
| Urine |
≥ 500 µL |
Polypropylene tube (1.5–2.0 mL) |
Store at −80 °C |
Ship on dry ice; avoid preservatives unless discussed |
| Tissue (fresh / frozen) |
≥ 20–30 mg wet weight |
Cryovial or sealed tube |
Snap-freeze and store at −80 °C |
Ship on dry ice; indicate tissue type and species |
| Tissue (FFPE or sectioned) |
≥ 3–5 sections (5–10 µm each) |
Slide box or sealed container |
Store at room temperature, dry and protected |
Contact us in advance for FFPE-specific instructions |
| Cell pellets |
≥ 1 × 10⁶ cells or visible pellet |
Low-protein-binding microtube |
Spin down, remove supernatant, store at −80 °C |
Ship on dry ice; note cell line and culture conditions |
| Culture supernatant / media |
≥ 500 µL |
Polypropylene tube |
Store at −80 °C |
Ship on dry ice; indicate medium and treatment info |
| ECM / hydrogels / scaffolds |
≥ 10–20 mg or one representative piece |
Sealed tube or sterile container |
Store at −20 °C or −80 °C (as applicable) |
Ship frozen; describe material composition and size |
| Marine / other extracts |
≥ 10–20 mg solid or ≥ 500 µL liquid |
Sealed tube (solid or solution) |
Store at −20 °C or −80 °C |
Ship frozen; provide extraction buffer/solvent details |
General Recommendations
- Labeling:Use clear, waterproof labels with sample ID, matrix and group information.
- Aliquots:If possible, send single-use aliquots to avoid repeated freeze–thaw cycles.
- Documentation:Include a sample list (Excel or CSV) with sample IDs, groups, species, matrix and any key treatments or time points.
Deliverables: What You Receive from GAG Analysis
Sample and ID summary – A clear sample list with IDs, groups, matrix and any key metadata (Excel/CSV).
Processed quantitative tables – GAG class-level and disaccharide-level values for each sample, with units and basic annotations (Excel/CSV).
Basic group comparison – Mean, SD/SEM, fold-change and simple significance flags (e.g. p-values) for defined groups.
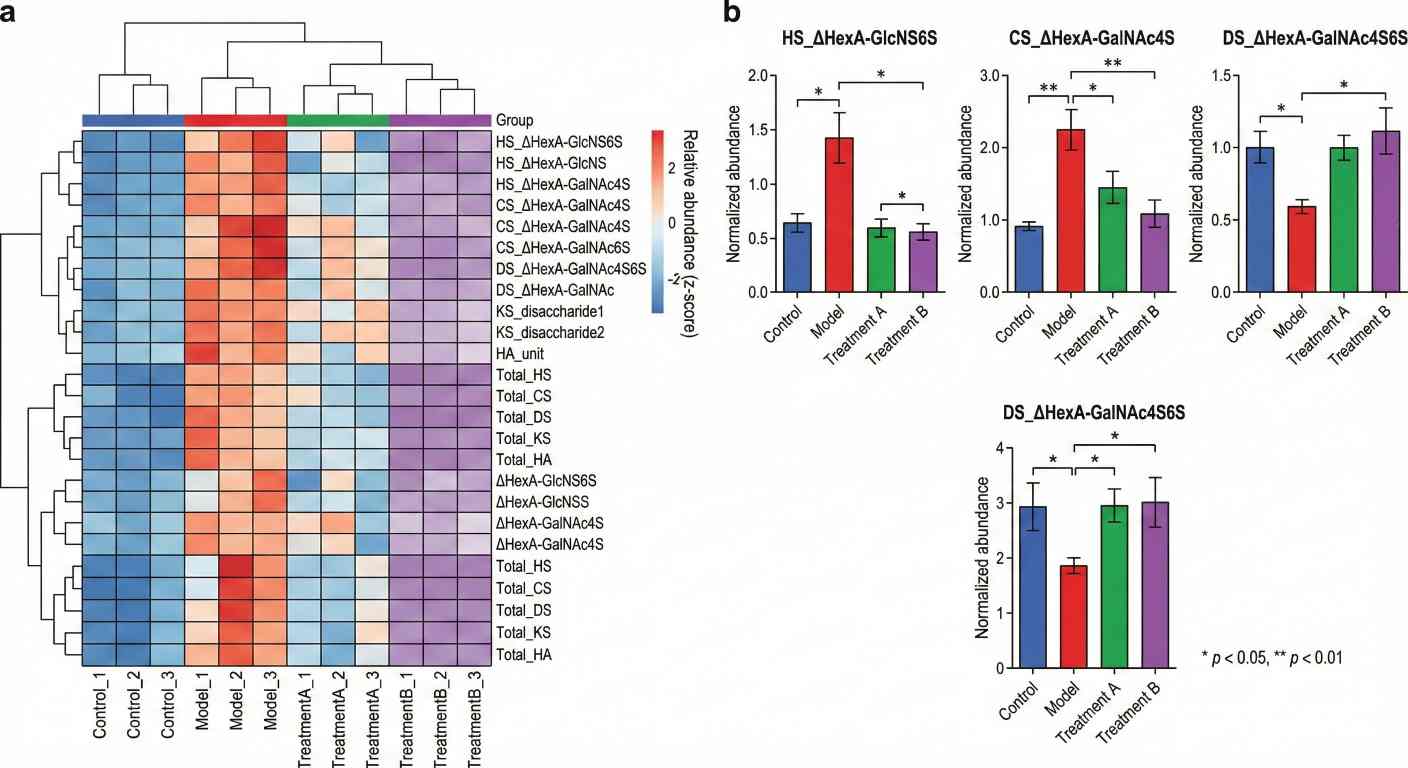
Key overview figures – 1–3 core plots (such as heatmaps, bar charts and/or PCA/cluster overviews) in common image formats.
Method and QC summary – A concise description of sample preparation, LC–MS/MS settings, quantification and QC strategy suitable for methods sections.
Raw data on request – LC–MS(/MS) raw files can be provided if you need to perform additional in-house analyses.
A comprehensive biochemical characterization of settlement stage leptocephalus larvae of bonefish (Albula vulpes)
Uribe, V., Wills, P. S., Shenker, J. M., et al.
Journal: Journal of Fish Biology
Year: 2021
DOI: https://doi.org/10.1111/jfb.14846
Multiomics of a rice population identifies genes and genomic regions that bestow low glycemic index and high protein content
Badoni, S., Pasion-Uy, E. A., Kor, S., Kim, S. R., Tiozon Jr, R. N., Misra, G., ... & Sreenivasulu, N.
Journal: Proceedings of the National Academy of Sciences
Year: 2024
DOI: https://doi.org/10.1073/pnas.2410598121
The Brain Metabolome Is Modified by Obesity in a Sex-Dependent Manner
Norman, J. E., Milenkovic, D., Nuthikattu, S., & Villablanca, A. C.
Journal: International Journal of Molecular Sciences
Year: 2024
DOI: https://doi.org/10.3390/ijms25063475
Physiological, transcriptomic and metabolomic insights of three extremophyte woody species living in the multi-stress environment of the Atacama Desert
Gajardo, H. A., Morales, M., Larama, G., Luengo-Escobar, A., López, D., Machado, M., ... & Bravo, L. A.
Journal: Planta
Year: 2024
DOI: https://doi.org/10.1007/s00425-024-04484-1
Effects of microbial phytase on mucin synthesis, gastric protein hydrolysis, and degradation of phytate along the gastrointestinal tract of growing pigs
Mesina, V. G., Lagos, L. V., Sulabo, R. C., Walk, C. L., & Stein, H. H.
Journal: Journal of Animal Science
Year: 2019
DOI: https://doi.org/10.1093/jas/sky439