Why Analyze Heparan Sulfate and Heparin?
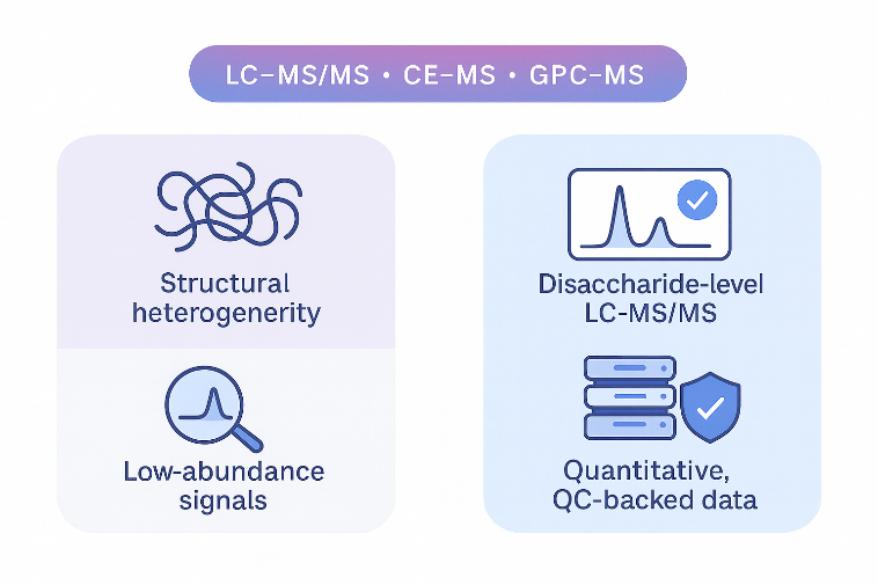
Heparan sulfate (HS) and heparin are structurally diverse glycosaminoglycans (GAGs) that play essential roles in biological signaling, extracellular matrix integrity, and disease progression. Their functions are not dictated by a single sequence but by subtle differences in disaccharide composition, sulfation motifs, and chain length distribution.
These complex features govern interactions with growth factors, cytokines, and enzymes—making HS/heparin pivotal in coagulation regulation, lysosomal storage disorders (MPS), tumor progression, and host–pathogen interactions. Yet, conventional glycan detection methods often fail to resolve these fine structural determinants, leaving gaps in interpretation and comparability across samples.
At Creative Proteomics, we address this analytical challenge by offering quantitative, disaccharide-resolved LC–MS/MS-based HS/heparin profiling. Our platform allows researchers to:
- Accurately characterize N-, 2-O-, 6-O-, and 3-O-sulfation patterns
- Quantify total HS/heparin levels in serum, tissue, urine, and bioprocess samples
- Compare structural fingerprints across models, conditions, or drug lots
Whether you're working on MPS biomarkers, heparin product QC, or ECM remodeling, our GAG-targeted workflows provide actionable molecular resolution—turning structural complexity into scientific clarity.
What We Measure: Quantitative HS/Heparin Profiling
Our service delivers quantitative profiling of heparan sulfate and heparin directly from biological samples including serum, plasma, urine, tissues, cells, and feces. Beyond measuring total content, we resolve key structural and compositional features that govern their biological functions.
Total HS/Heparin Levels
We determine the absolute concentration of HS and/or heparin in each sample (e.g., ng/mL or μg/mg tissue). This global metric is ideal for:
- Monitoring GAG accumulation in metabolic or inflammatory models
- Comparing total GAG burden across conditions or treatment groups
- Supporting research on ECM remodeling or lysosomal storage disorders (RUO)
Disaccharide Composition Analysis
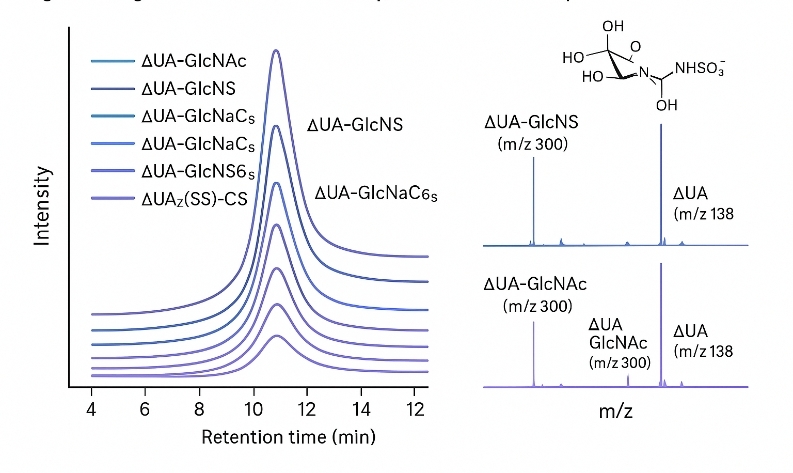
Following enzymatic digestion, HS/heparin chains are converted to discrete disaccharide units, which we quantify using LC–MS/MS with isotope-labeled internal standards. This enables:
- Molar and mass-based quantification of individual disaccharides
- Detection of domain shifts (e.g., NS- vs. NA-regions)
- Generation of sample-specific structural fingerprints
Sulfation Pattern and Epimerization Metrics
Biological specificity resides in where and how GAG chains are sulfated. We calculate:
- N-sulfation vs. N-acetylation ratios
- 2-O-, 6-O-, and 3-O-sulfation motif distribution
- Indicators of C5-epimerase activity (GlcA ↔ IdoA)
These readouts are essential for understanding pathway regulation, enzyme activity, and structural consistency in therapeutic applications.
Chain Length Distribution and GAG Panel Integration
For advanced projects, we can provide:
- Chain-length and polydispersity analysis (via GPC–MS or CE–MS)
- Cross-panel profiling of other GAGs (e.g., CS, DS, KS) or key glycan precursors (e.g., UDP-GlcNAc, PAPS)
This expanded scope supports integrative GAG metabolism studies within your broader omics pipeline.
Analytes Covered in the Heparan Sulfate/Heparin Panel
| Category |
Analyte / Metric |
Description / Purpose |
| Total Content |
Total Heparan Sulfate (HS) |
Global GAG burden across samples (e.g., ng/mL) |
| Total Heparin (if applicable) |
Relevant for drug consistency or degradation studies |
Disaccharide Species
(LC–MS/MS) |
ΔUA–GlcNAc (0S) |
Unsulfated unit – baseline marker |
| ΔUA–GlcNS (NS) |
N-sulfated domain indicator |
| ΔUA–GlcNAc(6S) (6S) |
6-O-sulfation motif |
| ΔUA–GlcNS(6S) (NS6S) |
Dual N-/6-O-sulfation |
| ΔUA(2S)–GlcNAc (2S) |
2-O-sulfation site |
| ΔUA(2S)–GlcNS (NS2S) |
High-sulfated domain marker |
| ΔUA–GlcNS(3S)* (NS3S) |
Rare 3-O-sulfated epitope |
| ΔUA(2S)–GlcNS(6S) (TriS) |
Fully sulfated disaccharide |
Structural Indices
(Derived Metrics) |
NS/NA ratio |
Domain composition indicator |
| Sulfate groups per disaccharide |
Average sulfation density |
| 2-O / 6-O / 3-O sulfation ratio |
Sulfation position balance |
| GlcA / IdoA ratio |
Epimerization marker |
| Chain length & polydispersity* |
Optional via GPC–MS / CE–MS |
| Optional GAG Extensions |
CS/DS disaccharides |
Chondroitin / dermatan sulfate profiling |
| Keratan sulfate fragments |
Matrix remodeling context |
| UDP-GlcNAc, PAPS |
GAG biosynthesis precursors |
*Note: Some analytes are optional or matrix-dependent. TriS and 3-O-sulfation markers may require enhanced sensitivity.
Advantages of Our HS/Heparin Analysis Service
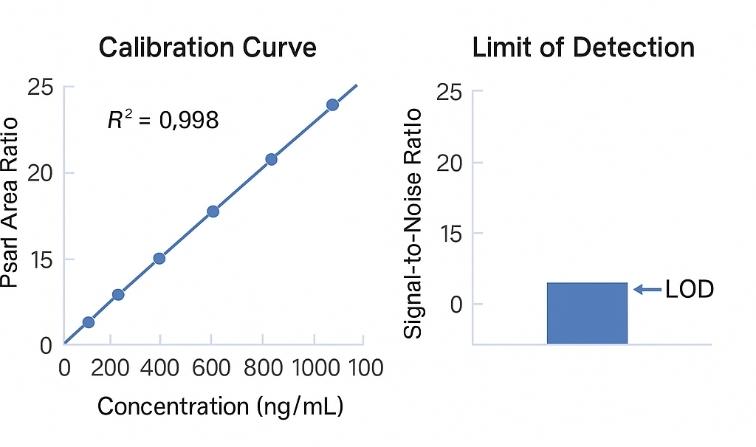
- Absolute Quantification with Internal Standards
Isotope-labeled calibrants ensure accurate disaccharide-level measurement (R² ≥ 0.995, CV ≤ 10%).
- Disaccharide-Level Resolution
Profile ≥8 HS/heparin disaccharides, including mono-, di-, and tri-sulfated motifs.
- Detailed Sulfation Pattern Analysis
Distinguish N-, 2-O-, 6-O-, and optional 3-O-sulfation for structural interpretation.
- Compatible with Real Biological Matrices
Validated for serum, plasma, urine, tissue, and cell samples—no purification required.
- Optional Chain-Length Profiling
Assess molecular weight and polydispersity via GPC–MS or CE–MS.
- Comprehensive QC and Publication-Ready Data
Receive raw files, quantitative tables, calibration curves, and recovery reports.
- Multi-GAG Expansion Available
Add CS, DS, KS disaccharides or precursors like UDP-GlcNAc, all in one project.
Analytical Platforms and Technical Specifications for HS/Heparin Analysis
Our HS/heparin panel runs on a validated targeted metabolomics workflow with high-sensitivity LC–MS/MS at its core. The parameters below outline the data quality and reproducibility you can expect.
Analytical Platforms
| Platform |
Main Models (Typical) |
Primary Use |
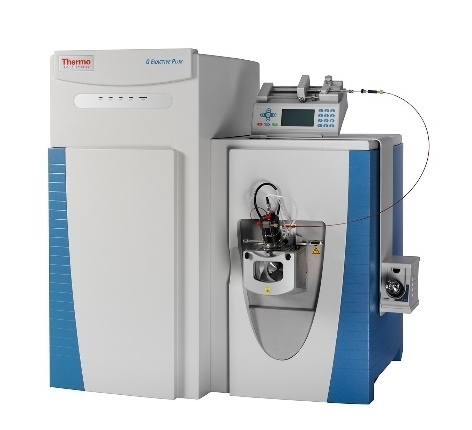
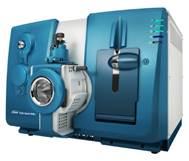
| LC–MS/MS |
Thermo Q Exactive™ HF-X
Sciex Triple Quad™ 6500+ |
Disaccharide identification and quantitative profiling |
| Optional |
GPC–MS / CE–MS (on request) |
Chain-length distribution and sulfation isomer resolution |
Quantitative Method Highlights
| Parameter |
Specification (Typical) |
| Acquisition mode |
MRM (triple quad) and/or Full MS ± MS/MS (Orbitrap) |
| Calibration strategy |
13C/15N-labeled HS/heparin disaccharide internal standards |
| Calibration linearity |
R² ≥ 0.995 across the validated range |
| Intra-assay precision (CV) |
≤ 10% for most disaccharides |
| Sensitivity (LOD/LOQ) |
Low ng/mL range, matrix-dependent |
| Reporting |
Absolute and relative concentrations, derived structural indices |
Quality Control
- Batch-specific blanks, calibration standards, and QC samples included
- Continuous monitoring of internal standard recovery and retention time stability
- Review of peak shape and integration for each reported disaccharide
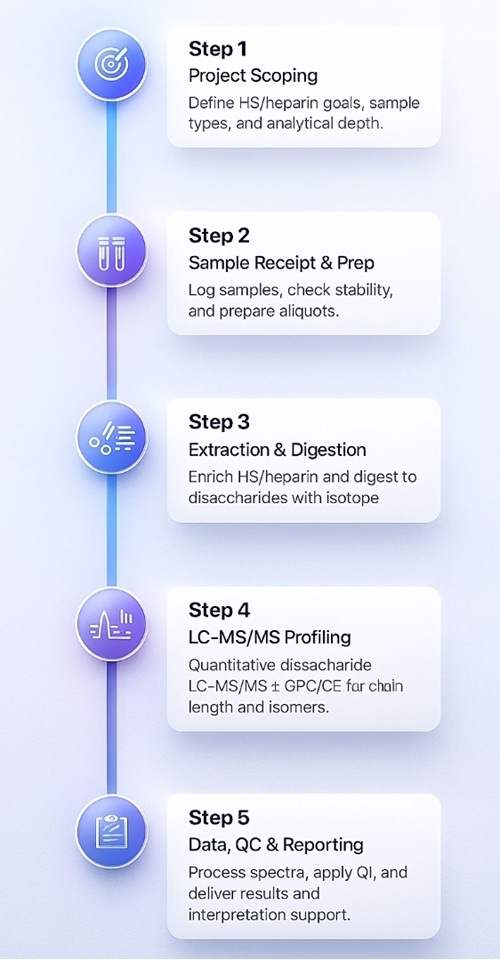
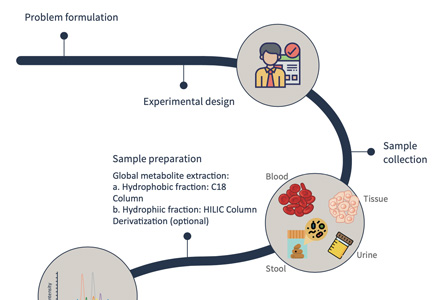
Step-by-Step Workflow for HS/Heparin LC–MS/MS Analysis
How to Submit Samples for HS/Heparin LC–MS/MS Analysis
| Sample Type |
Minimum Amount |
Container / Handling Notes |
| Serum / Plasma |
≥ 500 μL |
Collect, centrifuge, aliquot clear supernatant; store at −80 °C. Avoid repeated freeze–thaw. |
| Anticoagulated Blood (EDTA) |
≥ 1 mL |
Mix gently with anticoagulant, aliquot, freeze at −80 °C as soon as possible. |
| Urine |
≥ 1 mL |
Collect midstream if possible, aliquot, add preservative if required, store at −80 °C. |
| Tissue (animal or human research samples) |
≥ 200 mg |
Snap-freeze in liquid nitrogen after collection; store at −80 °C in pre-labeled tubes. |
| Cells (adherent or suspension) |
≥ 1 × 10⁷ cells |
Wash to remove medium, pellet, remove supernatant, freeze pellets at −80 °C. |
| Feces |
≥ 500 mg |
Collect into sterile tubes, avoid cross-contamination, freeze at −80 °C. |
General Handling Guidelines
- Use pre-chilled tubes where possible and minimize time at room temperature.
- Avoid repeated freeze–thaw cycles; prepare multiple small aliquots instead of one large vial.
- Clearly record matrix, species, treatment groups, collection time points, and any stabilizers or anticoagulants used.
- Ship samples on dry ice with sufficient coolant to maintain frozen conditions until arrival.
What You Receive: HS/Heparin Analysis Deliverables
Raw data files: LC–MS/MS instrument files (and GPC–MS/CE–MS, if included in the project), provided in native or agreed converted formats.
Quantitative result tables: Spreadsheet with per-sample results, including total HS/heparin levels, quantified disaccharides, and any agreed structural indices (e.g., NS/NA ratio, sulfation pattern metrics).
QC summary: Bief overview of calibration performance (e.g., linearity), internal standard recovery, and repeatability (CV) to support data reliability assessment.
Method summary: Short description of sample preparation, enzymatic digestion, analytical platform, and data processing workflow, suitable for use in internal reports or manuscript Methods
Use Cases of Heparan Sulfate/Heparin Quantification
Quantifying forms and functions of intestinal bile acid pools in mice
Sudo, K., Delmas-Eliason, A., Soucy, S., Barrack, K. E., Liu, J., Balasubramanian, A., ... & Sundrud, M. S.
Journal: bioRxiv
Year: 2024
Untargeted metabolomics reveal sex-specific and non-specific redox-modulating metabolites in kidneys following binge drinking
Rafferty, D., de Carvalho, L. M., Sutter, M., Heneghan, K., Nelson, V., Leitner, M., ... & Puthanveetil, P.
Journal: Redox Experimental Medicine
Year: 2023
Metabolomic Studies in Girls With Central and Peripheral Precocious Puberty
Özyurt, A. B., Reçber, T., Nemutlu, E., Buluş, D., Kır, S., Gümüşel, B. K., & Erkekoğlu, P.
Journal: Fabad Journal of Pharmaceutical Sciences
Year: 2023