What Is S-Adenosylmethionine (SAM) and Why Analyze It?
S-Adenosylmethionine (SAM) is the universal methyl donor in cells. It donates its methyl group to DNA, RNA, proteins, phospholipids, and small-molecule metabolites through the action of diverse methyltransferases. During these reactions, SAM is converted to SAH, which can inhibit many methyltransferases if it accumulates.
Because of this central role:
- SAM concentration reflects the capacity of the methionine cycle to generate activated methyl groups.
- SAH concentration reflects the product load of methylation reactions and can act as a negative regulator.
- The SAM/SAH ratio is widely used as an indicator of cellular methylation potential.
Accurate SAM analysis helps you directly evaluate:
- Whether an intervention affects methylation capacity rather than only downstream gene expression.
- How nutrient availability, oxidative stress, or enzyme inhibition perturbs one-carbon metabolism.
- Whether observed epigenetic changes are supported by the underlying methyl donor pool.
What Biological Questions Can SAM Analysis Answer?
Well-designed SAM and SAH measurements can support a wide range of research questions, for example:
- Does a methyltransferase inhibitor reduce the SAM/SAH ratio in the target tissue?
- Do dietary interventions or nutrient formulations alter one-carbon metabolism in plasma or liver?
- How does oxidative or ER stress reshape methylation potential in cell models?
- Is the methionine cycle upregulated or constrained in specific disease models or genetic backgrounds?
- Are observed changes in DNA or histone methylation consistent with shifts in SAM and SAH pools?
By integrating SAM data with other methionine cycle intermediates (e.g., methionine, homocysteine, cystathionine, glutathione), you can move from isolated metabolite readouts to a coherent pathway-level interpretation of your model.
Our SAM Analysis Service Offerings
Core Quantification Options
- Single-analyte SAM quantification – Ideal for focused studies on SAM abundance and its role in cellular metabolism or disease progression.
- SAM + SAH + SAM/SAH ratio – Simultaneous quantification of SAM and SAH enables accurate calculation of methylation potential, a critical parameter in epigenetic and metabolic studies.
Pathway-Oriented Metabolite Panels
- Extended One-Carbon Metabolism Panel – Includes methionine, homocysteine, and cysteine alongside SAM/SAH, enabling a fuller view of the methionine cycle and methylation flux.
- Full One-Carbon Metabolism Profiling – Designed for advanced studies in epigenetics, oncology, and cardiovascular research. This panel expands further to include folate derivatives, vitamin B12-related cofactors, and selected intermediates from the transmethylation and transsulfuration branches.
- Custom methylation cofactor panels – Tailored panels that integrate SAM/SAH with methyl donors, redox metabolites, or B-vitamin–linked compounds to contextualize methylation dynamics.
Study-Specific Analytical Services
- Comparative profiling – Detect SAM pathway changes across experimental conditions, treatment groups, or genetic backgrounds.
- Mechanism-of-action support – Link SAM and SAH modulation to methyltransferase inhibitors, oxidative stress, or nutrient interventions.
- Integrated targeted metabolomics – Combine SAM measurements with redox, amino acid, or nucleotide profiling for systems-level interpretation.
List of Metabolites in SAM-Related Targeted Analysis Panels
| Pathway Segment |
Detectable Metabolites |
| Methyl Donors |
S-adenosylmethionine (SAM), Methionine, Betaine, Choline, Creatine |
| Methylation Products & Inhibitors |
S-adenosylhomocysteine (SAH), Homocysteine, Dimethylglycine (DMG), Adenosine, S-methylcysteine |
| Transsulfuration & Redox |
Cystathionine, Cysteine, Glutathione (GSH), Oxidized Glutathione (GSSG), Taurine |
| Folate & Vitamin Cofactors |
5-Methyltetrahydrofolate (5-MTHF), 5-Formyltetrahydrofolate (Folinic acid), Methylcobalamin (Vitamin B12), Serine, Glycine |
Note: Panel composition can be customized based on your pathway focus, sample matrix, and project goals. Not all metabolites are available in all matrices; please consult our technical team during project planning.
Advantages of Our SAM Analysis Service
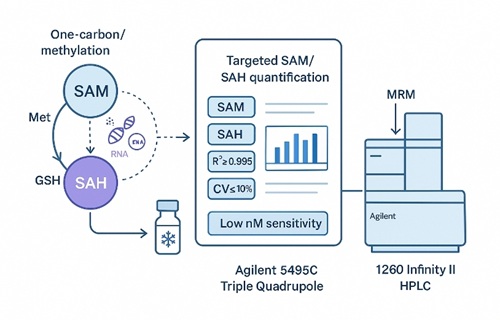
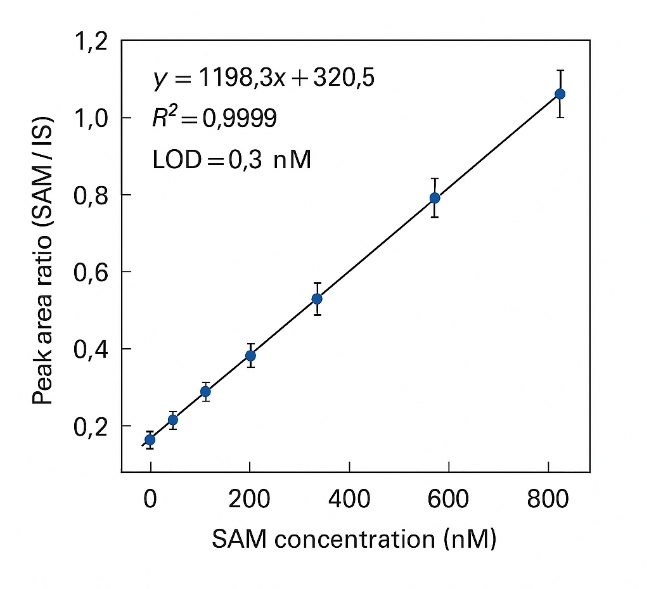
- Analytical precision you can rely on: LC–MS/MS with isotope-labeled internal standards achieves R² ≥ 0.995 and CV ≤ 10% across replicates.
- Built-in protection against SAM degradation: Our method includes cold-chain processing, acidified extraction, and short hold times to preserve signal integrity.
- Matrix-optimized quantification: Method parameters are adapted to plasma, tissue, or cell extracts to minimize matrix effects and ensure recovery.
- Pathway-aware data for mechanistic insight: Results support interpretation in methylation, redox, and one-carbon metabolism pathways—not just raw concentrations.
Instrumentation and Analytical Parameters for SAM and SAH Quantification
Creative Proteomics quantifies SAM and SAH using a high-sensitivity LC–MS/MS platform optimized for low-abundance, labile methylation metabolites and pathway-level interpretation.
Core Instrumentation
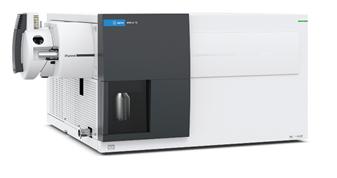
Agilent 6495C Triple Quadrupole LC–MS/MS
High-sensitivity triple quadrupole system for targeted MRM quantification of SAM, SAH, and related one-carbon metabolites.
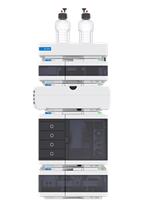
Agilent 1260 Infinity II HPLC
Reliable front-end HPLC providing stable, high-resolution separation of polar methylation metabolites prior to MS detection.
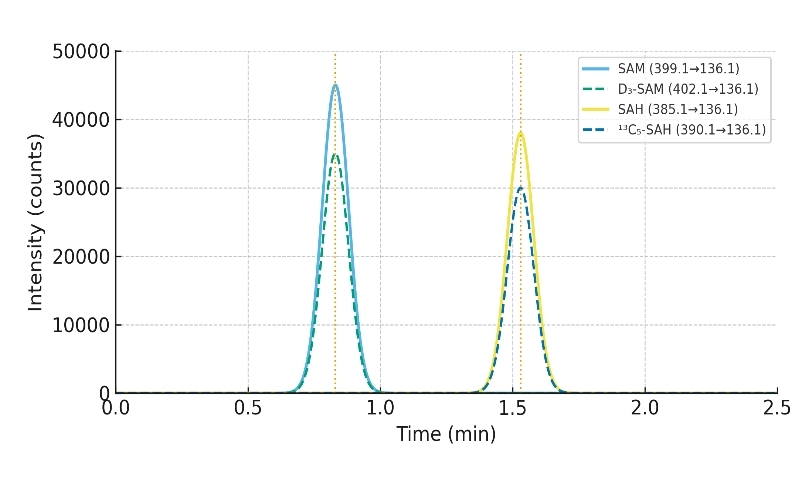
Ionization and acquisition mode
Positive ESI with Multiple Reaction Monitoring (MRM), using optimized transitions for SAM (m/z 399 → 250) and SAH (m/z 385 → 136) and stable isotope–labeled internal standards (e.g., ¹³C₅-SAM, ¹³C₅-SAH)
Method Performance Parameters
| Metric |
Typical Performance |
| Calibration linearity |
R² ≥ 0.995 (6–8 calibration levels) |
| Limit of detection (LOD) |
Typically < 1 nM |
| Limit of quantification (LOQ) |
Typically 1–5 nM |
| Inter-batch CV (QC level) |
≤10% for monitored QC samples |
| Retention time precision |
±0.2 min across batches |
| Quality control |
Matrix-matched standards, blanks, and recovery spikes included in each run |
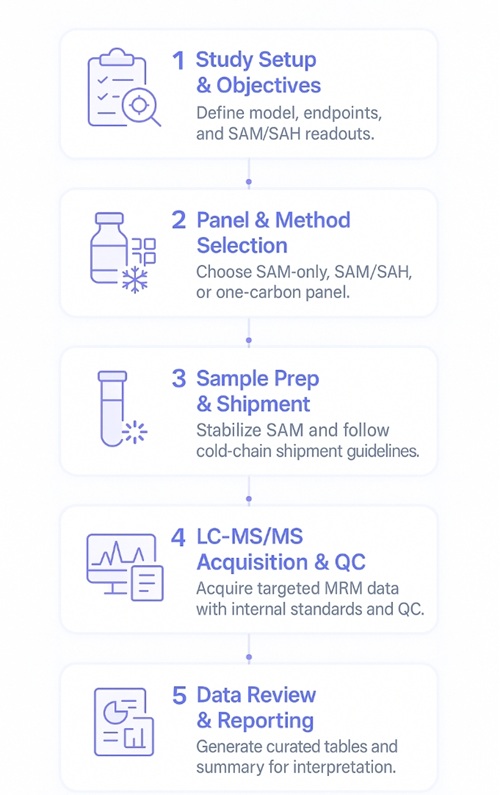
Workflow for SAM/SAH Analysis
Sample Types and Handling for Accurate SAM Analysis
| Sample Type |
Minimum Amount |
Storage Requirements |
Preparation Guidelines |
| Plasma / Serum |
100 µL per sample |
Frozen at –80°C |
Collect in EDTA, heparin, or citrate tubes. Avoid hemolysis. |
| Tissues (e.g., liver, brain, tumor) |
50 mg per sample |
Snap-frozen immediately at –80°C |
Cut and freeze tissue as quickly as possible after dissection. |
| Cells |
1 × 10⁶ to 1 × 10⁷ cells |
Frozen at –80°C |
Collect cells in culture medium and freeze immediately after collection. |
| Urine / CSF / Biofluids |
1 mL per sample |
Frozen at –80°C |
Collect in sterile containers and freeze without delay. |
| Feces / Stool |
1 g per sample |
Frozen at –80°C |
Freeze immediately after collection to preserve metabolites. |
| Saliva |
1 mL per sample |
Frozen at –80°C |
Collect in a sterile container. Keep on ice and freeze immediately. |
| Other Matrices (e.g., hair) |
Contact us for specific requirements |
Follow specific instructions |
Contact Creative Proteomics for guidance on special matrices. |
Additional Guidelines:
- Sample Shipping: All samples should be shipped on dry ice to maintain stability. Include a completed sample submission form with your shipment.
- Avoid Freeze/Thaw Cycles: To ensure accurate results, do not freeze and thaw samples repeatedly. This can degrade SAM and other metabolites.
- Sample Quality: Ensure that samples are properly labeled with the sample ID and collection date. Poorly labeled or degraded samples may result in inaccurate or delayed results.
- Custom Sample Requirements: For any sample types not listed above or specific requests, please contact us.
Deliverables: What You Receive from Our SAM/SAH Quantification Service
Quantitative Results: Concentrations of SAM, SAH, and SAM/SAH ratio for each sample.
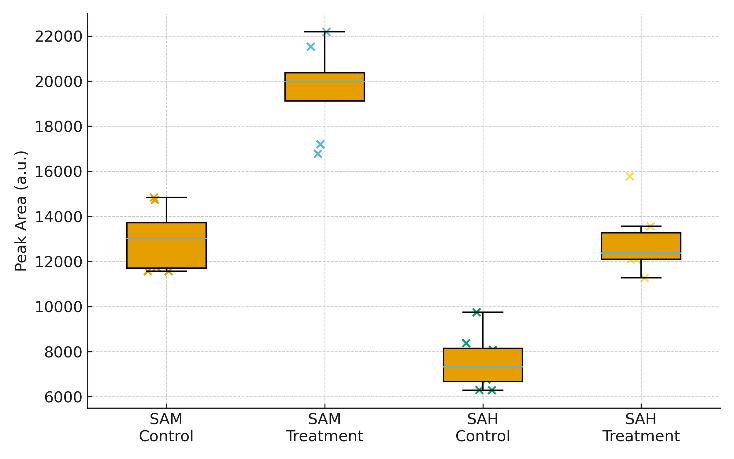
Statistical Analysis: Basic group comparisons and visualizations (e.g., boxplots, PCA) if applicable.
QC Report: Calibration curves, internal standard performance, and batch quality control data.
Data Files: Raw and processed data (e.g., peak areas, normalized intensities), provided in compatible formats (Excel, CSV).
Expert Interpretation: A summary of key findings with insights into methylation potential and one-carbon metabolism, upon request.
Applications of SAM Targeted Metabolomics
Methyl donor supplementation reduces phospho‐Tau, Fyn and demethylated protein phosphatase 2A levels and mitigates learning and motor deficits in a mouse model of tauopathy
van Hummel, A., Taleski, G., Sontag, J. M., Feiten, A. F., Ke, Y. D., Ittner, L. M., & Sontag, E.
Journal: Neuropathology and Applied Neurobiology
Year: 2023
Glycine supplementation can partially restore oxidative stress-associated glutathione deficiency in ageing cats
Ruparell, A., Alexander, J. E., Eyre, R., Carvell-Miller, L., Leung, Y. B., Evans, S. J., ... & Watson, P.
Journal: British Journal of Nutrition
Year: 2024
Metabolomic Studies in Girls With Central and Peripheral Precocious Puberty
Özyurt, A. B., Reçber, T., Nemutlu, E., Buluş, D., Kır, S., Gümüşel, B. K., & Erkekoğlu, P.
Journal: Fabad Journal of Pharmaceutical Sciences
Year: 2023
Resting natural killer cell homeostasis relies on tryptophan/NAD+ metabolism and HIF‐1α
Pelletier, A., Nelius, E., Fan, Z., Khatchatourova, E., Alvarado‐Diaz, A., He, J., ... & Stockmann, C.
Journal: EMBO Reports
Year: 2023