What Is Riboflavin Analysis?
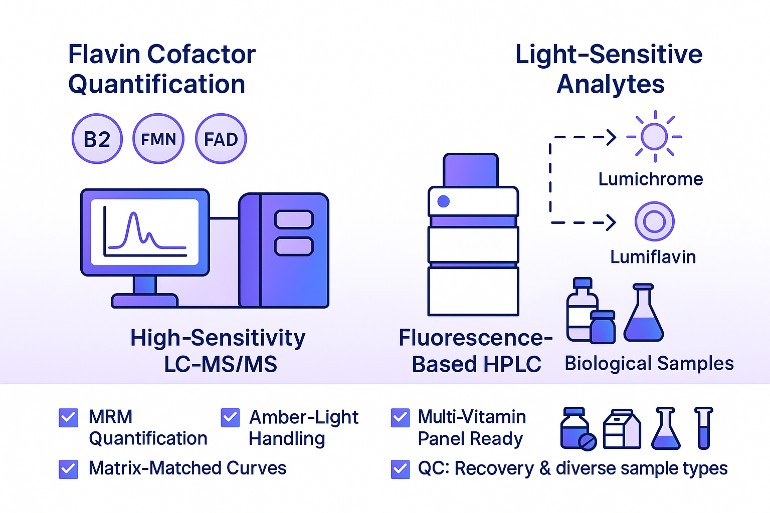
Riboflavin, also known as vitamin B2, is an essential water-soluble vitamin that functions as a precursor to two key cofactors—flavin mononucleotide (FMN) and flavin adenine dinucleotide (FAD). These cofactors participate in redox reactions that support energy metabolism, cellular respiration, and antioxidant defense. Because riboflavin is both fluorescent and photo-sensitive, it serves as an ideal marker for assessing nutrient stability in foods, biological samples, and fermentation products. Riboflavin analysis helps researchers quantify its concentration and evaluate conversion among its active forms, providing critical insights into nutritional quality and metabolic status.
Common Questions—and Why Testing Matters
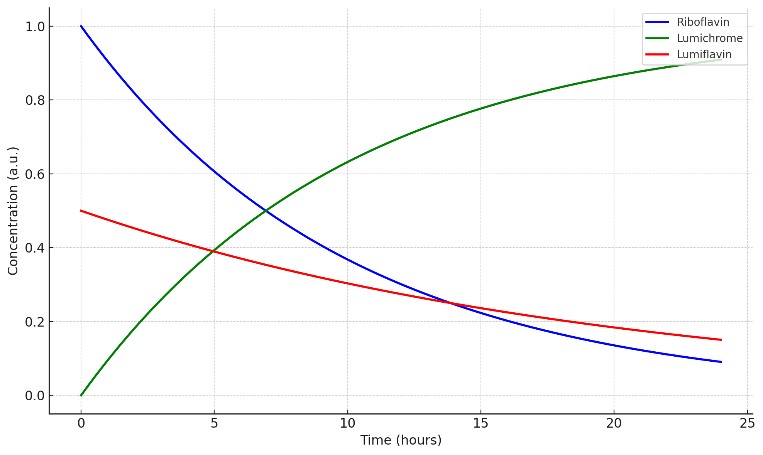
How stable is riboflavin during processing? Light converts riboflavin to lumichrome and lumiflavin; monitoring both prevents under- or over-estimation.
Do I need FMN and FAD as well? Many applications track the full flavin pool; FMN/FAD often respond to processing and metabolism differently than free riboflavin.
Which method should I pick? HPLC with fluorescence is highly sensitive and cost-effective; LC-MS/MS adds selectivity for complex matrices and multi-vitamin panels.
Riboflavin Analysis Services: Targeted Testing for Riboflavin, FMN, and FAD
Service scope aligned to real use cases—food, dairy, supplements, bioprocess, and biological matrices.
Targeted LC–MS/MS quantification (riboflavin, FMN, FAD): Isotope-assisted calibration, matrix-matched curves, and MRM confirmation for precise, comparable results.
HPLC-FLD riboflavin testing: Fluorescence detection with analyte-specific wavelengths for routine assays in standard food and dairy matrices.
Photodegradation profiling (lumichrome, lumiflavin): Assess light sensitivity and packaging performance by tracking key riboflavin photoproducts.
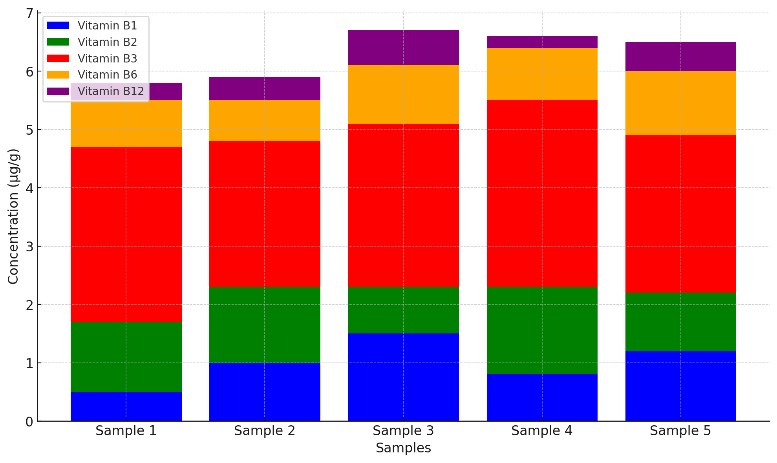
B-vitamin multi-analyte panel (optional): Combine riboflavin with thiamine, niacin, pyridoxine, folate, pantothenate, and biotin for formulation and labeling needs.
Bioprocess monitoring for fermentation: Track riboflavin secretion or consumption and follow FMN/FAD dynamics to optimize media composition and harvest points.
Analyte Coverage for Riboflavin Analysis
| Analyte |
Category |
Notes |
| Riboflavin (Vitamin B2) |
Primary riboflavin vitamer |
Fluorescent, photo-sensitive; baseline target in riboflavin panels. |
| Flavin Mononucleotide (Riboflavin-5'-phosphate, FMN) |
Riboflavin coenzyme/vitamer |
Phosphorylated flavin; benefits from biocompatible LC hardware. |
| Flavin Adenine Dinucleotide (FAD) |
Riboflavin coenzyme/vitamer |
Dimeric flavin cofactor; gentle extraction maintains integrity. |
| Lumichrome |
Riboflavin photodegradation product |
Marker of light-induced B2 loss. |
| Lumiflavin |
Riboflavin photodegradation product |
Secondary light-derived product; complements lumichrome tracking. |
| Thiamine (Vitamin B1) |
Optional B-group vitamer |
Common in multi-vitamin panels. |
| Thiamine Monophosphate (TMP) |
Optional B1 phosphorylated vitamer |
Included when B1 speciation is required. |
| Thiamine Pyrophosphate (TPP) |
Optional B1 coenzyme form |
Active coenzyme; optional in extended panels. |
| Niacin (Nicotinic Acid) |
Optional B3 vitamer |
Pair with nicotinamide for full B3 coverage. |
| Nicotinamide |
Optional B3 vitamer |
Amide form of B3; frequent in fortified products. |
| Pantothenic Acid (Vitamin B5) |
Optional B-group vitamer |
Often included for label verification. |
| Pyridoxine |
Optional B6 vitamer |
Select B6 forms per project scope. |
| Pyridoxal |
Optional B6 vitamer |
— |
| Pyridoxal-5'-phosphate (PLP) |
Optional B6 coenzyme form |
Add when coenzyme-level insight is needed. |
| Biotin (Vitamin B7) |
Optional B-group vitamer |
Low endogenous levels; MRM improves selectivity. |
| Folic Acid |
Optional B9 vitamer (oxidized form) |
Baseline B9 in fortified products. |
| 5-Methyltetrahydrofolate (5-MTHF) |
Optional B9 reduced folate |
Include reduced folates only if required. |
| Tetrahydrofolate (THF) |
Optional B9 reduced folate |
Specialized requests for folate speciation. |
Why Choose Our Riboflavin Analysis Service?
LOD/LOQ in the pg/mL–ng/mL range (LC–MS/MS) and <10 ng/mL (HPLC-FLD), supporting low-abundance monitoring.
- Matrix-adapted selectivity.
Analyte-specific MRM and fluorescence filters reduce signal suppression in complex samples.
Internal standards and matrix-matched curves ensure 80–120% recovery with CVs typically ≤15% intra-batch.
- Photo-degradation tracking.
Lumichrome/lumiflavin analysis reveals light-induced loss beyond total B2 values.
- Vitamer-level resolution.
Separate values for riboflavin, FMN, and FAD support clearer formulation and process insights.
Instrumentation and Methods for Riboflavin Analysis
To support accurate vitamin B2 quantification and flavin profiling across diverse matrices, we apply two validated platforms based on sample complexity and reporting needs:
HPLC with Fluorescence Detection (HPLC-FLD)
Typical use case: Fortified foods, dairy, supplements, and clear liquid samples
Detection mode: Excitation at ~450 nm, emission at 520–530 nm (riboflavin-specific)
Column type: C18 reversed-phase
Benefits: High sensitivity, cost-effective, ideal for routine testing of riboflavin and FMN
Example platform: Agilent 1260 Infinity II Bio LC with FLD detector for biocompatible flow paths
Quality Controls Built-In
- System suitability check before each run
- Blank, spike recovery, and internal standard tracking
LC–MS/MS (MRM Mode)
Typical use case: Complex matrices (e.g., fermentation broth, multivitamin blends), coenzyme-level profiling
Ionization: Positive ESI (Electrospray Ionization)
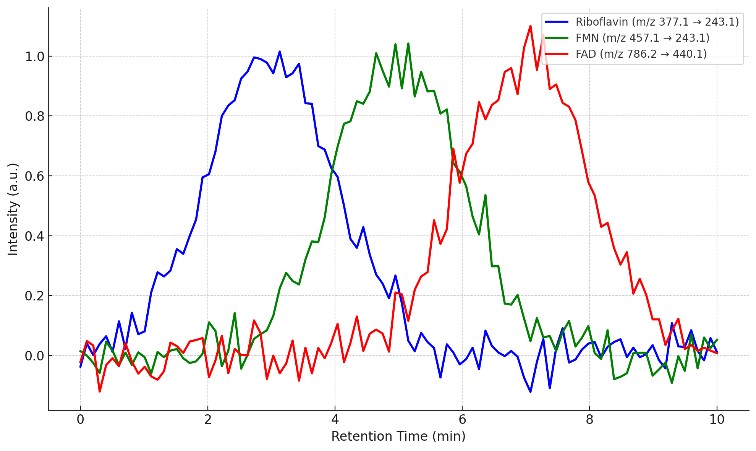
Sample transitions (examples):
- Riboflavin: m/z 377.1 → 243.1
- FMN: m/z 457.1 → 243.1
- FAD: m/z 786.2 → 440.1
Column type: UPLC C18, short gradients (3–10 min depending on panel)
Quantification strategy: Stable isotope–labeled internal standards + matrix-matched calibration
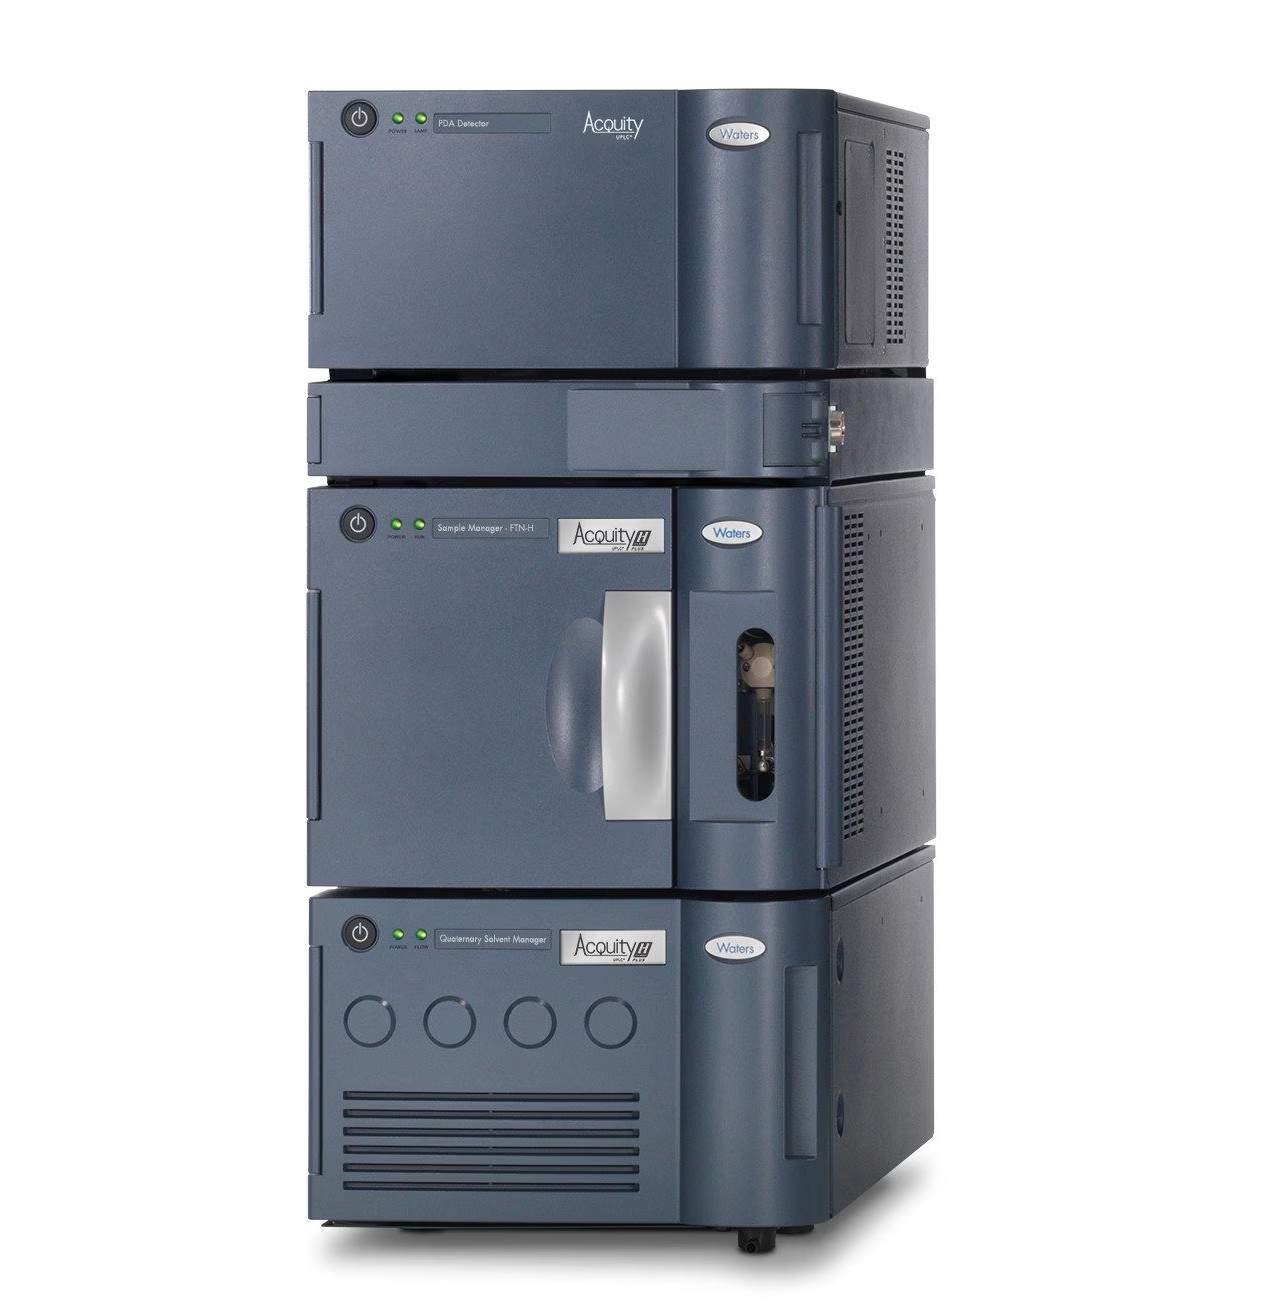
Example platform: Waters ACQUITY UPLC–Xevo TQ-S
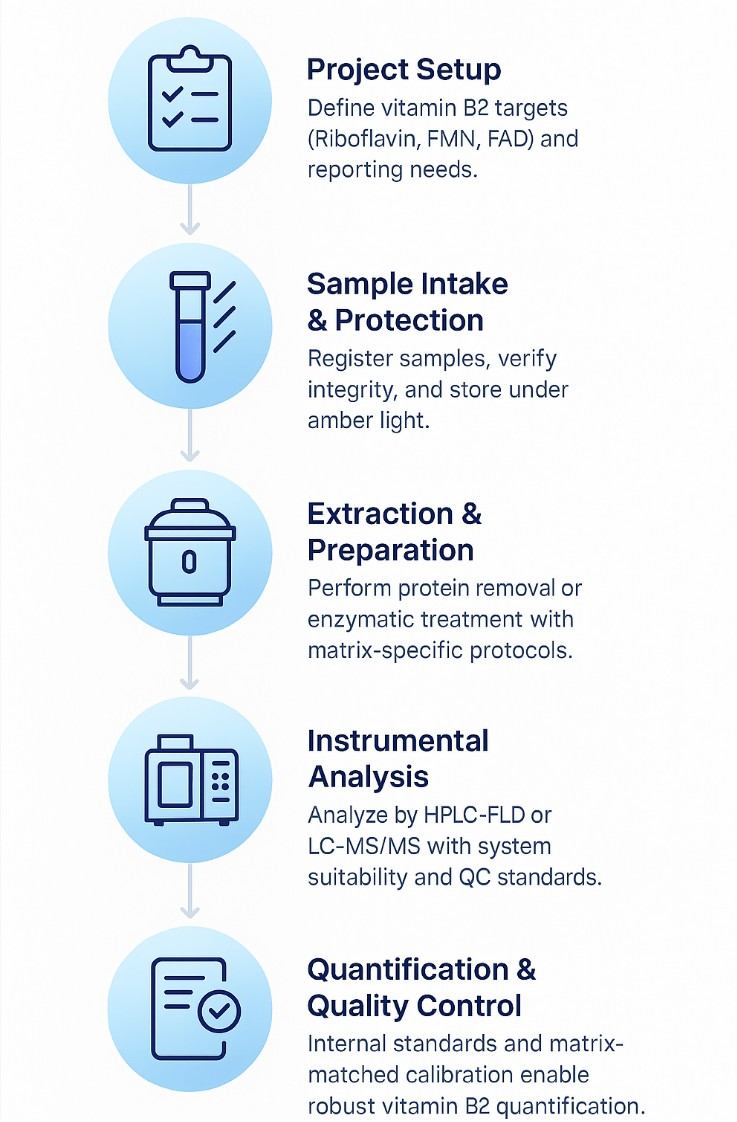
Riboflavin Analysis Workflow | How We Quantify Vitamin B2 and Flavin Cofactors
How to Prepare and Submit Samples for Riboflavin Analysis
| Sample Type |
Minimum Amount |
Container & Light Protection |
Preparation Notes |
| Urine / Plasma / Serum (for B2 or FMN/FAD) |
≥ 0.5 mL |
Amber microvial on ice |
Clearly label sample type and anticoagulant, if used. |
| Liquid Food / Beverage |
≥ 50 mL |
Amber glass or foil-wrapped |
Record pH, preservatives, or clarifiers if added. |
| Milk / Formula / Dairy Products |
≥ 100 g or mL |
Opaque or amber container, chilled |
Indicate fat content; homogenize before sending. |
| Dietary Supplement (Powder / Capsule) |
≥ 20 g |
Foil pouch or amber vial |
Provide ingredient list or label claim if available. |
| Premix or Fortified Powder |
≥ 20 g |
Light-protected sealed bag |
Note carrier composition and target vitamin concentration. |
| Fermentation Broth / Supernatant |
≥ 50 mL |
Amber bottle, chilled |
Document medium composition and harvest timepoint. |
Deliverables: What You Receive from Riboflavin Analysis
- Concentration Report: Precise concentrations of riboflavin, FMN, and FAD in your samples.
- Photodegradation Data: Light stability results including lumichrome and lumiflavin profiles.
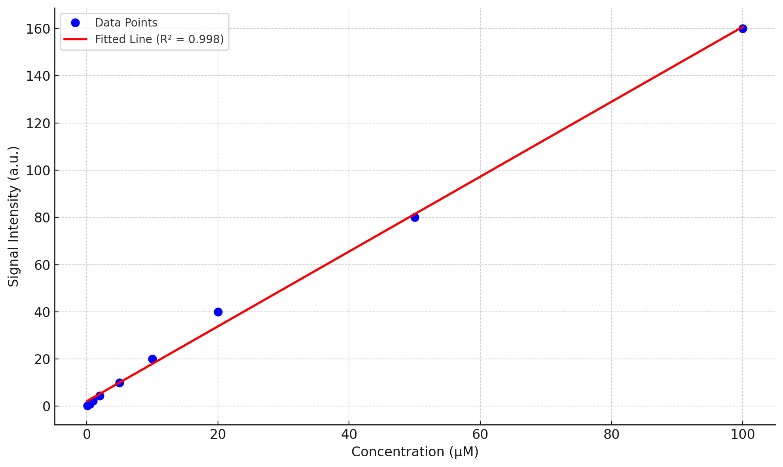
- Standard Curve: Calibration data with concentration vs. signal intensity and R2 value.
- Quality Control Summary: Recovery rates, internal standards, and data validation checks.
- Methodology: Detailed analysis methods, calibration techniques, and detection limits.
- Data Interpretation: Expert analysis of riboflavin levels and their relevance to your product.
- Multi-Vitamin Panel Results: Optional B-vitamin concentrations (B1, B3, B6) in the same sample.
- Process Optimization Recommendations: Tailored suggestions for improving stability or yield.
- Raw Data Files: Access to chromatograms and mass spectra for full transparency.
Applications of Riboflavin Analysis
MS-CETSA functional proteomics uncovers new DNA-repair programs leading to Gemcitabine resistance
Nordlund, P., Liang, Y. Y., Khalid, K., Van Le, H., Teo, H. M., Raitelaitis, M., ... & Prabhu, N.
Journal: Research Square
Year: 2024
DOI: https://doi.org/10.21203/rs.3.rs-4820265/v1
High Levels of Oxidative Stress Early after HSCT Are Associated with Later Adverse Outcomes
Cook, E., Langenberg, L., Luebbering, N., Ibrahimova, A., Sabulski, A., Lake, K. E., ... & Davies, S. M.
Journal:Transplantation and Cellular Therapy
Year: 2024
DOI: https://doi.org/10.1016/j.jtct.2023.12.096
Multiomics of a rice population identifies genes and genomic regions that bestow low glycemic index and high protein content
Badoni, S., Pasion-Uy, E. A., Kor, S., Kim, S. R., Tiozon Jr, R. N., Misra, G., ... & Sreenivasulu, N.
Journal: Proceedings of the National Academy of Sciences
Year: 2024
DOI: https://doi.org/10.1073/pnas.2410598121
The Brain Metabolome Is Modified by Obesity in a Sex-Dependent Manner
Norman, J. E., Milenkovic, D., Nuthikattu, S., & Villablanca, A. C.
Journal: International Journal of Molecular Sciences
Year: 2024
DOI: https://doi.org/10.3390/ijms25063475
UDP-Glucose/P2Y14 Receptor Signaling Exacerbates Neuronal Apoptosis After Subarachnoid Hemorrhage in Rats
Kanamaru, H., Zhu, S., Dong, S., Takemoto, Y., Huang, L., Sherchan, P., ... & Zhang, J. H.
Journal: Stroke
Year: 2024
DOI: https://doi.org/10.1161/STROKEAHA.123.044422
Pan-lysyl oxidase inhibition disrupts fibroinflammatory tumor stroma, rendering cholangiocarcinoma susceptible to chemotherapy
Burchard, P. R., Ruffolo, L. I., Ullman, N. A., Dale, B. S., Dave, Y. A., Hilty, B. K., ... & Hernandez-Alejandro, R.
Journal: Hepatology Communications
Year: 2024
DOI: https://doi.org/10.1097/HC9.0000000000000502
Comparative metabolite profiling of salt sensitive Oryza sativa and the halophytic wild rice Oryza coarctata under salt stress
Tamanna, N., Mojumder, A., Azim, T., Iqbal, M. I., Alam, M. N. U., Rahman, A., & Seraj, Z. I.
Journal: Plant‐Environment Interactions
Year: 2024
DOI: https://doi.org/10.1002/pei3.10155
Teriflunomide/leflunomide synergize with chemotherapeutics by decreasing mitochondrial fragmentation via DRP1 in SCLC
Mirzapoiazova, T., Tseng, L., Mambetsariev, B., Li, H., Lou, C. H., Pozhitkov, A., ... & Salgia, R.
Journal: iScience
Year: 2024
DOI: https://doi.org/10.1016/j.isci.2024.110132
Physiological, transcriptomic and metabolomic insights of three extremophyte woody species living in the multi-stress environment of the Atacama Desert
Gajardo, H. A., Morales, M., Larama, G., Luengo-Escobar, A., López, D., Machado, M., ... & Bravo, L. A.
Journal: Planta
Year: 2024
DOI: https://doi.org/10.1007/s00425-024-04484-1
A personalized probabilistic approach to ovarian cancer diagnostics
Ban, D., Housley, S. N., Matyunina, L. V., McDonald, L. D., Bae-Jump, V. L., Benigno, B. B., ... & McDonald, J. F.
Journal: Gynecologic Oncology
Year: 2024
DOI: https://doi.org/10.1016/j.ygyno.2023.12.030
Glucocorticoid-induced osteoporosis is prevented by dietary prune in female mice
Chargo, N. J., Neugebauer, K., Guzior, D. V., Quinn, R. A., Parameswaran, N., & McCabe, L. R.
Journal: Frontiers in Cell and Developmental Biology
Year: 2024
DOI: https://doi.org/10.3389/fcell.2023.1324649
Proteolytic activation of fatty acid synthase signals pan-stress resolution
Wei, H., Weaver, Y. M., Yang, C., Zhang, Y., Hu, G., Karner, C. M., ... & Weaver, B. P.
Journal: Nature Metabolism
Year: 2024
DOI: https://doi.org/10.1038/s42255-023-00939-z
Quantifying forms and functions of intestinal bile acid pools in mice
Sudo, K., Delmas-Eliason, A., Soucy, S., Barrack, K. E., Liu, J., Balasubramanian, A., … & Sundrud, M. S.
Journal: bioRxiv
Year: 2024
DOI: https://doi.org/10.1101/2024.02.16.580658
Elevated SLC7A2 expression is associated with an abnormal neuroinflammatory response and nitrosative stress in Huntington's disease
Gaudet, I. D., Xu, H., Gordon, E., Cannestro, G. A., Lu, M. L., & Wei, J.
Journal: Journal of Neuroinflammation
Year: 2024
DOI: https://doi.org/10.1186/s12974-024-03038-2
Thermotolerance capabilities, blood metabolomics, and mammary gland hemodynamics and transcriptomic profiles of slick-haired Holstein cattle during mid lactation in Puerto Rico
Contreras-Correa, Z. E., Sánchez-Rodríguez, H. L., Arick II, M. A., Muñiz-Colón, G., & Lemley, C. O.
Journal: Journal of Dairy Science
Year: 2024
DOI: https://doi.org/10.3168/jds.2023-23878
Glycine supplementation can partially restore oxidative stress-associated glutathione deficiency in ageing cats
Ruparell, A., Alexander, J. E., Eyre, R., Carvell-Miller, L., Leung, Y. B., Evans, S. J., ... & Watson, P.
Journal: British Journal of Nutrition
Year: 2024
DOI: https://doi.org/10.1017/S0007114524000370
Untargeted metabolomics reveal sex-specific and non-specific redox-modulating metabolites in kidneys following binge drinking
Rafferty, D., de Carvalho, L. M., Sutter, M., Heneghan, K., Nelson, V., Leitner, M., ... & Puthanveetil, P.
Journal: Redox Experimental Medicine
Year: 2023
DOI: https://doi.org/10.1530/REM-23-0005
Sex modifies the impact of type 2 diabetes mellitus on the murine whole brain metabolome
Norman, J. E., Nuthikattu, S., Milenkovic, D., & Villablanca, A. C.
Journal: Metabolites
Year: 2023
DOI: https://doi.org/10.3390/metabo13091012
A human iPSC-derived hepatocyte screen identifies compounds that inhibit production of Apolipoprotein B
Liu, J. T., Doueiry, C., Jiang, Y. L., Blaszkiewicz, J., Lamprecht, M. P., Heslop, J. A., ... & Duncan, S. A.
Journal: Communications Biology
Year: 2023
DOI: https://doi.org/10.1038/s42003-023-04739-9
Methyl donor supplementation reduces phospho‐Tau, Fyn and demethylated protein phosphatase 2A levels and mitigates learning and motor deficits in a mouse model of tauopathy
van Hummel, A., Taleski, G., Sontag, J. M., Feiten, A. F., Ke, Y. D., Ittner, L. M., & Sontag, E.
Journal: Neuropathology and Applied Neurobiology
Year: 2023
DOI: https://doi.org/10.1111/nan.12931
Sex hormones, sex chromosomes, and microbiota: identification of Akkermansia muciniphila as an estrogen-responsive bacterium
Sakamuri, A., Bardhan, P., Tummala, R., Mauvais-Jarvis, F., Yang, T., Joe, B., & Ogola, B. O.
Journal: Microbiota and Host
Year: 2023
DOI: https://doi.org/10.1530/MAH-23-0010
Living in extreme environments: a photosynthetic and desiccation stress tolerance trade-off story, but not for everyone
Gajardo, H. A., Morales, M., López, D., Luengo-Escobar, M., Machado, A., Nunes-Nesi, A., ... & Bravo, L.
Journal: Authorea Preprints
Year: 2023
DOI: https://doi.org/10.22541/au.168311184.42382633/v2
Resting natural killer cell homeostasis relies on tryptophan/NAD+ metabolism and HIF‐1α
Pelletier, A., Nelius, E., Fan, Z., Khatchatourova, E., Alvarado‐Diaz, A., He, J., ... & Stockmann, C.
Journal: EMBO Reports
Year: 2023
DOI: https://doi.org/10.15252/embr.202256156
Function and regulation of a steroidogenic CYP450 enzyme in the mitochondrion of Toxoplasma gondii
Asady, B., Sampels, V., Romano, J. D., Levitskaya, J., Lige, B., Khare, P., ... & Coppens, I.
Journal: PLoS Pathogens
Year: 2023
DOI: https://doi.org/10.1371/journal.ppat.1011566