Choline Metabolite Profiling — Why Measuring Choline Alone Misses the Full Metabolic
Picture
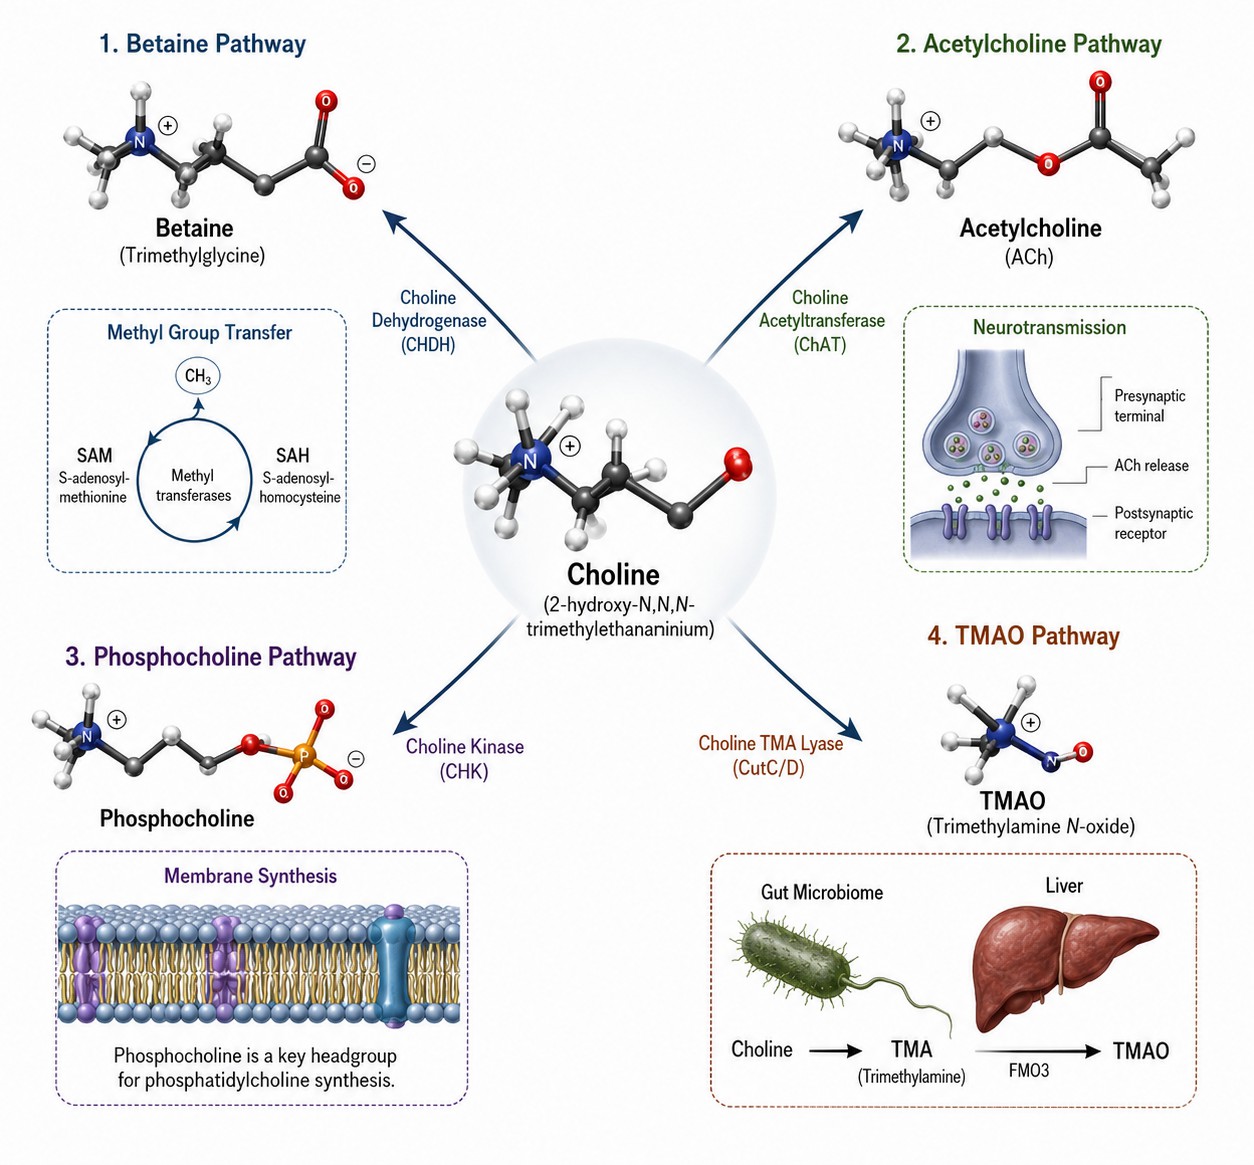
Choline sits at a metabolic crossroads. Once inside a cell, four enzymes compete for it — and which one
wins determines whether that choline becomes a methyl donor, a neurotransmitter, a membrane lipid, or a
cardiovascular risk factor. A plasma choline concentration of 10 μM can mean entirely different things
depending on the downstream branch that is active.
Our panel quantifies the key metabolites at each branch point, converting a single choline measurement into
a functional map of choline utilization:
| Branch |
What We Measure |
Functional Index |
What It Tells You |
| Methylation Metabolism |
Choline, Betaine, DMG, Methionine, Homocysteine, SAM, SAH |
Betaine / Choline; SAM / SAH |
Characterizes metabolic relationships among methyl donors, methionine-cycle intermediates, and
one-carbon metabolism. |
| Cholinergic Metabolism |
Acetylcholine, Choline |
ACh / Choline |
Supports research into choline utilization and acetylcholine-associated metabolic pathways.
|
| Membrane Lipid Metabolism
|
Phosphocholine, GPC, and related choline-pathway intermediates
|
PCho / Choline; GPC / PCho |
Supports research into choline utilization, phospholipid biosynthesis, and membrane lipid
turnover.
|
| Microbial Choline Metabolism
|
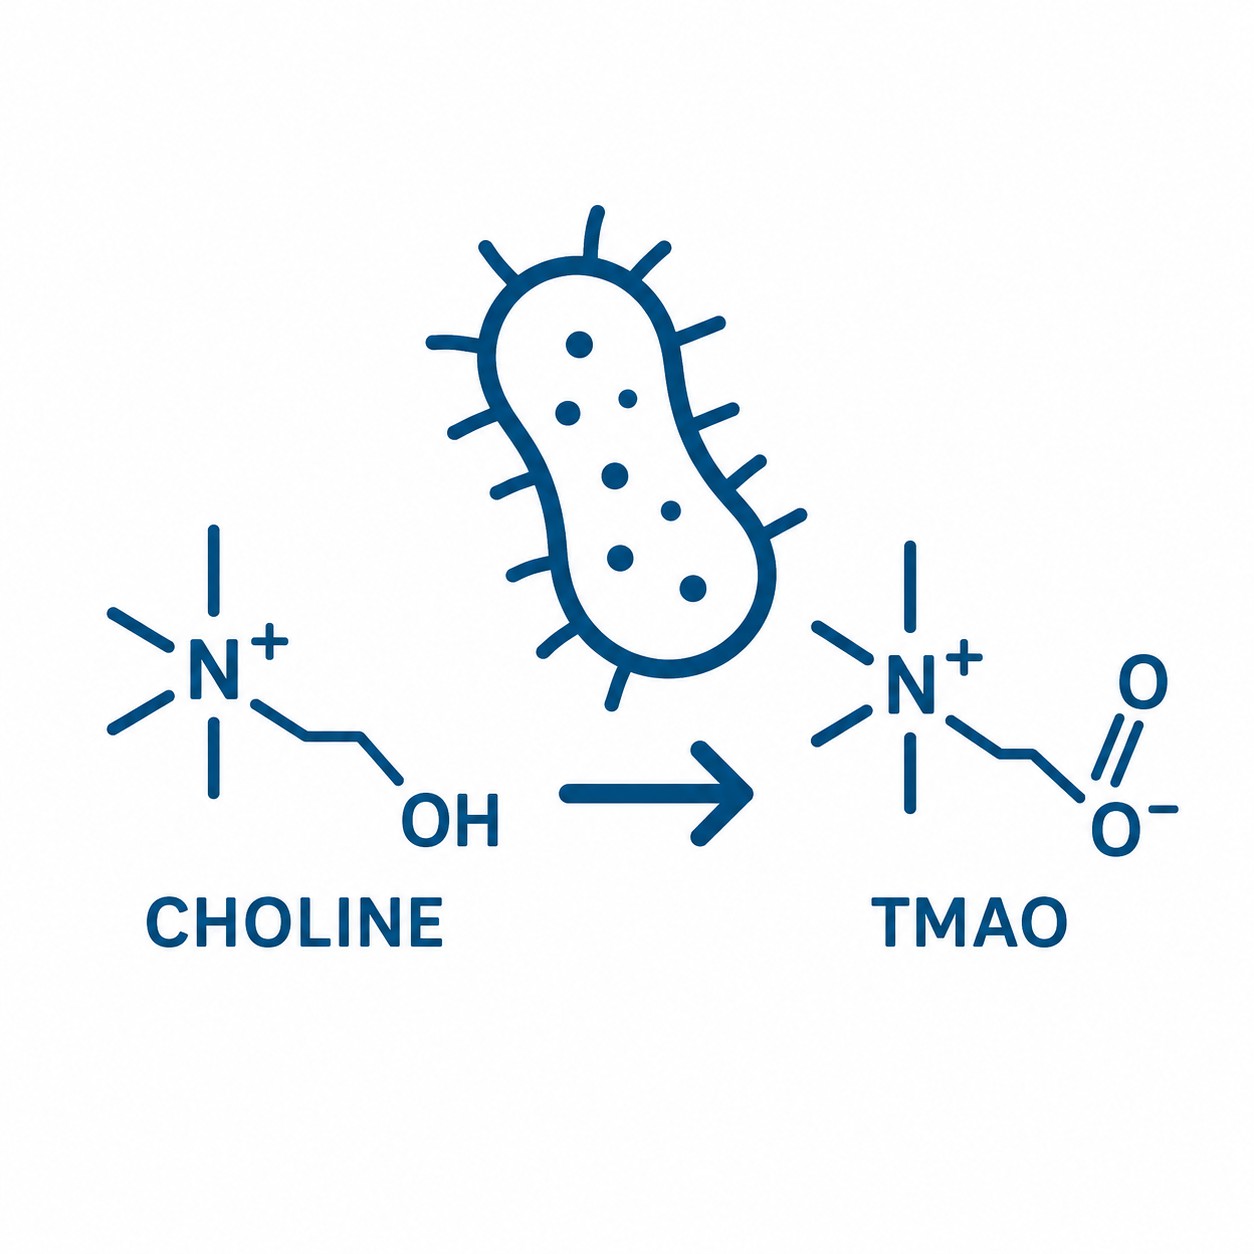
Choline, TMA, TMAO, Carnitine, γ-Butyrobetaine |
TMAO / Choline; TMAO / TMA |
Characterizes metabolic relationships among choline, carnitine, and microbial-associated
trimethylamine pathways. |
The panel can be deployed as full 4-branch coverage or focused on specific branches. Lipid-level Kennedy pathway profiling (PC and PE species) is available as an integrated add-on from the same sample.
What Problem Do We Solve?
Most labs measure choline with a commercial kit and stop there. But three specific analytical challenges
make single-analyte choline data unreliable — and our assay was designed to solve each of them:
- Choline adsorbs to glass and degrades post-collection. Free choline concentrations in
stored samples are artifactually elevated by phospholipid degradation and post-mortem release — by up to
2- to 3-fold within hours. Our collection protocol specifies polypropylene tubes, cold processing, and —
for acetylcholine — immediate acetylcholinesterase inhibition. We measure GPC as a built-in quality
marker: elevated GPC alongside high choline indicates phospholipid degradation during storage.
- A single choline concentration has no biological interpretation without branch context.
A fasting choline of 8 μM could indicate low dietary intake, accelerated betaine oxidation (methyl donor
stress), or microbial choline consumption (high TMAO). Our panel distinguishes these scenarios by
measuring all four branch outputs simultaneously — no inference required.
- ELISA and colorimetric kits cannot distinguish choline from its metabolites. Many
commercial "choline assay kits" cross-react with betaine, phosphocholine, and other choline esters,
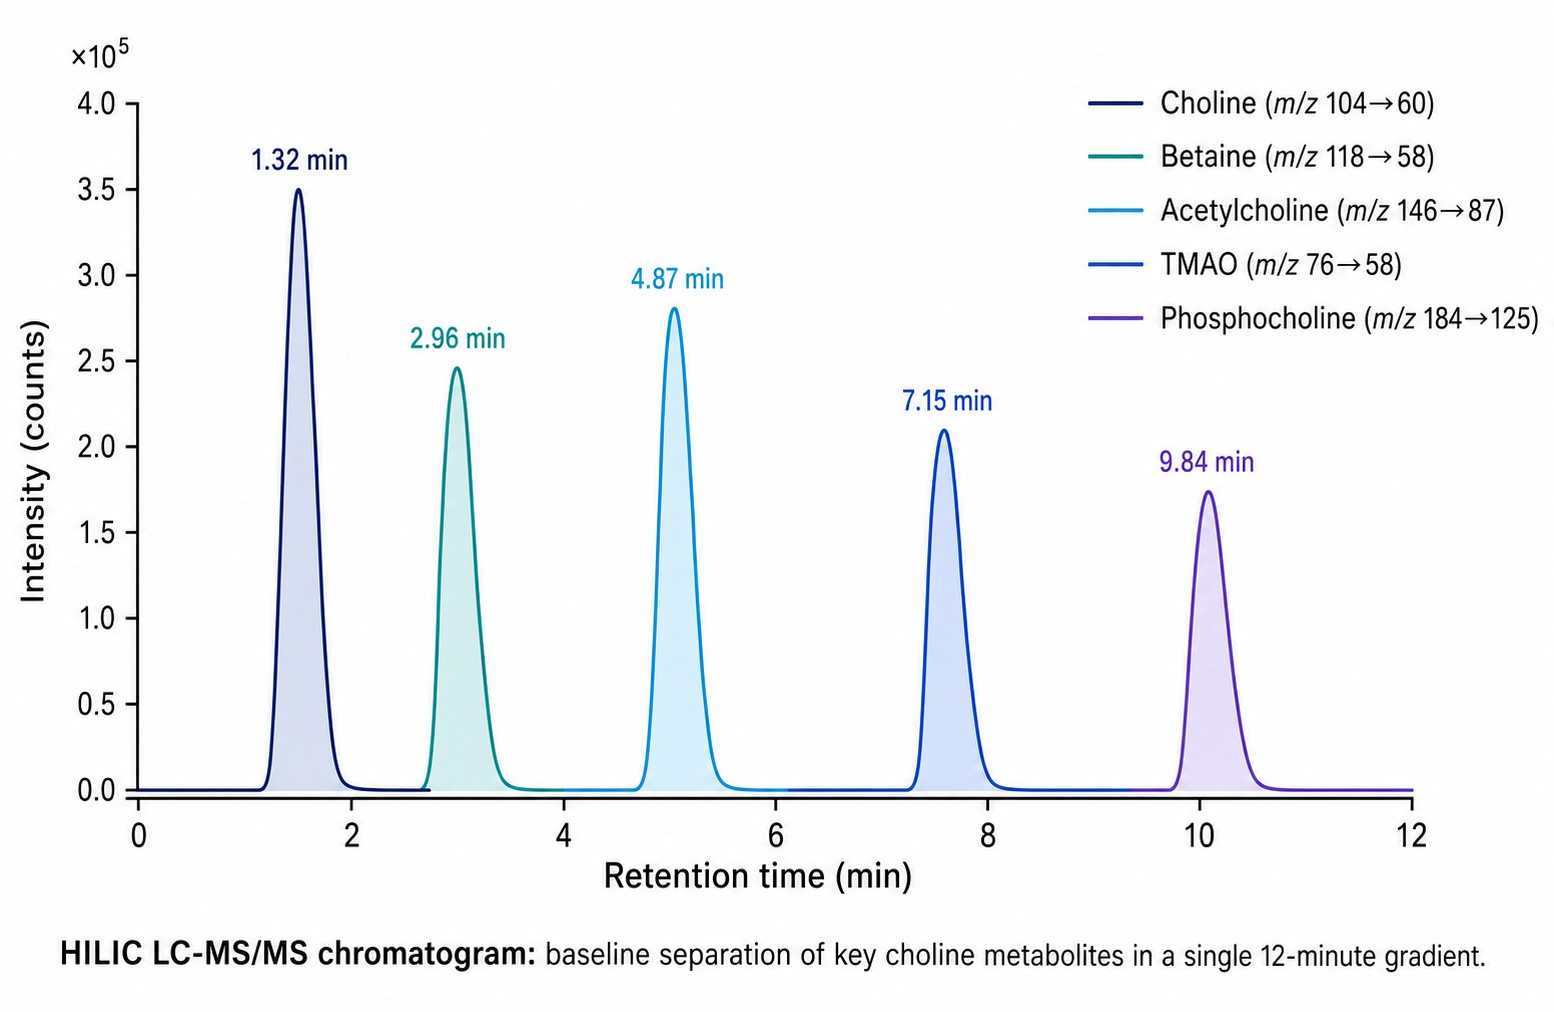
producing systematically inflated concentrations. HILIC LC-MS/MS with per-analyte MRM transitions
eliminates cross-reactivity — each analyte is identified and quantified independently.
Why HILIC LC-MS/MS Over ELISA Kits and Untargeted Metabolomics for Choline Analysis
| Dimension |
HILIC LC-MS/MS (This Panel) |
Commercial ELISA / Colorimetric Kit |
Generic Untargeted Metabolomics |
| Analytes per run |
15+ choline metabolites, simultaneously quantified |
1 (choline only, with cross-reactivity) |
Variable; TMAO and acetylcholine are frequently missed due to poor retention |
| Specificity |
Per-analyte MRM transitions eliminate cross-reactivity; choline, betaine, and phosphocholine are
baseline-resolved |
Poor — cross-reacts with betaine, phosphocholine, and other choline esters |
Moderate — feature annotation is probabilistic, not definitive |
| Quantification |
Absolute (nM) with per-analyte isotope-labeled internal standards |
Relative to a kit calibrant, single-point |
Relative peak area; no absolute concentration |
| Pathway interpretation |
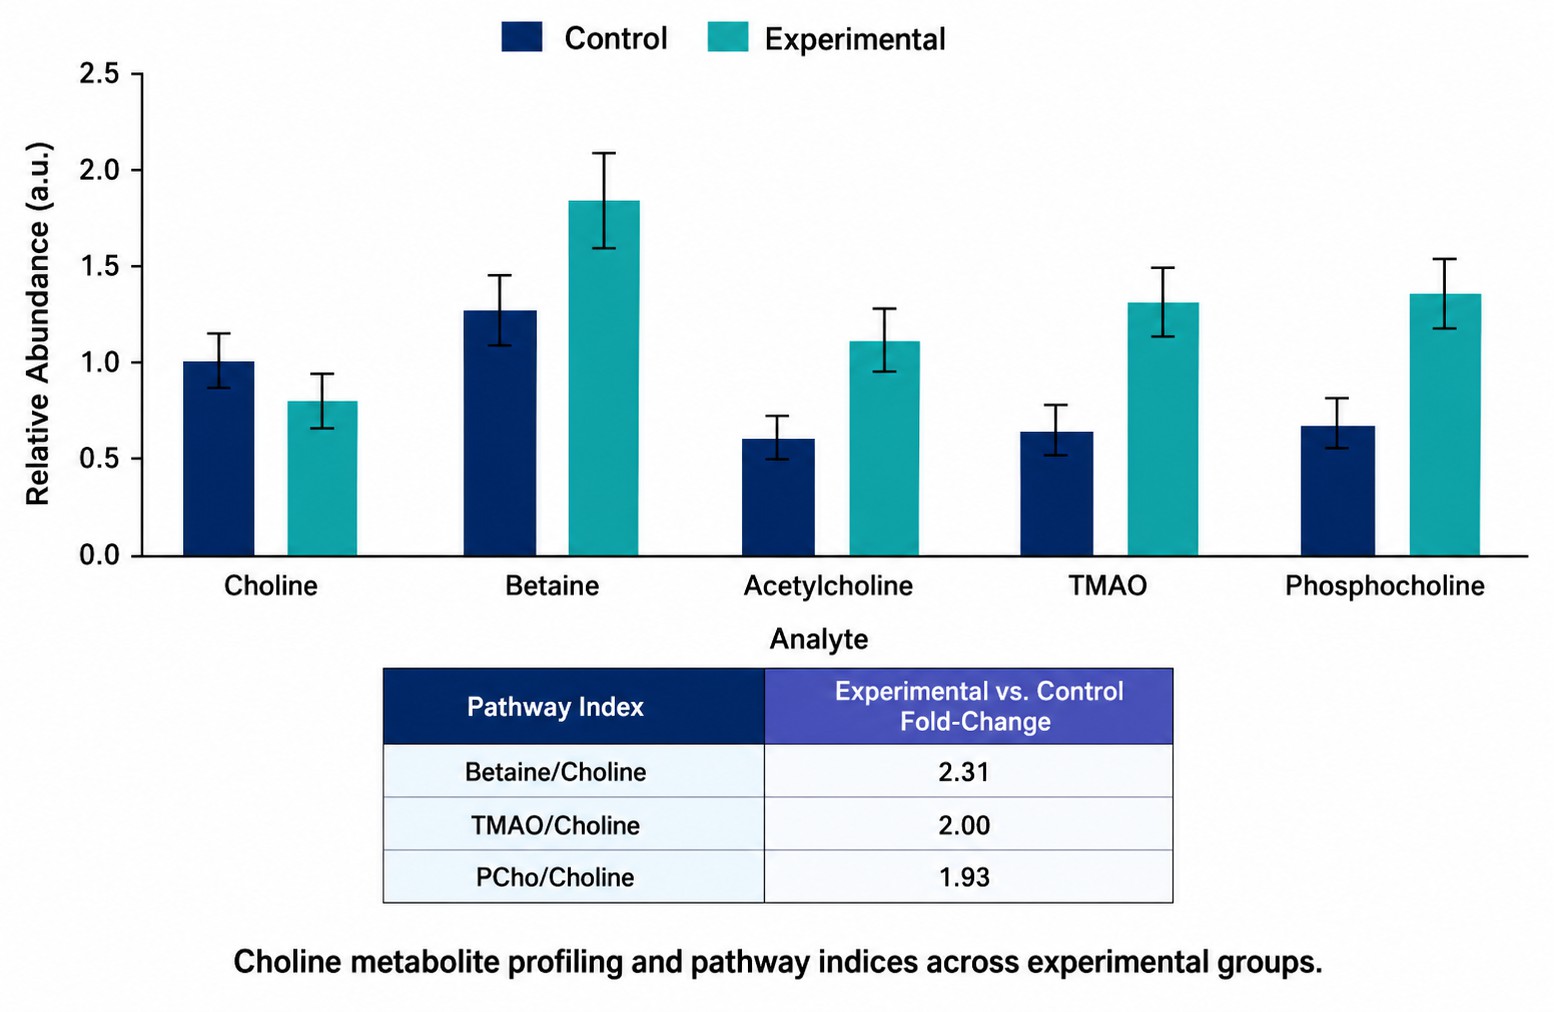
Pre-calculated branch indices (Betaine/Choline, TMAO/Choline, PCho/Choline, SAM/SAH) |
None — single-analyte data cannot resolve branch partitioning |
None — requires separate bioinformatics |
| Best for |
Studies requiring choline metabolic partitioning, TMAO risk assessment, or methyl donor status
|
Rough screening of total choline status when branch resolution is not needed |
Hypothesis generation; discovering novel choline-related features |
If your study endpoint is "is choline status adequate?", a kit may suffice. If your question is "which choline pathway is driving the phenotype?", targeted LC-MS/MS is the appropriate platform.
Why Choose Our Targeted Choline Metabolite Quantification?
- Four Pathways, One Injection — No Platform Gaps
HILIC chromatography retains the full polarity range — from zwitterionic betaine to quaternary ammonium TMAO — in a single 12-minute run. Most labs would need HILIC for polar intermediates plus C18 for lipid products. We consolidate all water-soluble choline derivatives onto one platform, with
lipid-level Kennedy pathway profiling
available as an add-on.
-
Pre-Calculated Pathway Indices for Immediate Interpretation
Every data package includes functional ratios: Betaine/Choline (methyl donor capacity), PCho/Choline (Kennedy pathway flux), TMAO/Choline (microbial choline consumption), TMAO/TMA (FMO3 activity), and SAM/SAH (methylation potential). These indices are pre-calculated per sample with group statistics — converting raw concentrations into biological interpretation without additional bioinformatics.
-
Per-Analyte Isotope Dilution — Not Surrogate Calibration
Choline-d9, betaine-d11, acetylcholine-d9, TMAO-d9, phosphocholine-d9, and GPC-d9 are spiked at extraction. Each analyte is calibrated against its own structurally matched internal standard and multi-point curve. Not a single IS for all compounds.
- Acetylcholine Stabilization Built into the Protocol
Acetylcholine has a plasma half-life under 2 minutes — most labs report artifactually low ACh because they don't stabilize it. Our protocol includes acetylcholinesterase inhibitors added at collection, and for brain tissue, we support microwave fixation as the reference method for in vivo ACh preservation.
Instrumentation — HILIC LC-MS/MS Platform and Method Performance for Choline Metabolite
Quantification
Analytical Platform
LC-MS/MS (HILIC Chromatography)
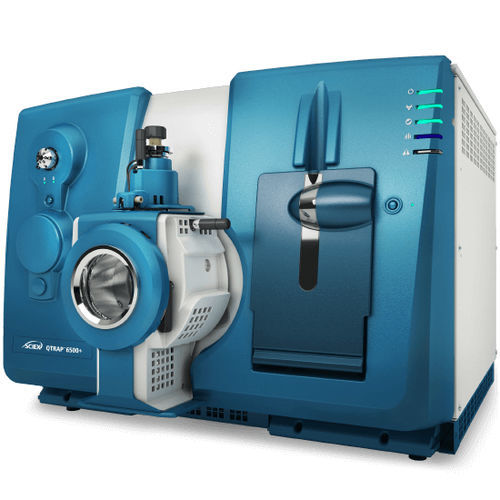
Mass Spectrometer: SCIEX QTRAP 6500+ or Agilent 6495C Triple Quadrupole
Ionization: ESI Positive Mode; scheduled MRM with 2 transitions per analyte
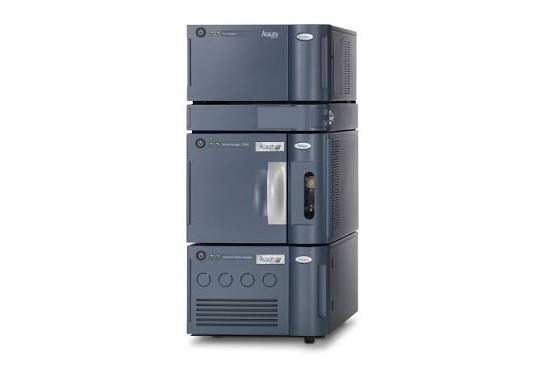
LC System: Waters ACQUITY UPLC with HILIC column (100 × 2.1 mm, 1.7 μm)
Gradient: 95% to 50% acetonitrile with 10 mM ammonium formate (pH 3.5), 12 min
Internal Standards: Choline-d9, Betaine-d11, Acetylcholine-d9, TMAO-d9, Phosphocholine-d9, GPC-d9
Method Performance
| Parameter |
Typical Range |
| Linearity (R²) |
≥ 0.995 across 3 orders of magnitude |
| LOD |
0.1–5 nM (analyte-dependent) |
| LOQ |
0.5–15 nM (analyte-dependent) |
| Intraday Precision |
CV ≤ 10% |
| Interday Precision |
CV ≤ 15% |
| Recovery |
85–115% (spiked matrices) |
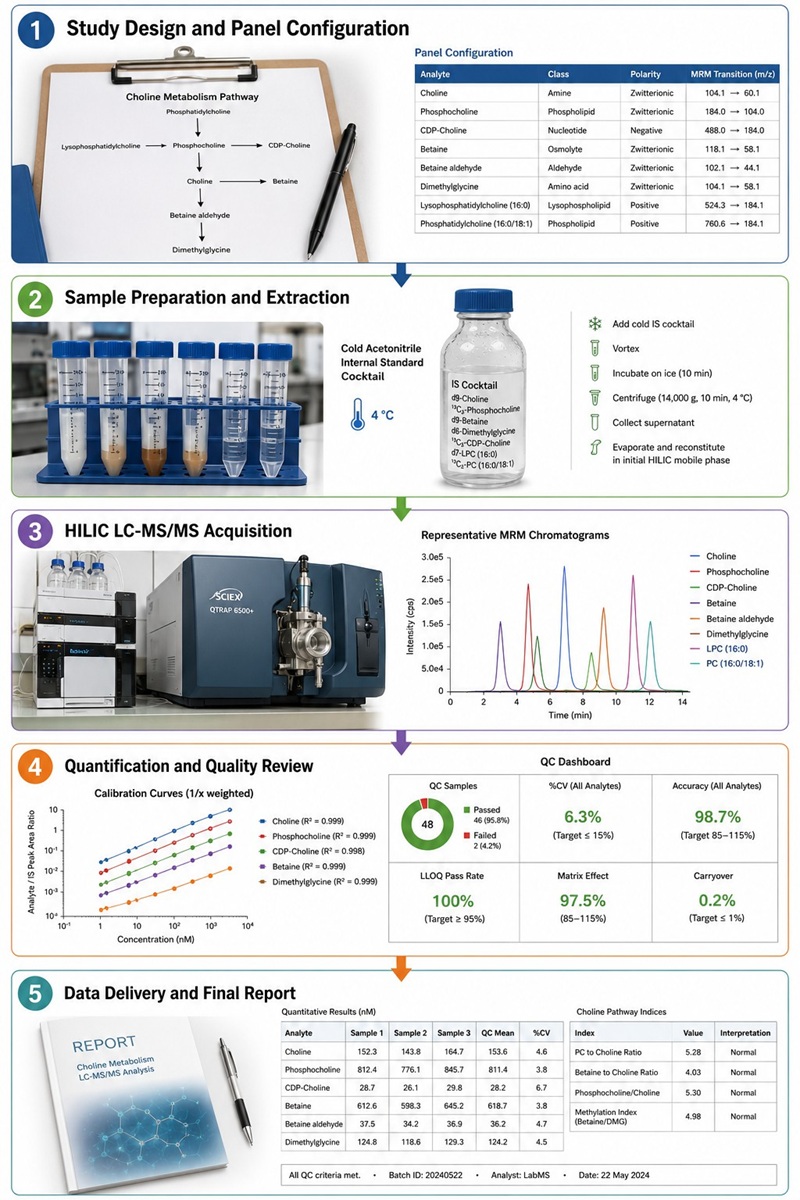
Choline Metabolite Analysis Workflow — From Sample to Pathway-Level Quantification
Sample Collection for Choline Metabolite Analysis — Plasma, CSF, Tissue, and Urine
| Sample Type |
Minimum Amount |
Preparation |
Storage and Shipping |
| Plasma (EDTA) |
≥ 100 μL |
Centrifuge at 4°C within 30 min. Add neostigmine (10 μM) if ACh is a target. Fasting (8+ h)
recommended. Use polypropylene tubes only. |
−80°C; ship on dry ice |
| CSF |
≥ 100 μL |
Collect into pre-chilled polypropylene tube with neostigmine. Centrifuge to remove cells. Never
use glass tubes. |
−80°C; ship on dry ice |
| Brain tissue |
≥ 30 mg |
Microwave fixation preferred for ACh. Otherwise, snap-freeze in liquid N₂ within 30 s of excision.
|
−80°C; ship on dry ice |
| Liver / Muscle tissue |
≥ 30 mg |
Snap-freeze in liquid N₂ immediately. Record wet weight. |
−80°C; ship on dry ice |
| Urine |
≥ 500 μL |
Mid-stream collection; centrifuge; aliquot. Dilution may be required for concentrated samples
(TMAO and betaine are concentrated in urine). |
−80°C; ship on dry ice |
Critical Notes:
- Acetylcholine is the most labile analyte in the panel. Half-life in untreated plasma is
under 2 minutes. Acetylcholinesterase inhibitor must be added at collection. Microwave fixation is the
reference method for brain tissue.
- Choline adsorbs to glass. Use polypropylene tubes for all collection and storage steps.
Silanized glass is an alternative if polypropylene is unavailable.
- Dietary choline confounds fasting levels. Plasma free choline rises 2- to 3-fold within
1–2 hours of a choline-rich meal. Fasting samples (8+ hours) are required for baseline choline status
assessment.
Deliverables — Quantitative Tables, Pathway Indices, and Analysis-Ready Data
Quantitative Data Tables (.xlsx)
Absolute concentrations (nM or nmol/g) with SD, LOD/LOQ, and QC flags per analyte.
Pathway Indices
Per-sample Betaine/Choline, PCho/Choline, TMAO/Choline, TMAO/TMA, SAM/SAH, and GPC/PCho with group statistics.
QA/QC Report
Calibration linearity, IS recovery, pooled QC RSD, batch trend plots, Westgard rule compliance.
Raw Data and Methods Appendix
Vendor-native and .mzML files. HILIC gradient, MRM transitions, extraction protocol — fully documented.
Applications of Choline Metabolite Profiling
Case Study: How TMAO Links Gut Microbial Choline Metabolism to Cardiovascular Disease
The Gut Microbial Metabolite Trimethylamine N-Oxide and Cardiovascular Diseases
Zhen, J., Zhou, Z., He, M., Han, H. X., Lv, E. H., Wen, P. B., Liu, X., Wang, Y. T., Cai, X.
C., Tian, J. Q., Zhang, M. Y., Xiao, L., and Kang, X. X. | Frontiers in Endocrinology, 2023, 14,
1085041
DOI: 10.3389/fendo.2023.1085041
Background
Trimethylamine N-oxide (TMAO) has emerged as one of the most studied gut microbial metabolites in
cardiovascular research. Produced from dietary choline and carnitine by gut bacteria — then oxidized in the
liver by FMO3 — TMAO promotes atherosclerosis through three distinct mechanisms: inhibiting reverse
cholesterol transport, enhancing platelet aggregation, and activating inflammatory pathways. Understanding
and quantifying the full choline-to-TMAO metabolic axis has become essential for drug development programs
targeting this pathway.
Challenge: Comprehensively review the mechanisms by which TMAO contributes to
cardiovascular diseases and identify therapeutic strategies targeting the choline-TMA-TMAO axis.
Key Findings
| Metric |
Finding |
| TMAO mechanism #1 |
Inhibits reverse cholesterol transport by downregulating CYP7A1 and CYP27A1, promoting foam cell
formation |
| TMAO mechanism #2 |
Enhances platelet hyperreactivity via increased intracellular Ca²⁺ release, promoting thrombosis
|
| TMAO mechanism #3 |
Activates NF-κB inflammatory pathways, induces endothelial dysfunction, and increases oxidative
stress |
| Therapeutic strategies reviewed |
Dietary choline restriction, gut microbiota modulation (antibiotics, probiotics), FMO3 inhibition,
and TMA lyase inhibitors — all requiring quantitative choline pathway profiling for validation |
What This Means for Your Research
- Drug development programs targeting the TMAO pathway need quantitative validation.
Whether your intervention is a TMA lyase inhibitor, an FMO3 inhibitor, or a probiotic — the efficacy
endpoint is reduced TMAO with concomitant changes in choline and TMA. Our panel quantifies all three in
one injection.
- Mechanism-specific biomarkers require pathway-level resolution. TMAO promotes CVD
through three distinct mechanisms. The TMAO/TMA ratio distinguishes FMO3 inhibition from TMA lyase
inhibition; the TMAO/Choline ratio reflects microbial choline consumption. These indices are
pre-calculated in every data package.
Conclusion
This comprehensive review established the mechanistic framework linking choline metabolism to
cardiovascular disease through TMAO. Our panel quantifies every metabolite in this causal chain — choline,
TMA, and TMAO — providing the analytical capability to validate whether your intervention is interrupting
the pathway at the intended step.
Read the full paper: Zhen et al., Frontiers in Endocrinology, 2023
The Gut Microbial Metabolite Trimethylamine N-Oxide and Cardiovascular Diseases
Zhen, J., Zhou, Z., He, M., et al.
Journal: Frontiers in Endocrinology, 2023, 14, 1085041
Comprehensive review of TMAO mechanisms in CVD: reverse cholesterol transport inhibition, platelet
hyperreactivity, and NF-κB activation. Covers therapeutic strategies targeting the choline-TMA-TMAO axis.
Choline: An Essential Nutrient for Public Health
Zeisel, S. H., and da Costa, K. A.
Journal: New England Journal of Medicine, 2013, 368(17), 1575–1584
Comprehensive clinical review of choline biology covering dietary requirements, methylation,
acetylcholine synthesis, and membrane phospholipid production.


 Contact Us



