Redox Cofactors — What They Are and Why They Matter
Redox cofactors are the primary electron carriers that set the pace of metabolism and stress response: NAD⁺/NADH, NADP⁺/NADPH, GSH/GSSG, and FAD/FMN. Their absolute concentrations, ratios, and redox potentials (Eₕ) determine whether pathways run catabolic or anabolic, whether oxidative defenses hold, and whether engineered fluxes deliver the expected titer, rate, and yield.
Because these species are labile and matrix-sensitive, apparent shifts can be driven as much by sample handling as biology. Robust decisions therefore require true in-matrix preservation, selective chromatographic separation, and isotope-dilution quantification—not proxy readouts or single-enzyme kits. Measuring redox cofactors directly gives an early, quantitative window into pathway bottlenecks, antioxidant capacity, and process robustness across cultures, tissues, and complex broths.
What Problems We Solve for Our Clients
Understanding and maintaining redox balance is a central challenge in modern life sciences. Researchers working with microbial systems, mammalian cells, plants, or fermentation processes often encounter:
- Incomplete insight into metabolic efficiency — Even when cultures grow well, subtle imbalances in NAD⁺/NADH or NADP⁺/NADPH can limit flux through critical pathways.
- Uncertainty in oxidative stress evaluation — Conventional assays often fail to capture the real intracellular status of glutathione and other redox buffers.
- Variability between experiments or scales — Redox cofactors are highly labile; without strict stabilization and quantitative control, comparisons across batches or bioreactors can be unreliable.
- Limited reliability of indirect assays — Proxy measurements cannot substitute for direct quantification of cofactors at fmol–pmol sensitivity.
- Lack of defensible, publication-quality evidence — Many studies require robust, transparent data packages that document calibration, recovery, and QC acceptance rules.
By focusing on the direct, quantitative measurement of NAD(H), NADP(H), glutathione, flavins, CoA thioesters, and related metabolites, Creative Proteomics helps clients overcome these barriers and obtain data they can trust for research, process development, and comparative studies.
What Our Redox Cofactor Analysis Service Provides
Core Redox Quant (Required)
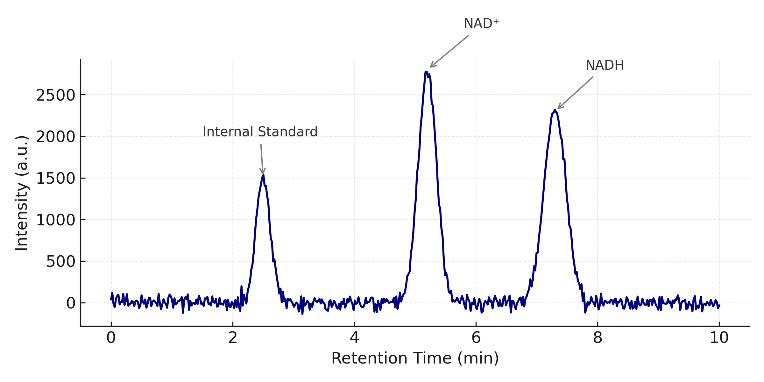
Analytes: NAD⁺, NADH, NADP⁺, NADPH, GSH, GSSG, FAD, FMN
Performance: 6–8-point calibration (r² ≥ 0.99), typical RSD ≤ 10–15%; indicative on-column LLOQ: pyridine nucleotides low-fmol; GSH/GSSG low-pmol; scheduled MRM with dual-polarity.
Output Focus: Absolute concentrations, NAD⁺/NADH, NADP⁺/NADPH, GSH/GSSG ratios with uncertainty estimates.
Redox Potential (Eₕ) Calculation Pack
Scope: Nernst-based Eₕ for GSH/GSSG and NAD couples; transparent assumptions (n, E°′, pH).
Use Cases: Stress models, process redox window comparison, mechanism validation.
Extended Antioxidant Panel
Analytes: Ascorbate/DHA; Cysteine/Cystine (± γ-Glu-Cys, Cys-Gly).
Controls: Light/oxygen minimization; matrix-matched recovery 80–120%.
Applications: Antioxidant formulation screening, media/additive evaluation.
CoA Thioesters & Energy Coupling Add-on
Analytes: CoA, Acetyl-CoA, Succinyl-CoA, Malonyl-CoA; ATP/ADP/AMP for energy charge.
Value: Link carbon flux and energetic state to redox constraints.
Comparability & QC Planning
Content: Pooled-QC placement, bracketed checks, reference-sample strategy; drift and bias thresholds that trigger re-acquisition.
Deliverables: QC trend plots, weighted regression model (1/x or 1/x²), back-calculated bias tables.
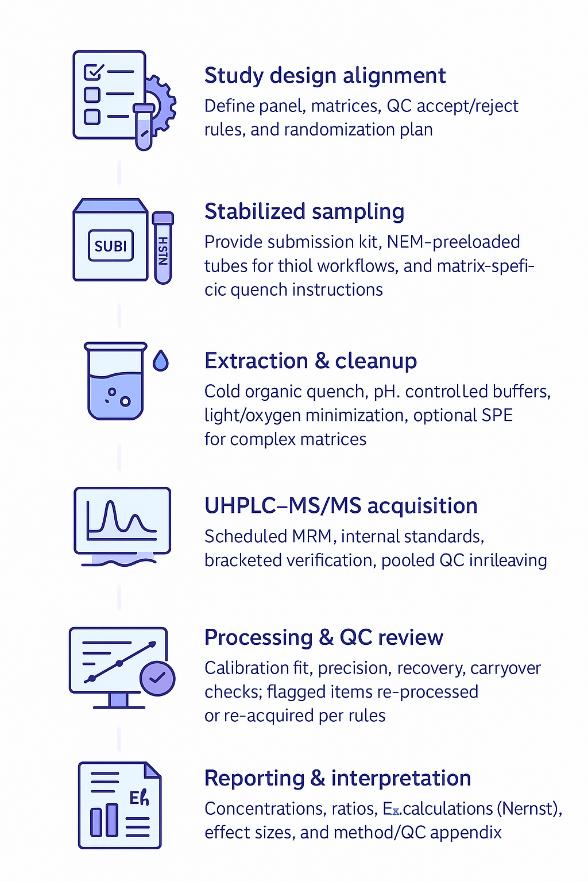
Sampling & Stabilization Kit
Content: Matrix-specific submission guide, cold-quench solvents, NEM-preloaded tubes for thiol workflows, low-temperature autosampler guidance, light-blocking materials.
Benefit: Minimizes artifactual oxidation/reduction and enhances cross-batch comparability.
Method Customization & Transfer
Content: Column options (e.g., ZIC-HILIC, BEH Amide), transition list, retention windows, qualifier/quantifier ion-ratio tolerances, optional SPE cleanup.
Use: Internal repeatability, cross-site technology transfer, publication-ready methods appendix.
Detected Redox Cofactors & Related Analytes (Configurable Panel)
| Class |
Primary Targets |
Optional/Related |
Typical Purpose |
| Pyridine nucleotides |
NAD⁺, NADH, NADP⁺, NADPH |
Nicotinamide, NMN |
Central redox currency; catabolic vs anabolic balance. |
| Glutathione system |
GSH, GSSG |
γ-Glu-Cys, Cys-Gly |
Intracellular redox buffer; GSH/GSSG and Eₕ(GSH) track oxidative load. |
| Flavins |
FAD, FMN |
Riboflavin |
Dehydrogenase cofactors; light sensitive—protected handling. |
| Thiol pairs |
Cysteine (Cys), Cystine (CySS) |
Homocysteine |
Extracellular redox indicator; complements GSH. |
| Ascorbate system |
Ascorbate (AA), Dehydroascorbate (DHA) |
— |
Aqueous antioxidant capacity; matrix-dependent stability control. |
| CoA thioesters |
CoA, Acetyl-CoA, Succinyl-CoA, Malonyl-CoA |
— |
Couple carbon flux and redox state. |
| Energy charge |
ATP, ADP, AMP |
— |
Contextualize redox with energetic status. |
| Pterins |
BH₄, BH₂ |
— |
Specialized redox pair (on request). |
Why Choose Our Redox Cofactor Analysis: Key Advantages
- Isotope-dilution accuracy: 13C/15N internal standards with matrix-matched calibration; weighted 1/x or 1/x² regression; documented r² ≥ 0.99.
- Actionable precision: Typical intra-batch RSD ≤ 10–15%; between-batch comparability monitored by pooled-QC trendlines and bracketed checks.
- Sensitivity aligned to biology: Indicative on-column LLOQ — NAD(P) couples: low-fmol; GSH/GSSG: low-pmol; FAD/FMN: sub- to low-pmol (matrix dependent).
- Low artifact risk: NEM-trapped thiols, oxygen/light minimization, pH-controlled extraction; carryover ≤ 20% of LLOQ or re-acquisition.
- Transparent QC logic: You receive transitions, retention windows, qualifier/quantifier ion ratios, recoveries, and acceptance criteria.
What Methods Are Used for Redox Cofactor Analysis
Chromatographic Separation
- UHPLC systems (Thermo Vanquish, Agilent 1290, Waters ACQUITY)
- HILIC columns (ZIC-HILIC, BEH Amide) for polar cofactors
- Optimized volatile buffers with pH control to stabilize redox states
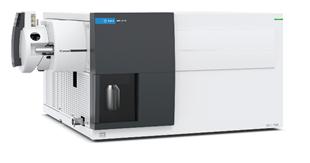
Mass Spectrometry
- Triple quadrupole MS (TSQ Altis, 6495C, Xevo TQ-S, QTRAP 6500+)
- ESI source with fast polarity switching
- Scheduled MRM with analyte-specific collision energies
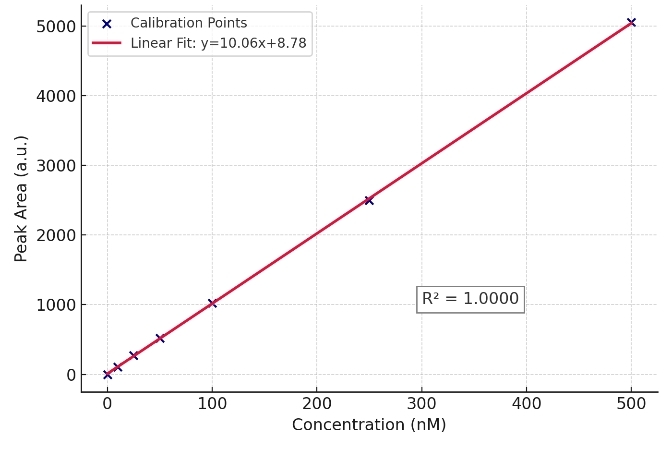
Calibration & Sensitivity
- 6–8 point calibration curves (weighted 1/x regression)
- Linearity: r² ≥ 0.99
- Detection range: low fmol to pmol on-column depending on analyte
- Isotope-labeled internal standards for accuracy
Quality Control
- Pooled QC interleaving for drift correction
- Replicate RSD typically ≤10–15%
- Carryover ≤20% of LLOQ
How Our Redox Cofactor Assay Works — Step-by-Step Process
Sample Requirements for Redox Cofactor Assay
| Sample Type |
Minimum Amount |
Stabilization |
Storage & Shipping |
Notes |
| Cultured cells (mammalian) |
1–5×10⁶ cells |
Cold organic quench; NEM for thiols |
Dry ice; protect from light |
Provide media, plate format, and harvest plan. |
| Microbial pellets/broth |
Pellet from defined OD or 200–500 µL broth |
Rapid quench; pH control |
Dry ice |
Indicate carbon source and oxygenation strategy. |
| Tissues/biomass |
10–50 mg wet weight |
Snap-frozen, pulverized |
Dry ice |
Avoid repeated freeze–thaw. |
| Biofluids (plasma/serum) |
50–100 µL |
Antioxidant handling per panel |
Dry ice |
Hemolysis status recommended. |
| Plant material |
20–50 mg |
Light-protected quench |
Dry ice |
Record photoperiod or stress condition if applicable. |
Deliverables: What You Get from Our Redox Cofactor Analysis
- Quant results: Absolute concentrations for each target; ratios (NAD⁺/NADH, NADP⁺/NADPH, GSH/GSSG).
- Calculated metrics: Eₕ values for glutathione and pyridine nucleotides with documented assumptions (n, E°′, pH).
- QC dossier: Calibration curves and statistics (r², back-calculated bias), LLOQ/ULOQ, spike-recovery, precision, carryover, and pooled-QC trendlines.
- Data package: Raw vendor files, processed peak tables, transition lists, and a methods appendix (column, mobile phases, MRM transitions, source settings).
- Interpretation brief: Concise commentary on significant shifts, effect sizes, and study-design-aware caveats.
- Consultation: Optional review session to align findings with your next experimental step.
High Levels of Oxidative Stress Early after HSCT Are Associated with Later Adverse Outcomes
Cook, E., Langenberg, L., Luebbering, N., Ibrahimova, A., Sabulski, A., Lake, K. E., … Davies, S. M.
Journal: Transplantation and Cellular Therapy
Year: 2024
Glycine supplementation can partially restore oxidative stress-associated glutathione deficiency in ageing cats
Ruparell, A., Alexander, J. E., Eyre, R., Carvell-Miller, L., Leung, Y. B., Evans, S. J., … Watson, P.
Journal: British Journal of Nutrition
Year: 2024
Inflammation primes the kidney for recovery by activating AZIN1 A-to-I editing
Heruye, S., Myslinski, J., Zeng, C., Zollman, A., Makino, S., Nanamatsu, A., … Hato, T.
Journal: bioRxiv
Year: 2023
Enhance trial: effects of NAD3® on hallmarks of aging and clinical endpoints of health in middle aged adults: a subset analysis focused on blood cell NAD+ concentrations and lipid metabolism
Roberts, M. D., Osburn, S. C., Godwin, J. S., Ruple, B. A., La Monica, M. B., Raub, B., … Lopez, H. L.
Journal: Physiologia
Year: 2022