GSH/GSSG — What They Are and Why They Matter
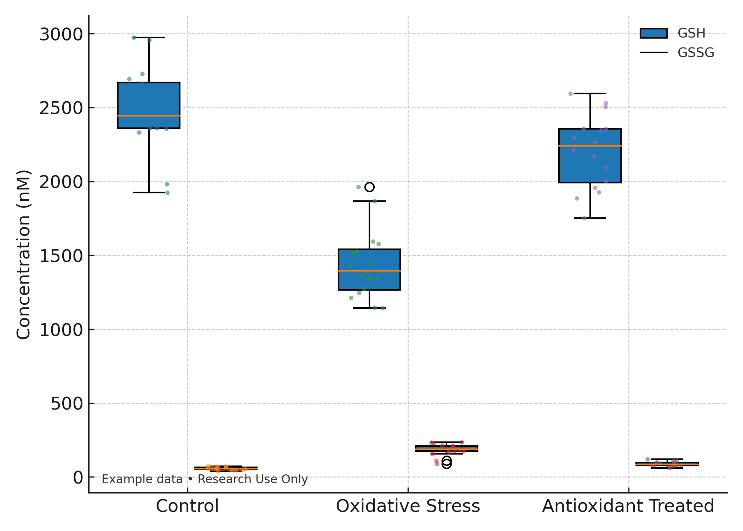
Glutathione is the primary intracellular antioxidant, existing as reduced glutathione (GSH) and its oxidized form (GSSG). The GSH/GSSG ratio is a widely accepted indicator of oxidative stress and cellular redox balance. Accurate measurement of this ratio is essential in oxidative stress studies, metabolic research, process monitoring, and quality assessment across biological and industrial applications.
The challenge lies in GSH's instability and rapid oxidation during sample handling, which can produce misleading results if not properly stabilized. Without artifact control, researchers risk underestimating GSH, overestimating GSSG, and misinterpreting redox status.
By combining on-collection stabilization with isotope-dilution LC-MS/MS, Creative Proteomics ensures artifact-free, reproducible quantitation of GSH, GSSG, and their ratio. This enables scientists to obtain true redox profiles, make data-driven decisions, and maintain consistency across studies and sites.
What Problems We Solve for Our Clients
- Unreliable Redox Measurements
Researchers often find their GSH results inconsistent because ex vivo oxidation during handling converts GSH to GSSG, leading to false redox ratios and misleading interpretations.
- Matrix-Specific Interference
Plasma, tissues, microbial broths, and plant extracts each introduce different interferences and ion suppression that make standard methods inaccurate.
- Data Inconsistency Across Studies
Without standardized stabilization and QC, results from different labs, batches, or time points often cannot be directly compared, slowing decision-making and reproducibility.
- Sample Volume Limitations
Many projects are constrained by scarce or precious material (e.g., small tissue biopsies, limited plasma volume, rare cell populations). Standard assays may require more than what is available.
- Opaque or Incomplete Reporting
Some services provide only concentration numbers without QC recoveries, calibration validation, or raw data, leaving researchers unsure whether results are trustworthy.
Detected Glutathiones & Related Analytes (Configurable Panel)
| Analyte |
Abbrev. |
Measured Form |
Representative MRM (Quant/Qual, m/z) |
Typical LLOQ (nM) |
Example Linear Range (nM) |
Typical Precision (CV%) |
Notes |
| Reduced Glutathione |
GSH |
Native |
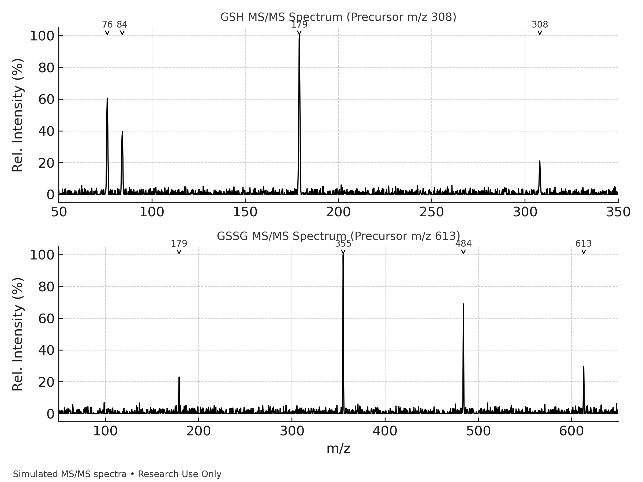
308 → 179 / 76 |
5–10 |
10–10,000 |
≤12 |
Rapid stabilization required to avoid ex vivo oxidation |
| Oxidized Glutathione |
GSSG |
Native |
613 → 355 / 484 |
2–5 |
5–5,000 |
≤12 |
Used with GSH to compute ratio |
| GSH–NEM Adduct |
GSH-NEM |
Derivatized |
433 → 304 / 84 |
1–5 |
5–10,000 |
≤10 |
Preferred under anti-artifact strategy |
| Total Glutathione |
tGSH |
Post-reduction |
See GSH channel |
5–10 |
10–10,000 |
≤12 |
Chemical reduction prior to measurement |
| γ-Glutamylcysteine |
γ-Glu-Cys |
Native |
249 → 130 / 84 |
5–20 |
20–5,000 |
≤15 |
GSH biosynthetic precursor |
| Cysteine / Cystine |
Cys/CySS |
Native/Deriv. |
122 → 76 / 59 (Cys); 241 → 152 (CySS) |
5–20 |
20–5,000 |
≤15 |
Enables Cys/CySS ratio |
| NADPH / NADP⁺ |
NADPH/NADP⁺ |
Native |
744 → 159 / 744 → 321 (ex.) |
20–50 |
50–10,000 |
≤15 |
Optional cofactor readouts |
| Representative GSH Conjugates |
GS-R |
Native |
Method-specific |
10–50 |
50–10,000 |
≤15 |
Electrophile detox research (panel configurable) |
Why Choose Our Glutathione Analysis Service: Key Advantages
- Artifact Control: Immediate stabilization reduces ex vivo oxidation artifacts to <5%, ensuring that the reported GSH/GSSG ratio reflects the true biological state.
- Quantitative Accuracy: Isotope-dilution LC-MS/MS achieves 85–115% recovery with relative error ≤15% across multiple matrices.
- High Sensitivity: nM-level LLOQ allows reliable measurement from minimal input (50–100 µL plasma or 20–50 mg tissue).
- Precision & Robustness: Intra-/inter-batch CV ≤15%, with dual ion-ratio and retention-time checks to prevent false positives.
- Transparency: Full QC package including calibration plots, QC recoveries, blanks, and raw LC-MS/MS files guarantees traceability and reproducibility.
- Scalable and Customizable: Custom panels and high-throughput options available for large-scale or multi-site studies.
Key Instrument Platforms for Accurate GSH/GSSG Quantification
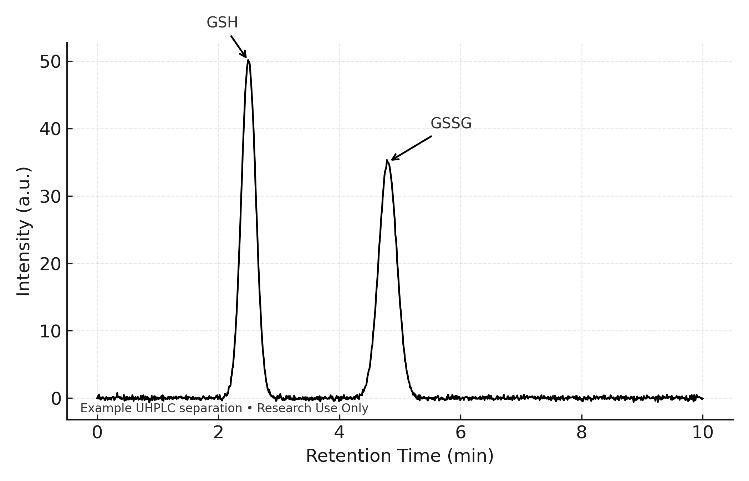
Chromatography (UHPLC)
- Column: C18 for native GSH/GSSG; HILIC for NEM-derivatized samples.
- Column Dimensions: 2.1 × 50–100 mm, sub-2 µm for high resolution.
- Mobile Phase: Water with formic acid or ammonium formate, paired with acetonitrile.
- Injection Volume: 1–5 µL
- Temperature: Column: 30–40 °C, Autosampler: 4–8 °C for stability.
Mass Spectrometry (Triple Quadrupole MS)
- Ionization: ESI+ for maximum sensitivity.
- Acquisition Mode: MRM (Multiple Reaction Monitoring) for high specificity and precision.
- Resolution: Unit mass with dwell times tuned for optimal peak detection.
- Desolvation Temperature: 350–450 °C for efficient ionization
Stabilization & Internal Standards
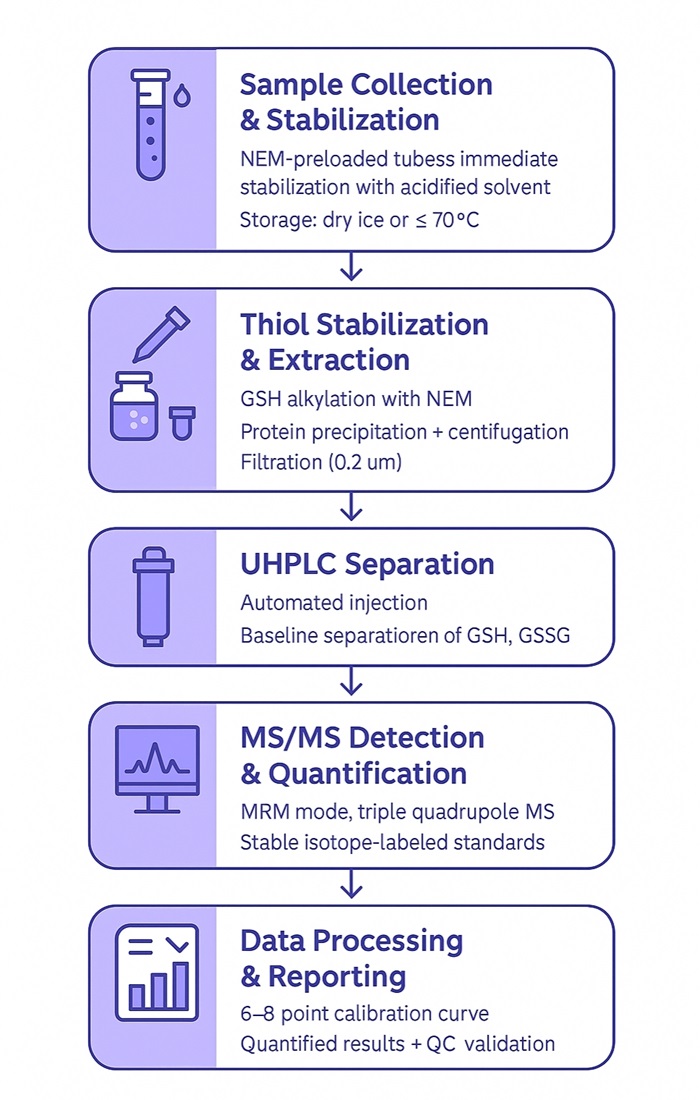
- Stabilization: NEM alkylation with acidified quenching immediately after collection.
- Internal Standards: 13C/15N-GSH and 13C/15N-GSSG for absolute quantification and matrix correction.
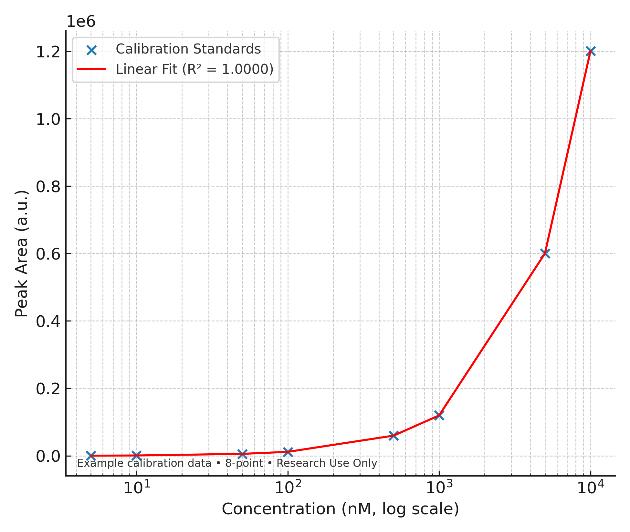
Calibration & Accuracy
- Calibration: 6–8 point external calibration for accurate results (1/x weighting).
- Identity Confirmation: Retention-time and ion-ratio checks ensure reliable quantitation.
How Our GSH/GSSG Assay Works — Step-by-Step Process
Sample Requirements & Handling Guidelines for Glutathione (GSH/GSSG) Analysis
| Sample Type |
Required Volume |
Collection Method |
Handling Instructions |
| Plasma/Serum |
≥50–100 µL per analysis |
Use K2-EDTA or heparin anticoagulant. |
Stabilize immediately with NEM-preloaded tubes, store at ≤-70°C. |
| Whole Blood |
≥100 µL per analysis |
Collect in NEM-preloaded tubes or stabilize with NEM. |
Store at ≤-70°C immediately after collection. |
| Tissue Samples |
≥20–50 mg per analysis |
Snap-freeze or use dry ice during transport. |
Store at ≤-70°C prior to analysis. |
| Cell Pellets |
≥0.5–2.0 × 10^6 cells per analysis |
Pellet cells, quench with NEM stabilizer, and freeze. |
Freeze at ≤-70°C immediately. |
| Microbial Cultures/Fermentation Broth |
≥0.5–1.0 mL per analysis |
Quench immediately with NEM and freeze. |
Store at ≤-70°C. |
| Plant/Food Samples |
≥50–100 mg per analysis |
Homogenize and snap-freeze immediately or use dry ice. |
Store at ≤-70°C prior to analysis. |
Deliverables: What You Receive from Our Glutathione (GSH/GSSG) Analysis
- Clear Quantitative Data: Reliable concentration values for GSH, GSSG, total glutathione (tGSH), and the GSH/GSSG ratio, presented in easy-to-read tables.
- Extended Results (Optional): Additional metabolites such as γ-glutamylcysteine, cysteine/cystine, NADPH/NADP⁺, and selected glutathione conjugates if requested.
- Quality-Checked Results: Every dataset includes QC validation, calibration curves, and reproducibility checks, so you can trust the numbers.
- Raw and Processed Data: Access to both chromatograms & MS raw files plus processed datasets, ensuring transparency and enabling re-analysis.
- Comprehensive Final Report: A client-ready report with results summary, QC notes, and key figures, designed for straightforward interpretation and easy integration into your research.
High Levels of Oxidative Stress Early after HSCT Are Associated with Later Adverse Outcomes
Cook, E., Langenberg, L., Luebbering, N., Ibrahimova, A., Sabulski, A., Lake, K. E., … Davies, S. M.
Journal: Transplantation and Cellular Therapy
Year: 2024
Glycine supplementation can partially restore oxidative stress-associated glutathione deficiency in ageing cats
Ruparell, A., Alexander, J. E., Eyre, R., Carvell-Miller, L., Leung, Y. B., Evans, S. J., … Watson, P.
Journal: British Journal of Nutrition
Year: 2024
Inflammation primes the kidney for recovery by activating AZIN1 A-to-I editing
Heruye, S., Myslinski, J., Zeng, C., Zollman, A., Makino, S., Nanamatsu, A., … Hato, T.
Journal: bioRxiv
Year: 2023