Metabolomics Creative Proteomics

Oxidative Stress Marker Analysis Service

Uncover oxidative stress mechanisms with high-sensitivity LC-MS/MS panels — tailored marker analysis that delivers clarity, accuracy, and confidence.

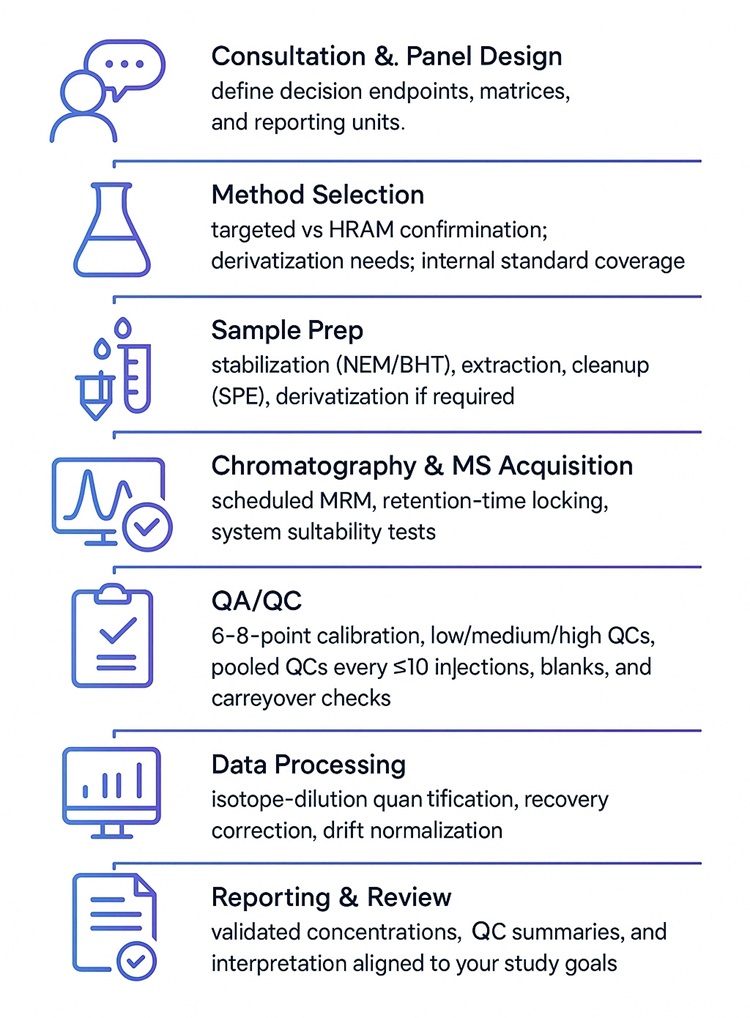
  • Why us? Sub-ng/mL sensitivity, isotope-dilution accuracy, QC-driven reproducibility
  • What we provide? Targeted multi-marker panels across lipid, protein, DNA, redox, and nitrosative pathways
  • What problem we solve? Detect unstable, low-abundance markers with reliable comparability across samples and studies

Explore how our customizable panels and validated workflow can strengthen your research decisions.

CONTACT EXPERT

Curious about Metabolomics?

Download Our Brochure to Learn More!

  • Service Details
  • FAQ
  • Publications
  • Submit Your Inquiry

What Are Oxidative Stress Markers — and Why Analyze Them?

Oxidative stress markers are measurable molecules produced when reactive oxygen/nitrogen species (ROS/RNS) interact with lipids, proteins, and nucleic acids. They capture mechanistic readouts of damage (e.g., lipid peroxidation, protein carbonylation, DNA oxidation) and defense status (e.g., GSH/GSSG ratio, enzymatic activity), enabling you to:

  • Validate mechanisms in cell/tissue models and preclinical studies
  • Rank compounds by pro-/anti-oxidant liability
  • Optimize bioprocesses (cell culture media, feed strategies)
  • Characterize materials and foods for oxidation stability
  • Support safety and toxicology research with targeted, quantitative endpoints

What Problems We Solve for Our Clients

Low-abundance & unstable markers

Challenge: 8-iso-PGF2α, 8-OHdG, and 4-HNE adducts are scarce and degradation-prone.

Our approach: Isotope-dilution LC-MS/MS with scheduled MRM; immediate stabilization (NEM/BHT/DTPA); cooled, low-light handling.

Outcome: LLOQ 0.01–0.05 ng/mL, recovery 85–115%, intra-run CV ≤10%.

Isomeric interference

Challenge: F2-isoprostanes co-elute with prostaglandins; probe by-products overlap in m/z.

Our approach: UPLC (C18, 1.7 µm) for baseline separation; ion-ratio locking; HRAM confirmation when required.

Matrix effects & ion suppression

Challenge: Variable biological matrices distort response and linearity.

Our approach: SPE cleanup; matrix-matched calibration; post-column infusion mapping; internal-standard normalization.

Artifactual oxidation during handling

Challenge: Ex vivo oxidation inflates MDA/4-HNE and oxidizes GSH.

Our approach: Preservative SOPs, process blanks, and isotope-recovery monitors across the workflow.

Outcome: Blanks & carryover <20% of LLOQ; artifacts minimized and documented.

Limited sample volume with broad coverage needs

Challenge: Small inputs must support multi-analyte decisions.

Our approach: Multiplexed panels spanning lipid/protein/DNA/NO/thiol markers; microflow UPLC with optimized dwell times.

Outcome: ≥40 analytes quantified per run with inter-batch CV ≤12%.

Batch-to-batch comparability in large studies

Challenge: Instrument drift and extraction variability degrade longitudinal analyses.

Our approach: Pooled QCs every set, SST monitoring, and LOESS-based drift correction.

Outcome: Inter-batch CV ≤12% and QC pass rate ≥85%.

Cross-matrix comparability

Challenge: Differences between urine, plasma, tissue, and cell systems hinder comparisons.

Our approach: Creatinine/protein/wet-weight normalization with cross-matrix validation.

Outcome: Recovery 85–115% and consistent ratios (e.g., GSH/GSSG).

Migration from ELISA/colorimetry

Challenge: Need higher specificity and wider range without losing continuity.

Our approach: Structured bridging studies (ELISA ↔ LC-MS/MS), method transfer packs (MRM list, ranges, acceptance criteria).

Outcome: r ≥0.85 agreement and scalable quantification on LC-MS/MS.

What We Offer — Oxidative Stress Marker Analysis Services

  • Targeted Oxidative Stress Panels (LC-MS/MS & GC-MS/MS): Quantitative panels across lipid peroxidation, protein oxidation, DNA/RNA oxidation, thiol redox, and nitrosative pathways.
  • HRAM Confirmation & Structural ID: Orbitrap-based confirmation for critical calls, isomer resolution support, and adduct verification.
  • Antioxidant & Enzymatic Readouts: TAC (FRAP/ABTS/ORAC/CUPRAC) and enzyme activities (SOD, CAT, GPx/GR) for complementary antioxidant capacity profiling.
  • ROS/RNS Readouts (Cells & Lysates): Probe-based measurements (e.g., DHE oxidation to 2-hydroxyethidium; H₂O₂ assays) with method blanks and spike recoveries.
  • Custom Panel Design & Method Transfer: Matrix-specific target selection, isotope-labeled internal standards, reporting units/thresholds aligned to your SOPs, and ELISA-to-LC-MS/MS bridging.

Oxidative Stress Markers & Detectable Analytes

Marker Class Representative Detectable Analytes Primary Method(s)
Lipid Peroxidation MDA; 4-HNE; 4-HHE; 4-ONE; acrolein; crotonaldehyde; F2-isoprostanes (8-iso-PGF2α, 2,3-dinor-8-iso-PGF2α, iPF2α-VI); isofurans; F4-neuroprostanes / neurofurans; 9-/13-HpODE; 5-/12-/15-HPETE; 7-ketocholesterol, 7β-hydroxycholesterol, 25-hydroxycholesterol; 4-HNE–His/Lys/Cys adducts; isolevuglandin (isoketal)–lysyl lactams LC-MS/MS; GC-MS/MS (derivatized)
Protein Oxidation Protein carbonyls (DNPH-derived); 3-nitrotyrosine; 3-chlorotyrosine; dityrosine; o-tyrosine; methionine sulfoxide; protein S-glutathionylation (PSSG) LC-MS/MS; HPLC-UV
DNA/RNA Oxidation 8-oxo-dG (8-OHdG); 8-oxo-G; 8-oxo-dA; FapyG/FapyA; thymine glycol; 5-hydroxymethyluracil (5-hmU); lipid peroxidation–DNA adducts (M1dG [MDA-dG], HNE-dG, γ-OHPdG) LC-MS/MS; HRAM LC-MS (confirmation)
Thiol/Redox State GSH, GSSG, cysteine (Cys), cystine (CySS), homocysteine; GSH/GSSG and Cys/CySS ratios (reported); redox potential Eh (calculated from measurements) LC-MS/MS; HPLC-FLD (OPA/NEM)
Nitrosative/NO Pathway Nitrite (NO₂⁻); nitrate (NO₃⁻); total NOx; S-nitrosothiols (GSNO, CysNO, AlbSNO); peroxynitrite footprints (via 3-nitrotyrosine) LC-MS/MS; Ion Chromatography / Griess
Antioxidant Capacity (Assay Readouts) FRAP (ferric reducing ability); ABTS; ORAC; CUPRAC (reported as Trolox equivalents) Spectrophotometry
Reactive Species & Probes Hydrogen peroxide (H₂O₂); DHE oxidation products with specificity for 2-hydroxyethidium (superoxide readout); hypochlorous acid footprints (via 3-chlorotyrosine) Fluorimetry / Colorimetry; LC-MS for probe-specific products

Why Choose Our Oxidative Stress Marker Analysis Service: Key Advantages

  • Quantitative sensitivity & range — Sub-ng/mL LLOQs across key classes (F2-isoprostanes, 8-OHdG, 4-HNE adducts) with 3–4 orders dynamic range and R² ≥0.995 calibration.
  • High analytical specificity — Baseline isomer resolution for critical pairs and optional HRAM confirmation; multi-transition ion-ratio checks for confident IDs.
  • Isotope-dilution coverage — Stable-isotope internal standards for >70% of targeted analytes to control recovery and matrix effects.
  • Low input, high multiplexing — Quantify ≥40 analytes per run from small inputs (e.g., ≤50 μL plasma/serum or ~10 mg tissue) with maintained precision.
  • Reproducibility at scale — Dense QC cadence and drift correction deliver inter-batch CV ≤12% and QC pass rate ≥85% in large studies.
  • Artifact control — Preservative/stabilizer SOPs plus process blanks and carryover control keep blanks & carryover <20% of LLOQ.
  • Transparent deliverables — Full method and data package (MRM lists, retention times, calibration/QC tables; raw/processed files on request) for audit-ready traceability.
  • Configurable & extensible — Matrix-specific panels, add/remove targets, and ELISA-to-LC-MS/MS bridging (r ≥0.85) to preserve continuity with legacy datasets.

Instrument Platforms for Accurate Oxidative Stress Marker Quantification

LC-MS/MS — Targeted Quantification

  • Triple quadrupole: SCIEX Triple Quad 6500+/7500, Agilent 6495C
  • Ionization: ESI (+/−) with heated source; scheduled MRM; dwell auto-optimization
  • UPLC: Waters ACQUITY I-Class or Thermo Vanquish; C18, 1.7 µm, 2.1×100 mm; flow ~0.3 mL/min
  • Typical buffers: 0.1% formic acid in water/ACN (positive) or ammonium acetate (negative)

HRAM LC-MS — Structural Confirmation/Discovery

  • Orbitrap: Thermo Q Exactive/Exploris 480
  • Resolution 60,000–120,000 @ m/z 200; mass accuracy <3 ppm; HESI (+/−)

GC-MS/MS — Aldehydes & Isoprostanes (Derivatized)

  • Agilent 7890B GC + 7000D TQ or Shimadzu GCMS-TQ8050 NX
  • EI 70 eV; column DB-5ms 30 m × 0.25 mm × 0.25 µm
  • Derivatization: PFBHA for aldehydes (e.g., MDA), appropriate silylation for isoprostanes

HPLC-FLD/UV

  • Agilent 1260 Infinity with FLD for GSH/GSSG (OPA/NEM stabilization; Ex/Em ~340/420 nm)
  • DNPH-based protein carbonyl quant by UV (~370 nm) with reference standards
Waters ACQUITY UPLC System

Waters ACQUITY UPLC System (Figure from Waters)

SCIEX Triple Quad 6500+

SCIEX Triple Quad™ 6500+ (Figure from Sciex)

Agilent 1260 Infinity II HPLC

Agilent 1260 Infinity II HPLC (Figure from Agilent)

Agilent 6495C Triple quadrupole

Agilent 6495C Triple quadrupole (Figure from Agilent)

How Our Oxidative Stress Marker Assay Works — Step-by-Step Process

Oxidative Stress Marker Analysis Workflow

Sample Requirements for Oxidative Stress Marker Assay

Matrix Requested Amount (per sample) Container & Preservatives Handling Notes Storage & Shipping
Plasma / Serum 50–200 µL Polypropylene tube; EDTA anticoagulant preferred; for thiol assays add NEM; for lipid peroxidation markers consider BHT/DTPA Avoid hemolysis; aliquot immediately after separation; minimize air exposure −80 °C; ship on dry ice
Urine 0.5–2 mL Polypropylene tube; no additives Mix gently; optional creatinine normalization available (provide if required) −80 °C; ship on dry ice
Tissue (wet weight) 10–50 mg Cryovial Snap-freeze; record wet weight; avoid repeated freeze–thaw −80 °C; ship on dry ice
Cell Pellets 1–5 × 10⁶ cells Cryovial Wash with PBS; remove media completely; add NEM for thiol stability −80 °C; ship on dry ice
Cell / Tissue Lysates 100–300 µL Low-bind tube; indicate buffer composition Include protease inhibitors as needed; for lipid markers, include BHT; avoid detergents when possible −80 °C; ship on dry ice
Culture Media / Supernatant 0.5–1 mL Polypropylene tube Note supplements (FBS, antioxidants, metals); clarify/centrifuge to remove cells/debris −80 °C; ship on dry ice
DNA Hydrolysates Equivalent to ≥1–5 µg DNA Low-bind tube Provide hydrolysis protocol; avoid oxidative reagents −80 °C; ship on dry ice
Food / Feed Extracts 0.5–2 mL extract or >200 mg material Sealed tube; describe solvent system Provide extraction SOP and matrix description; keep cold and protected from light Keep cold; ship on dry ice

Deliverables: What You Receive from Our Oxidative Stress Marker Analysis

  • Quantitative Results: Analyte concentrations (e.g., ng/mL, µM, or normalized units) with LLOQ/ULOQ, accuracy, precision, and recovery.
  • QA/QC Package: Calibration curves, R², QC acceptance (±15%/±20% at LLOQ), blanks, carryover, and system suitability.
  • Chromatographic & MS Evidence: Representative chromatograms, MRM transition lists, retention times, HRAM confirmations (when applicable).
  • Study Report: Methods, sample prep details, internal standards used, normalization steps, and data dictionaries.
  • Optional Analytics: Group statistics, volcano plots, heatmaps, and correlation with other endpoints.
  • Data Files (on request): Raw vendor files (e.g., .wiff/.raw), processed tables (.csv/.xlsx), and instrument methods.
Calibration curve of oxidative stress marker with linear regression and R² value showing high quantitation accuracy.

Calibration curve showing linear response of oxidative stress marker quantification. Excellent correlation (R² ≥ 0.995) across four orders of magnitude demonstrates robust sensitivity and accuracy.

Bar chart showing intra- and inter-batch QC precision with CV values below acceptance limit of 15%.

Intra- and inter-batch precision results for low, mid, and high QC levels. All coefficients of variation (CV%) remain below 12%, well within acceptance limits.

LC-MS/MS chromatogram showing analyte peak and internal standard peak at the same retention time with clean separation.

Representative LC-MS/MS chromatogram of a target analyte and its internal standard. Clear co-elution and well-defined peaks illustrate assay specificity and signal quality.

Heatmap showing relative concentration of multiple oxidative stress markers across biological samples.

Heatmap of multiple oxidative stress markers across different samples. Distinct concentration patterns highlight the breadth of analyte coverage and variability among samples.

Do you also provide untargeted approaches for oxidative stress analysis?

Yes. While this service page emphasizes targeted LC-MS/MS and GC-MS/MS panels to ensure quantitative accuracy, reproducibility, and decision-ready data, we can also support untargeted metabolomics strategies for exploratory research. Untargeted workflows are useful for discovering novel biomarkers or hypothesis generation, and can be integrated with targeted assays for comprehensive study designs.

Can I request specific isomers or adducts not listed in your standard panel?

Yes. Custom method development can target specific isomers (e.g., F2-isoprostane subtypes) or DNA adducts, provided reference standards are available. Panels can be extended with isotopically labeled internal standards for precise quantification.

How do you handle normalization across different biological matrices?

Normalization is tailored to the sample type: creatinine for urine, protein content or tissue wet weight for solid samples, and internal standard correction for plasma/serum. This ensures cross-matrix comparability when analyzing diverse sample sets.

Can oxidative stress marker analysis be applied to non-biological products such as food, feed, or bioprocess media?

Absolutely. Our methods are validated across diverse matrices, including food extracts, feed formulations, and culture media, making them suitable for stability testing and process optimization beyond biological samples.

Can I combine oxidative stress marker analysis with other assays?

Yes. Results can be integrated with metabolomics, proteomics, or antioxidant enzyme activity measurements. Many clients use this combined approach to correlate oxidative stress endpoints with metabolic shifts or protein modifications for a more holistic picture.

High Levels of Oxidative Stress Early after HSCT Are Associated with Later Adverse Outcomes

Cook, E., Langenberg, L., Luebbering, N., Ibrahimova, A., Sabulski, A., Lake, K. E., ... & Davies, S. M.

Transplantation and Cellular Therapy

Year: 2024

Temperature stability of urinary F2-isoprostane and 8-hydroxy-2′-deoxyguanosine

Kordas, K., Ghazal, D., Queirolo, E. I., Olson, J. R., Beledo, M. I., & Browne, R. W.

Practical Laboratory Medicine

Year: 2024

Elevated SLC7A2 expression is associated with an abnormal neuroinflammatory response and nitrosative stress in Huntington's disease

Gaudet, I. D., Xu, H., Gordon, E., Cannestro, G. A., Lu, M. L., & Wei, J.

Journal of Neuroinflammation

Year: 2024

Glycine supplementation can partially restore oxidative stress-associated glutathione deficiency in ageing cats

Ruparell, A., Alexander, J. E., Eyre, R., Carvell-Miller, L., Leung, Y. B., Evans, S. J., ... & Watson, P.

British Journal of Nutrition

Year: 2024

Untargeted metabolomics reveal sex-specific and non-specific redox-modulating metabolites in kidneys following binge drinking

Rafferty, D., de Carvalho, L. M., Sutter, M., Heneghan, K., Nelson, V., Leitner, M., ... & Puthanveetil, P.

Redox Experimental Medicine

Year: 2023

For Research Use Only. Not for use in diagnostic procedures.
Submit Your Inquiry
return-top