Why ICP-MS Metallomics Matters
Metals and minerals are not merely markers of exposure. Beyond the well-documented toxicity concerns associated with certain elements, many metal ions perform essential biochemical functions—serving as enzyme cofactors, stabilizing protein structures, and modulating cellular pathways. These biological roles are increasingly recognized as integral components of physiological and pathological processes.
Due to their close integration with the proteome and metabolome, metal ions constitute a foundational biochemical layer that informs developmental biology, metabolic regulation, and disease mechanisms. Failure to assess metal content may obscure mechanistic drivers and introduce unrecognized confounding variables in experimental and translational studies.
Our ICP-MS–based metallomics panel enables research teams to address high-value scientific questions, such as:
- Are observed metabolic changes attributable to shifts in ionic homeostasis (e.g., Na⁺, K⁺, Ca²⁺, Mg²⁺), or to downstream pathway alterations?
- Do sample cohorts exhibit trace metal profiles that support or challenge proposed toxicity or mechanistic hypotheses?
- Which elemental concentrations are suitable for use as quantitative biomarkers in validation, stratification, or longitudinal analysis?
ICP-MS Quantification Approach
Inductively coupled plasma–mass spectrometry (ICP-MS) is our primary platform for multi-element quantification in metallomics studies. It enables absolute concentration reporting across macro-level minerals and trace-level metals within one workflow.
- Interference control: collision/reaction cell modes to minimize polyatomic interferences (method-dependent).
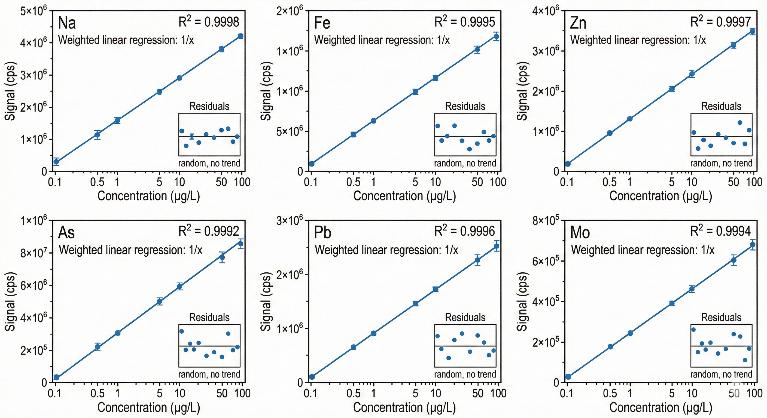
- Quantitation: multi-point calibration with internal-standard correction for robust comparability across cohorts.
- Clean execution: trace-metal contamination control and matrix-appropriate preparation to support low-abundance interpretation.
Optional (project-dependent): hyphenated ICP-MS (LC/SEC-ICP-MS) for protein-bound metals/speciation; spatial imaging workflows (e.g., LA-ICP-MS/MSI) for tissue localization.
Metals and Elements We Quantify
Our ICP-MS-based metallomics assay provides comprehensive elemental coverage across macronutrient metals, micronutrient trace elements, toxic heavy metals, and specialty metals relevant to biological, environmental, and pharmacological research. The panel includes a well-defined core panel suitable for most preclinical and clinical studies, and an extended panel that expands detection to rare earths, precious metals, and industrially relevant elements.
Core Panel (Standard Coverage – 28 Elements)
This panel is designed for broad biological relevance and analytical consistency across commonly studied matrices such as plasma, serum, and urine.
| Category |
Elements Included |
| Electrolytes / Macrominerals |
Sodium (Na), Potassium (K), Calcium (Ca), Magnesium (Mg), Phosphorus (P) |
| Essential Trace Elements |
Iron (Fe), Copper (Cu), Zinc (Zn), Selenium (Se), Manganese (Mn), Cobalt (Co), Molybdenum (Mo), Chromium (Cr), Nickel (Ni), Vanadium (V) |
| Toxic / Exposure-Linked Metals |
Arsenic (As), Cadmium (Cd), Lead (Pb), Thallium (Tl), Antimony (Sb), Aluminum (Al) |
| Environmental / Background Elements |
Barium (Ba), Strontium (Sr), Silver (Ag) |
| Other Alkali/Alkaline Earth Ions |
Boron (B), Lithium (Li), Rubidium (Rb), Cesium (Cs) |
Extended Panel (Optional Add-Ons – 15+ Elements)
These elements are available as optional add-ons for studies requiring broader metallomic profiling, including metal-based drug research, rare earth monitoring, or advanced environmental/metabolic models.
| Add-On Group |
Elements Included |
| Precious Metals |
Platinum (Pt), Palladium (Pd) |
| Rare Earth / Lanthanides |
Cerium (Ce), Lanthanum (La), Neodymium (Nd), Yttrium (Y) |
| Refractory / High-Melting Metals |
Titanium (Ti), Tungsten (W), Zirconium (Zr), Hafnium (Hf), Niobium (Nb) |
| Additional Specialty Elements |
Gallium (Ga), Germanium (Ge), Tin (Sn), Tellurium (Te) |
Note: Availability of extended elements may depend on matrix compatibility and expected concentration ranges. Performance metrics such as LLOQ can be confirmed during project setup.
Summary Table (Full Element List)
| Total Elements (Core + Extended) |
| Na, K, Ca, Mg, P, Fe, Cu, Zn, Se, Mn, Co, Mo, Cr, Ni, V, As, Cd, Pb, Tl, Sb, Al, Ba, Sr, Ag, B, Li, Rb, Cs, Pt, Pd, Ce, La, Nd, Y, Ti, W, Zr, Hf, Nb, Ga, Ge, Sn, Te |
This full menu ensures high coverage across electrolyte homeostasis, oxidative stress, metal toxicity, drug delivery, and metabolic trace metal pathways.
Advantages of Our Metal Analysis Service
- Absolute quantitation – ICP-MS delivers concentration values (not just relative changes) to support biomarker validation, cohort comparisons, and longitudinal study design.
- Macro-to-trace dynamic range – One quantitative workflow captures macro-level electrolytes (ppm range) and trace metals (ppb range) within a single panel framework.
- Core + extended element menu – A standardized core panel covers high-frequency biological and exposure needs, with optional add-ons (e.g., rare earths and precious metals) for hypothesis-driven expansion.
- Biofluid-ready workflows – Designed for common biological matrices (e.g., plasma/serum/urine) with clear minimum input expectations to simplify study planning.
- End-to-end service – From sample intake through data delivery, the workflow is built to reduce operational handoffs and accelerate time-to-insight.
Quantitation Limits and QC
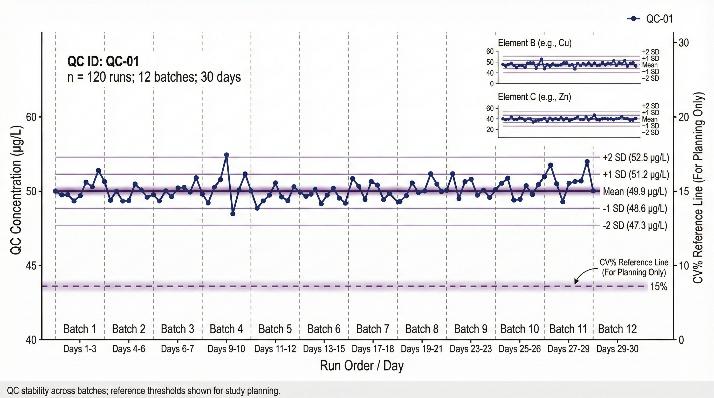
Our ICP-MS metallomics analysis supports absolute quantitation for research use, with quality controls designed to ensure consistency and reproducibility across biological and environmental matrices.
Analytical Quality Control
| QC Area |
What Is Applied |
Purpose |
| Calibration & verification |
External controls and calibration curves |
Monitor accuracy and recovery |
| Drift & matrix correction |
Internal-standard normalization |
Improve batch-to-batch comparability |
| Interference management |
Instrument methods to reduce polyatomic interferences |
Ensure true elemental signals in complex matrices |
Quantitative Data Reporting
| Reporting Item |
Description |
| Concentration units |
Absolute values reported as µg/L (biofluids) or µg/g (solids) |
| LLOQ handling |
Element-specific LLOQ established |
| Low-abundance results |
Values below LLOQ reported as "<LLOQ" (not zero) |
This approach enables appropriate statistical treatment of low-level signals in downstream analysis.
Typical LLOQ (Biofluids)
Published LLOQs for plasma/serum/urine from a widely used ICP-MS metal panel, provided for study planning only. LLOQ may vary by matrix and study design.
| Tier |
Elements (examples) |
Typical LLOQ (µg/L) |
| Macro minerals |
Na, K, Ca, Mg |
1,000–160,000 |
| Nutrient metals |
Fe, Cu, Zn |
40 |
| Low-ppb essentials |
Se, Cr, Sr |
4.00–6.25 |
| Trace/toxic |
As, V, Ni, Ba |
1.25–2.00 |
| Ultra-trace/toxic |
Tl, Pb, Mn |
0.400–0.500 |
| Ultra-trace |
Cd, Sb, Co, Ag, Mo |
0.250 |
Matrix-specific LLOQ summaries can be confirmed during project setup or upon request.
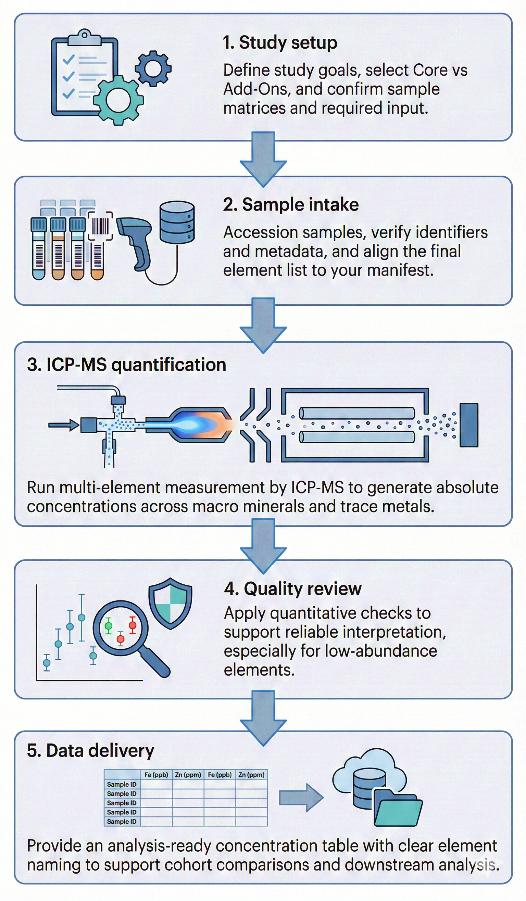
ICP-MS Metallomics Workflow
ICP-MS Quantification vs. MSI Imaging in Metals Research
Different metallomics research questions require different strategies. If your priority is how much of a metal is present in biological samples, ICP-MS is the optimal approach. If your question is where the metal is located within tissues or cells, mass spectrometry imaging (MSI) may be more appropriate.
| Criteria |
ICP-MS Quantification |
Mass Spectrometry Imaging (MSI) |
| Primary Output |
Absolute concentration (µg/L) |
Spatial distribution in tissue |
| Best For |
Cohort studies, systemic exposure, biomarker quantitation |
Localization of metal-based drugs, tissue uptake, microenvironment |
| Sample Types |
Biofluids (e.g., plasma, serum, urine) |
Tissue sections (FFPE or fresh frozen) |
| Quantitation |
Highly accurate and reproducible |
May require calibration; relative or semi-quantitative |
| Throughput |
High (multiple samples/cohorts) |
Lower (sample preparation-intensive) |
| Data Use |
Statistical comparison, validation, profiling |
Imaging, localization, mechanistic interpretation |
Strategic Recommendation:
If your study focuses on exposure, biomarker discovery, or system-wide metal profiling, use ICP-MS quantification to obtain robust, cohort-ready data.
For studies involving metal-based therapeutics, tissue-specific uptake, or distribution in tumor vs. healthy regions, MSI imaging can be used to complement ICP-MS—not replace it—by adding spatial insight.
Many drug development programs benefit from both: ICP-MS for dose/exposure relationships, MSI for localization and retention patterns in tissues.
Sample Types and Minimum Input for Metallomics Assay
| Sample Matrix |
Minimum Input |
Recommended Input |
Collection & Storage Notes |
| Plasma / Serum |
100 µL |
250 µL |
Use trace-element free tubes (e.g., Royal Blue top). Avoid hemolysis. Separate plasma/serum within 2 hours. |
| Whole Blood |
100 µL |
300 µL |
Use trace-element free tubes (EDTA or Heparin). Freeze at -80°C. |
| Urine |
500 µL |
2 mL |
Collect mid-stream. No preservatives required if frozen immediately. |
| Tissue (Soft) |
20 mg |
50–100 mg |
Rinse tissue with trace-metal grade saline/PBS to remove residual blood. Snap freeze. |
| Cells (Pellet) |
2×10⁶ cells |
5×10⁶ cells |
Wash 2-3 times with PBS to remove media. Remove supernatant completely before freezing. |
| Hair / Nails |
20 mg |
50 mg |
Cut close to the scalp/root. Store in clean, dry paper envelopes or PE bags at room temp. |
| Water / Media |
2 mL |
10 mL |
Collect in acid-washed HDPE/PP bottles. Acidification (HNO₃) can be performed upon receipt. |
What You Receive: Deliverables from ICP-MS Metallomics Analysis
- Results table (CSV/XLSX): Sample × element matrix with absolute concentrations (µg/L) for all requested Core and Add-On elements.
- Units & metadata map: Data dictionary defining units, element symbols/names, and a sample ID ↔ group/timepoint mapping for analysis-ready import.
- QC summary: Run-level and sample-level QC notes, including below-quantitation flags (e.g., <LLOQ) and any re-run/exception annotations.
- Element coverage manifest: Final confirmed analyte list showing Core vs Add-Ons and reporting status per element.
- Demo-format preview (optional): A representative output example so your team can validate structure before full delivery.
Applications for Metallomics Analysis
Fatty Acid and Antioxidant Profile of Eggs from Pasture-Raised Hens Fed a Corn- and Soy-Free Diet and Supplemented with Grass-Fed Beef Suet and Liver
Sergin, S., Jambunathan, V., et al.
Journal: Foods
Year: 2022
DOI: https://doi.org/10.3390/foods11213404