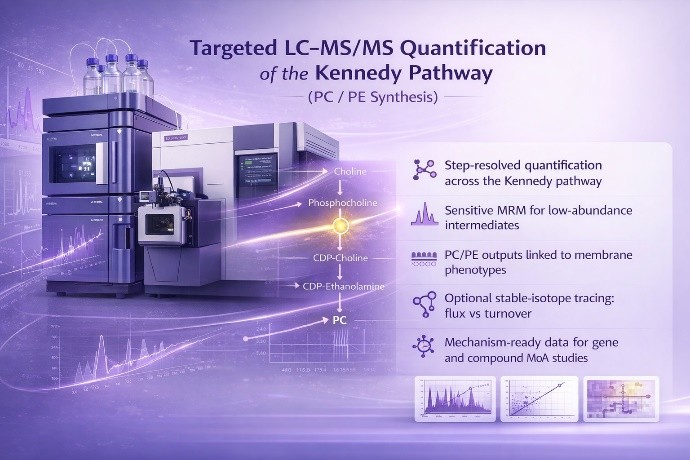
Why Quantify the Kennedy Pathway
Phosphatidylcholine (PC) and phosphatidylethanolamine (PE) are dominant membrane phospholipids, and the Kennedy pathway (CDP-choline / CDP-ethanolamine) is a primary synthesis route supplying them. In many mechanism studies, the critical question is not simply whether PC/PE changes, but what drives the change: precursor availability, a block at a specific step, altered DAG utilization, or increased remodeling/turnover.
By quantifying step-specific intermediates (e.g., phosphocholine, phosphoethanolamine, CDP-choline, CDP-ethanolamine) together with PC/PE outputs (and optional DAG and isotope tracing), this service helps you:
- Identify enzymatic rate-limiting steps and metabolic flux bottlenecks across the Kennedy architecture.
- Deconvolute the dynamics of steady-state shifts: distinguishing biosynthetic attenuation from accelerated phospholipolysis/remodeling.
- Explain membrane-driven phenotypes (ER/mitochondria/lipid droplets, stress responses) with quantitative evidence
- Validate gene/compound mechanisms of action using direct pathway readouts
- Track process/condition effects (media/nutrients/time-course) with reproducible metrics
Kennedy Pathway Analysis Service Modules & Quantification Options
Quantification Options
- Relative Quantification: best for screening, prioritization, and hypothesis generation
- Absolute Quantification: calibration-curve based concentration reporting with internal-standard correction (fit-for-purpose design based on analyte availability and matrix)
Options & Add-Ons
- DAG Readout (Substrate Pool): DAG class and/or species profiling to support Kennedy pathway interpretation
- Turnover/Remodeling Support: LPC/LPE (optional) and related phospholipid classes when needed
- Plasmalogen Extension: PE(P-)/PE(O-) panels for membrane/mitochondria-related projects
- Custom Panel Expansion: add or remove targets (e.g., GPC/GPE, nucleotides) to match your pathway hypothesis and sample matrix
Target List & Panel Coverage
Table 1. Polar Intermediates
| Branch |
Analytes (Targeted Quant) |
Notes |
| CDP-choline (PC synthesis) |
Choline; Betaine; Phosphocholine; CDP-choline (Citicoline); Cytidine; CMP; CTP; Glycerophosphocholine (GPC) |
Best for pinpointing bottlenecks (e.g., phosphocholine → CDP-choline) |
| CDP-ethanolamine (PE synthesis) |
Ethanolamine; Phosphoethanolamine; CDP-ethanolamine; Glycerophosphoethanolamine (GPE) |
Best for PE synthesis capacity and distinguishing Kennedy vs. PSD pathways. |
Table 2. PC/PE Lipid Species Panel
We report PC/PE as sum compositions (total carbons : total double bonds), which is standard for targeted phospholipid profiling.
| Lipid Class |
Species Coverage |
| Phosphatidylcholine (PC) |
PC(28:0), PC(28:1), PC(30:0), PC(30:1), PC(30:2),
PC(32:0), PC(32:1), PC(32:2), PC(32:3),
PC(34:0), PC(34:1), PC(34:2), PC(34:3), PC(34:4),
PC(36:0), PC(36:1), PC(36:2), PC(36:3), PC(36:4), PC(36:5), PC(36:6),
PC(38:0), PC(38:1), PC(38:2), PC(38:3), PC(38:4), PC(38:5), PC(38:6), PC(38:7), PC(38:8),
PC(40:0), PC(40:1), PC(40:2), PC(40:3), PC(40:4), PC(40:5), PC(40:6), PC(40:7), PC(40:8),
PC(42:0), PC(42:1), PC(42:2), PC(42:3), PC(42:4), PC(42:5), PC(42:6), PC(42:7), PC(42:8),
PC(44:0), PC(44:1), PC(44:2), PC(44:3), PC(44:4), PC(44:5), PC(44:6), PC(44:7), PC(44:8), PC(44:9), PC(44:10), PC(44:11), PC(44:12) |
| Phosphatidylethanolamine (PE) |
PE(30:0), PE(30:1), PE(30:2),
PE(32:0), PE(32:1), PE(32:2), PE(32:3),
PE(34:0), PE(34:1), PE(34:2), PE(34:3), PE(34:4),
PE(36:0), PE(36:1), PE(36:2), PE(36:3), PE(36:4), PE(36:5), PE(36:6),
PE(38:0), PE(38:1), PE(38:2), PE(38:3), PE(38:4), PE(38:5), PE(38:6), PE(38:7), PE(38:8),
PE(40:0), PE(40:1), PE(40:2), PE(40:3), PE(40:4), PE(40:5), PE(40:6), PE(40:7), PE(40:8),
PE(42:0), PE(42:1), PE(42:2), PE(42:3), PE(42:4), PE(42:5), PE(42:6), PE(42:7), PE(42:8),
PE(44:0), PE(44:1), PE(44:2), PE(44:3), PE(44:4), PE(44:5), PE(44:6), PE(44:7), PE(44:8), PE(44:9), PE(44:10), PE(44:11), PE(44:12) |
Optional lipid add-ons (common in ER/mitochondria projects):
- PE plasmalogens: PE(P-) / PE(O-) (panelized by sum composition)
- DAG species (sum composition set)
- LPC/LPE species panel
Advantages of Kennedy Pathway Metabolites Analysis Service
- Up to 10⁶ linear dynamic range for targeted quantification
Modern tandem quadrupole systems commonly specify six orders of linear dynamic range for quantitative MRM/SRM workflows.
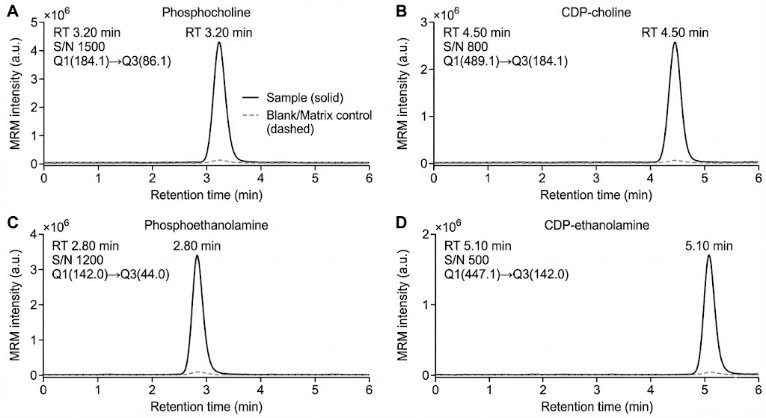
- High-sensitivity MRM suited for low-abundance intermediates
Example capability (platform spec): QTRAP 6500+ reports 1 pg on-column reserpine at S/N > 1,500,000 in positive MRM.
- High-speed scheduled MRM ensuring >15 data points per peak even for dense panels
Example capability: TSQ Altis class performance notes up to ~600 SRMs/sec, supporting robust scheduled MRM methods.
- Flux-ready option for mechanism clarity
Stable-isotope tracing provides isotopologue distributions and label incorporation to interpret pathway activity rather than only steady-state abundance.
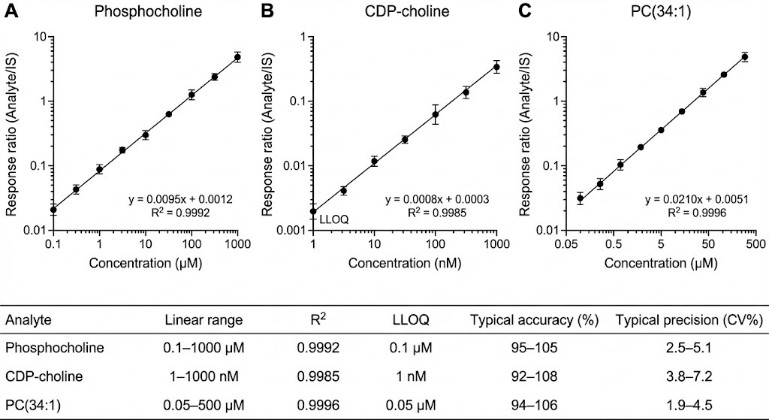
- Fit-for-purpose quantitation (absolute or relative)
Choose absolute quantification (calibration curve-based) when cross-study comparability is needed, or relative quantification for screening/priority setting.
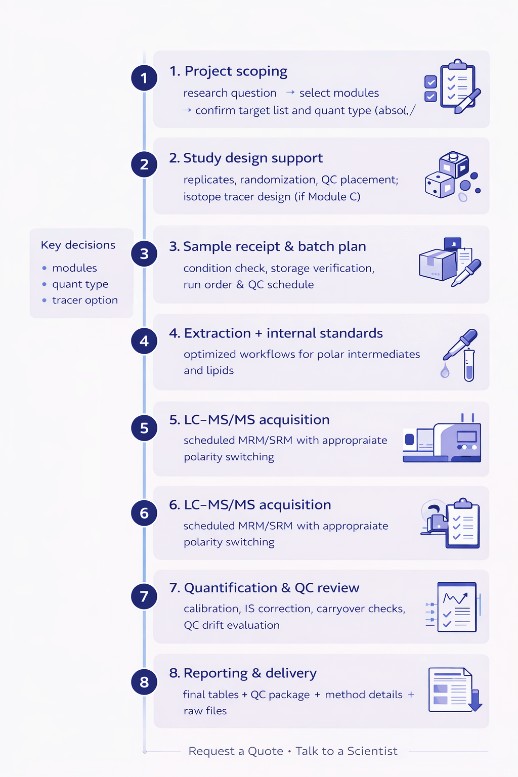
Workflow for Kennedy Pathway Metabolites Panel Analysis
Analytical Platform (LC–MS/MS) & Key Parameter
Primary Platform
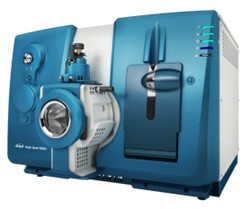
Triple Quadrupole LC–MS/MS for targeted quantification (MRM/SRM): SCIEX QTRAP 6500+ (Scheduled MRM / MRM)
- Mass range: m/z 5–2000
- Polarity switching: ~5 ms
- Minimum dwell time: 1 ms
- High-throughput targeted acquisition suitable for dense panels (scheduled MRM)
Chromatography Setups (Representative)
- Polar intermediates (Module A): HILIC LC method with positive/negative switching as needed
- PC/PE lipids (Module B): UPLC–C18 method optimized for phospholipids
Exact column chemistries, gradients, and run times are finalized after we confirm your sample matrix and throughput goals.
Optional (Upon Request)
If your study requires additional confirmation or expanded profiling, we can discuss alternative LC–MS configurations (e.g., high-resolution MS) based on project goals and sample matrix.
Sample Requirements for Kennedy Pathway Quantification
| Sample Type |
Minimum Amount (per sample) |
Recommended Amount (per sample) |
Accepted Format |
Storage |
Shipping |
Key Notes |
| Cultured cells (pellet) |
0.5 × 10^6 cells |
1–5 × 10⁶ cells |
Cell pellet in tube (no media) |
−80°C |
Dry ice |
Wash with cold PBS; remove supernatant completely; avoid repeated freeze–thaw |
| Tissue |
10 mg |
20–50 mg |
Snap-frozen tissue piece |
−80°C |
Dry ice |
Minimize handling time; record wet weight; avoid thawing during aliquoting |
| Plasma / Serum (research) |
30 µL |
50–100 µL |
Aliquoted liquid in screw-cap tube |
−80°C |
Dry ice |
Avoid hemolysis; use low-bind tubes if possible; avoid >1 freeze–thaw cycle |
| Culture medium / supernatant |
100 µL |
200–500 µL |
Clarified supernatant (optional spin) |
−80°C |
Dry ice |
Provide medium blank if available; record time point and cell count/viability |
| Isotope tracing samples (optional) |
Same as above |
Same as above |
Same as above |
−80°C |
Dry ice |
Provide tracer identity, labeling duration, media formulation, and time points |
General recommendations
- Biological replicates: ≥ 3 per group (more recommended for subtle effects)
- Packaging: Seal tubes with parafilm; place in secondary sealed bag; include sample manifest (ID, matrix, group, volume/mass, storage history)
- Stability: Keep samples frozen at all times; avoid thaw/refreeze cycles
What You Receive (Deliverables)
Quantification results table (CSV/XLSX)
- Absolute concentrations (if absolute quant is selected) or normalized relative abundances
- Unit options: pmol/mg tissue, pmol/10^6 cells, µM, etc. (as appropriate)
QC & Batch Performance Report (PDF)
- Internal standard performance
- Calibration curve summary (range, regression type, R², back-calculation residuals)
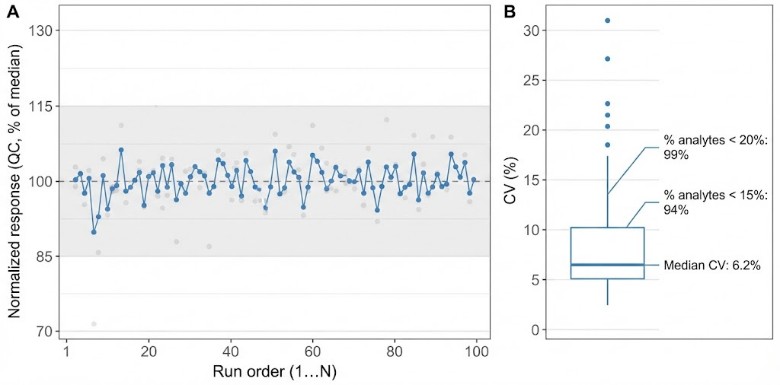
- QC sample CVs and batch drift checks (when QC pools are provided/created)
Peak evidence package
- Representative chromatograms for key analytes
- Peak integration snapshots for flagged features (e.g., low S/N, interference)
Method summary (PDF)
- Extraction outline, LC conditions, MRM/SRM transition list (or PRM list), instrument settings, polarity switching setup
Raw data files
- Vendor formats (e.g., .wiff / .raw) + sequence list
- Processed peak area tables (pre- and post-IS correction)
(If Module C) Isotope tracing outputs
- Isotopologue distributions (M+0…M+n)
- Label incorporation rate summaries and tracer-specific notes
Research Applications: Kennedy Pathway PC/PE Synthesis Quantification
Phosphate Limitation Drives Phospholipid Remodeling in a Host–Symbiont System
Background
Reef-building cnidarians rely on intracellular photosynthetic symbionts, and maintaining a stable symbiosis requires tight coordination of host and algal cell division. While nitrogen control has been widely discussed, this study tested whether phosphate availability can act as a key regulator—linking nutrient status to membrane phospholipid pools and, ultimately, symbiont proliferation.
Samples:
- Symbionts grown in culture under phosphate-replete vs phosphate-depleted conditions
- Freshly isolated symbionts from the host for comparison to in vitro states
Technical Methods (Study Summary)
- Phosphate status characterization comparing in-host vs in vitro conditions
- Transcriptomics (RNA-seq) to evaluate phosphate-responsive programs
- Lipid profiling to assess membrane lipid changes under phosphate limitation
Results
- Freshly isolated symbionts exhibited a phosphate-limited state comparable to phosphate-starved cultures.
- Phosphate limitation was associated with broad lipid changes, including reduced phospholipid abundance, supporting a nutrient-to-membrane link in symbiont cell division control.
How Our Service Supports Similar Projects
Studies like this often identify "phospholipids change" as a key signature, but mechanism interpretation benefits from step-resolved quantification and species-level readouts. Our Kennedy Pathway Metabolites Quantification (Targeted LC–MS/MS) can be used to strengthen conclusions by addressing:
- Which synthesis branch is constrained?
Polar Intermediates quantifies pathway intermediates such as phosphocholine / CDP-choline and phosphoethanolamine / CDP-ethanolamine, enabling bottleneck localization (precursor limitation vs CDP-activation step constraints).
- Which membrane outputs shift?
PC/PE Outputs quantifies PC/PE species (sum composition; optional MS/MS-confirmed species) to reveal how membrane composition changes under phosphate limitation.
- Is the change reduced synthesis or increased turnover?
Optional Stable-Isotope Tracing provides isotopologue/label incorporation outputs to separate flux reduction from remodeling/turnover-driven differences (fit for time-course or nutrient-shift experiments).
Reference
- Faulstich, N. G., et al. "Evidence for phosphate-dependent control of symbiont cell division in the model anemone Exaiptasia diaphana." mBio (2024).
Annexin A2 modulates phospholipid membrane composition upstream of Arp2 to control angiogenic sprout initiation
Sveeggen, T. M., Abbey, C. A., Smith, R. L., Salinas, M. L., Chapkin, R. S., & Bayless, K. J.
Journal: The FASEB Journal
Year: 2023
DOI: https://doi.org/10.1096/fj.202201088R
Loss of G0/G1 switch gene 2 (G0S2) promotes disease progression and drug resistance in chronic myeloid leukaemia (CML) by disrupting glycerophospholipid metabolism
Gonzalez, M. A., Olivas, I. M., Bencomo‐Alvarez, A. E., Rubio, A. J., Barreto‐Vargas, C., Lopez, J. L., ... & Eiring, A. M.
Journal: Clinical and Translational Medicine
Year: 2022
DOI: https://doi.org/10.1002/ctm2.1146
Evidence for phosphate-dependent control of symbiont cell division in the model anemone Exaiptasia diaphana
Faulstich, N. G., Deloach, A. R., Ksor, Y. B., Mesa, G. H., Sharma, D. S., Sisk, S. L., & Mitchell, G. C.
Journal: mBio
Year: 2024
DOI: https://doi.org/10.1128/mbio.01059-24