Background & Why Analyze Uremic Toxins
Protein-Bound Uremic Toxins (PBUTs): Why targeted quantification matters
PBUTs and related uremic solutes often show:
- Strong matrix effects (serum/plasma/urine/dialysate vary widely).
- Protein binding (total concentration may not reflect the diffusible portion).
- Broad dynamic range across subjects, timepoints, and interventions.
What problems we solve (research & industrial R&D)
- Convert relative signals into traceable absolute concentrations (μM / ng/mL) for robust statistics, modeling, and reporting.
- Support Free vs Total PBUTs study designs to quantify protein-binding effects and to compute Free fraction (%).
- Provide batch QA/QC documentation so your quantitative conclusions are reproducible and defensible across large studies.
What We Offer: Uremic Toxins Targeted Quantification Services
Core Quantification
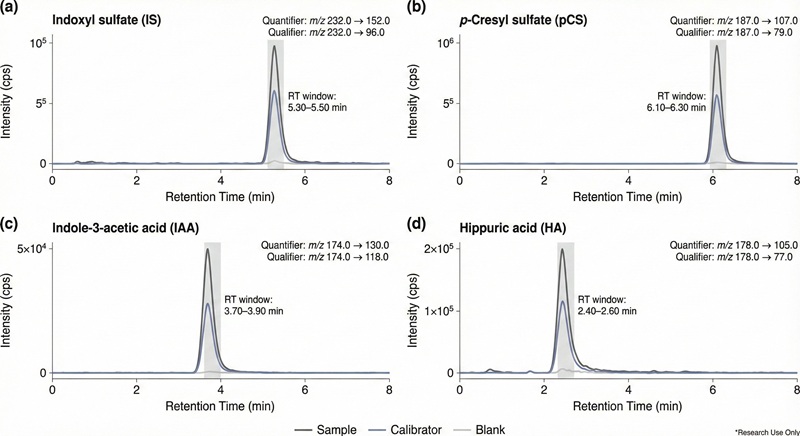
Absolute quantification of key uremic toxins, including indoxyl sulfate, p-cresyl sulfate, and IAA, using LC-MS/MS (MRM).
Delivered as structured panel output with concentration values (μM or ng/mL), LOQ-aware flags, and batch-level QA/QC.
Customizable Panels
Extendable to include gut-derived aromatic acids, conjugated metabolites, and co-factors (e.g., hippuric acid, phenyl sulfate, ADMA, TMAO). Feasibility assessed based on matrix, target list, and expected range
Optional Modules
- Free vs Total quantification: Includes free concentration, total concentration, and Free fraction (%)
- Extended dynamic range or high-sensitivity setup for low-abundance targets
- Cross-batch harmonization for longitudinal or multi-cohort projects
Detectable Analytes: Uremic Toxins Panel List
Final panel can be Core only or Core + Extensions, and is customizable based on your study and matrix.
| Category |
Analytes Included |
Default Tier |
| Core PBUTs |
Indoxyl sulfate (IS); p-Cresyl sulfate (pCS); Indole-3-acetic acid (IAA) |
Core |
| Gut-derived aromatic acids & related uremic solutes |
Hippuric acid; Phenylacetic acid (PAA); Phenylacetylglutamine (PAGln); Phenyl sulfate; 4-Hydroxyphenylacetic acid (4-HPAA); 4-Hydroxybenzoic acid (4-HBA); Benzoic acid; p-Cresol (handling-dependent); Indole-3-propionic acid (IPA); Indole-3-lactic acid (ILA); Indole-3-carboxylic acid (ICA); Skatole (3-methylindole) (feasibility-dependent) |
Optional |
| Conjugated indoles/phenols |
Indoxyl glucuronide (IG); p-Cresyl glucuronide (pCG) |
On request (standards/IS-dependent) |
| Methylarginines & nitrogen-handling context |
ADMA; SDMA; Arginine; Citrulline; Ornithine (study-driven) |
Optional |
| Tryptophan–kynurenine pathway |
Tryptophan (Trp); Kynurenine (Kyn); Kynurenic acid (KA); Quinolinic acid (QA); Xanthurenic acid (XA); 3-Hydroxykynurenine (3-HK) (stability/handling assessed) |
Optional / On request |
| Related "uremic milieu" co-readouts |
Trimethylamine N-oxide (TMAO); Choline; Betaine; Carnitine (optional metabolic context) |
Optional |
Custom list welcome: If your target analytes are not listed, send the list + matrix + expected range. We will confirm feasibility and propose an optimized panel.
Quantitative Performance & Data Quality Highlights
- Absolute concentration outputs (μM / ng/mL) with LOQ-aware flags suitable for statistics and modeling.
- Selectivity for closely related metabolites via MRM transitions (quantifier + qualifier) and retention-time checks.
- Typical precision targets: intra-/inter-batch CV commonly ≤15% (low-level points may be ≤20%; matrix/analyte dependent).
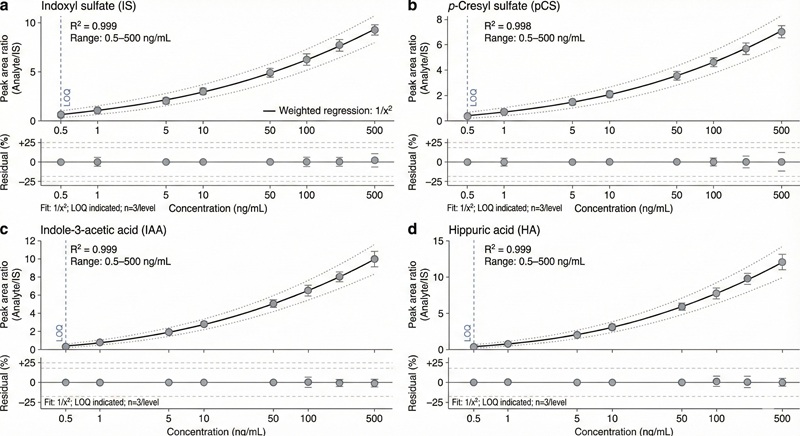
- Typical calibration performance targets: weighted regression with R² ≥ 0.99 (panel- and matrix-dependent).
- Dynamic range built for cohort studies: commonly 2–4 orders of magnitude depending on analyte and matrix.
- Optional Free vs Total PBUTs: outputs Free, Total, and Free fraction (%) for PBUT-focused designs.
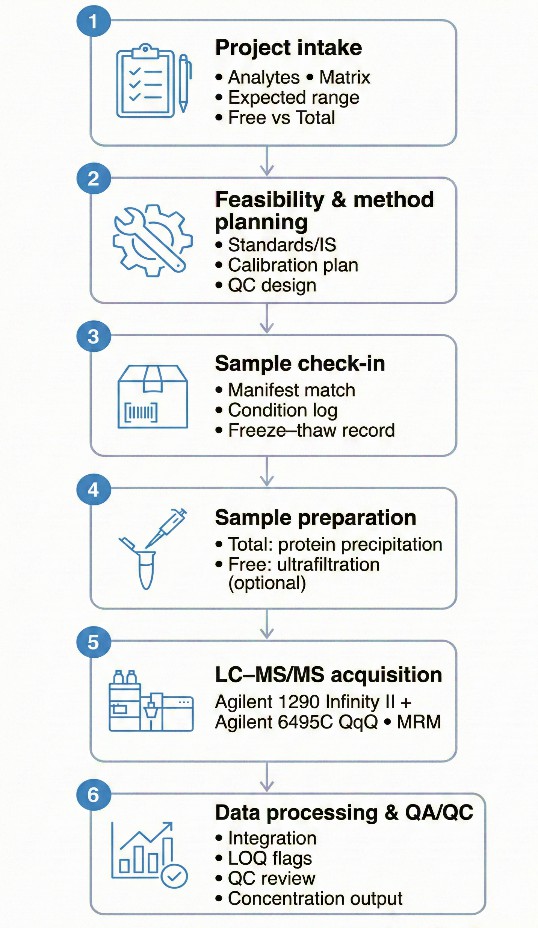
Analytical Workflow for Targeted Uremic Toxins Analysis
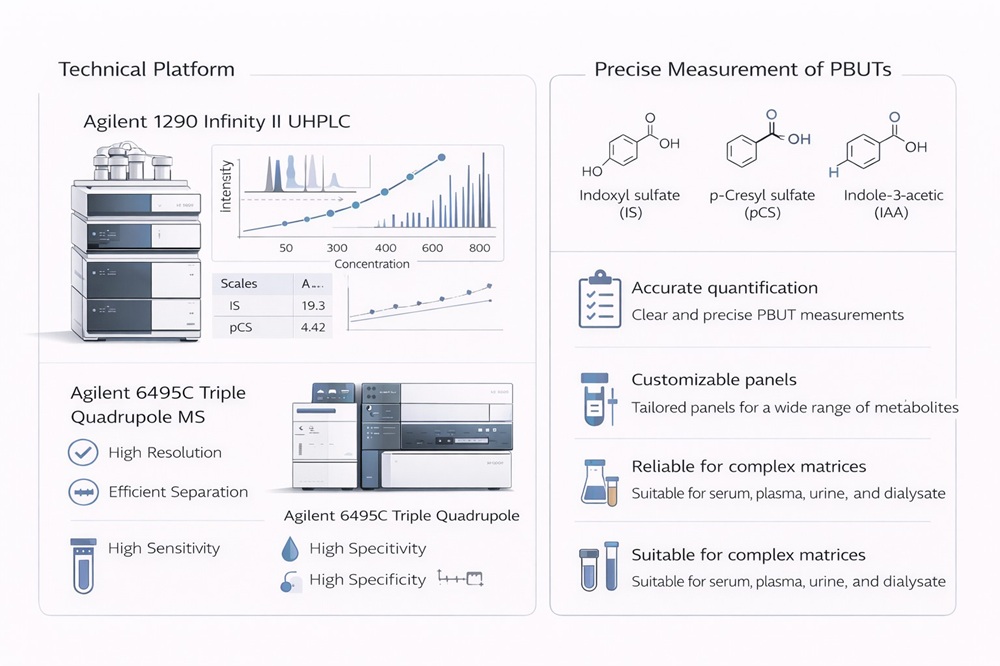
Analytical Platforms for PBUTs / Uremic Toxins Quantification
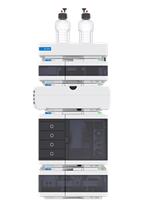
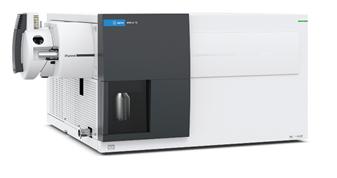
Our PBUTs panel analysis is performed on an Agilent 1290 Infinity II UHPLC system coupled with an Agilent 6495C Triple Quadrupole Mass Spectrometer, optimized for high-sensitivity targeted quantification in complex matrices (e.g., plasma, serum, urine, dialysate).
Key Instrument Parameters
| Component |
Parameter |
Specification (Typical) |
| UHPLC |
Column |
C18, 2.1 mm × 100 mm, 1.8 μm |
| Flow rate |
0.3–0.5 mL/min |
| Run time |
8–15 min/sample |
| Mobile phase |
Water / acetonitrile with 0.1% formic acid or ammonium buffer (panel-dependent) |
| MS/MS |
Ion source |
ESI (+/− mode, compound-dependent) |
| Acquisition mode |
MRM (quantifier + qualifier) |
| Dwell time |
5–25 ms per transition |
| Cycle time |
0.3–1.0 s (≥10–12 points/peak) |
| Mass range |
m/z 50–1000 |
Instrument configuration ensures accurate detection of low-abundance PBUTs with minimized matrix interference and high reproducibility.
Sample Types & Submission Requirements
We accept the following sample types for PBUTs and related uremic solutes quantification:
| Sample Type |
Recommended Volume |
Container |
Notes |
Storage |
Shipping |
| Serum |
100–200 µL |
1.5–2.0 mL screw-cap tube |
Avoid hemolysis; aliquot to minimize freeze–thaw cycles |
−80 °C |
Dry ice |
| Plasma |
150–300 µL |
Screw-cap tube |
Use consistent anticoagulant across samples (e.g., EDTA or Heparin) |
−80 °C |
Dry ice |
| Urine |
200–500 µL |
Screw-cap tube |
Mix well before aliquoting; indicate collection type (e.g., spot, 24 h) |
−80 °C |
Dry ice |
| Dialysate |
300–500 µL |
Screw-cap tube |
Record collection timepoints and dialysis conditions |
−80 °C |
Dry ice |
Additional Notes:
- Limit freeze–thaw cycles to ≤2
- Provide a complete sample manifest: sample ID, matrix, volume, group, collection timepoint
- Animal samples (e.g., rat/mouse plasma, urine) are accepted upon request
- Fecal samples may be accepted for specific precursor analysis — contact us for feasibility evaluation
Deliverables: Quantitative Data Package and QC Report
- Quantification results table (Excel/CSV): absolute concentrations (μM and/or ng/mL) per analyte per sample + LOQ flags.
- Free/Total table (Excel/CSV, if selected): Free, Total, and Free fraction (%).
- Batch QC report (PDF): calibration summary + QC performance + carryover check.
- Peak integration export (Excel/CSV): RT, transitions, peak areas/ratios, integration flags.
- MRM transition list (Excel/PDF): quantifier/qualifier transitions + RT windows.
- Sample receipt log (Excel/PDF): manifest check + condition notes.
- Raw data files (on request): vendor raw ± mzML.
- Methods summary (PDF): prep overview + key parameters + LOQ rules.
Applications in PBUTs and Uremic Toxin Quantification Research
MS-CETSA functional proteomics uncovers new DNA-repair programs leading to Gemcitabine resistance
Nordlund, P., Liang, Y. Y., Khalid, K., Van Le, H., Teo, H. M., Raitelaitis, M., ... & Prabhu, N.
Journal: Research Square
Year: 2024
DOI: https://doi.org/10.21203/rs.3.rs-4820265/v1
Service: Nucleotide quantification by LC-MRM/MS
Multiomics of a rice population identifies genes and genomic regions that bestow low glycemic index and high protein content
Badoni, S., Pasion-Uy, E. A., Kor, S., Kim, S. R., Tiozon Jr, R. N., Misra, G., ... & Sreenivasulu, N.
Journal: Proceedings of the National Academy of Sciences
Year: 2024
DOI: https://doi.org/10.1073/pnas.2410598121
Service: Untargeted metabolomics
High Levels of Oxidative Stress Early after HSCT Are Associated with Later Adverse Outcomes
Cook, E., Langenberg, L., Luebbering, N., Ibrahimova, A., Sabulski, A., Lake, K. E., ... & Davies, S. M.
Journal: Transplantation and Cellular Therapy
Year: 2024
DOI: https://doi.org/10.1016/j.jtct.2023.12.096
Service: GSH and GSSG were quantified by mass spectrometry
The Brain Metabolome Is Modified by Obesity in a Sex-Dependent Manner
Norman, J. E., Milenkovic, D., Nuthikattu, S., & Villablanca, A. C.
Journal: International Journal of Molecular Sciences
Year: 2024
DOI: https://doi.org/10.3390/ijms25063475
Service: Untargeted metabolomics analyses were performed by LC-MS
UDP-Glucose/P2Y14 Receptor Signaling Exacerbates Neuronal Apoptosis After Subarachnoid Hemorrhage in Rats
Kanamaru, H., Zhu, S., Dong, S., Takemoto, Y., Huang, L., Sherchan, P., ... & Zhang, J. H.
Journal: Stroke
Year: 2024
DOI: https://doi.org/10.1161/STROKEAHA.123.044422
Service: UDP-G Measurement Cerebrospinal fluid (CSF) samples liquid chromatography-mass spectrometry analyses