What is Longitudinal Multi-Omics?
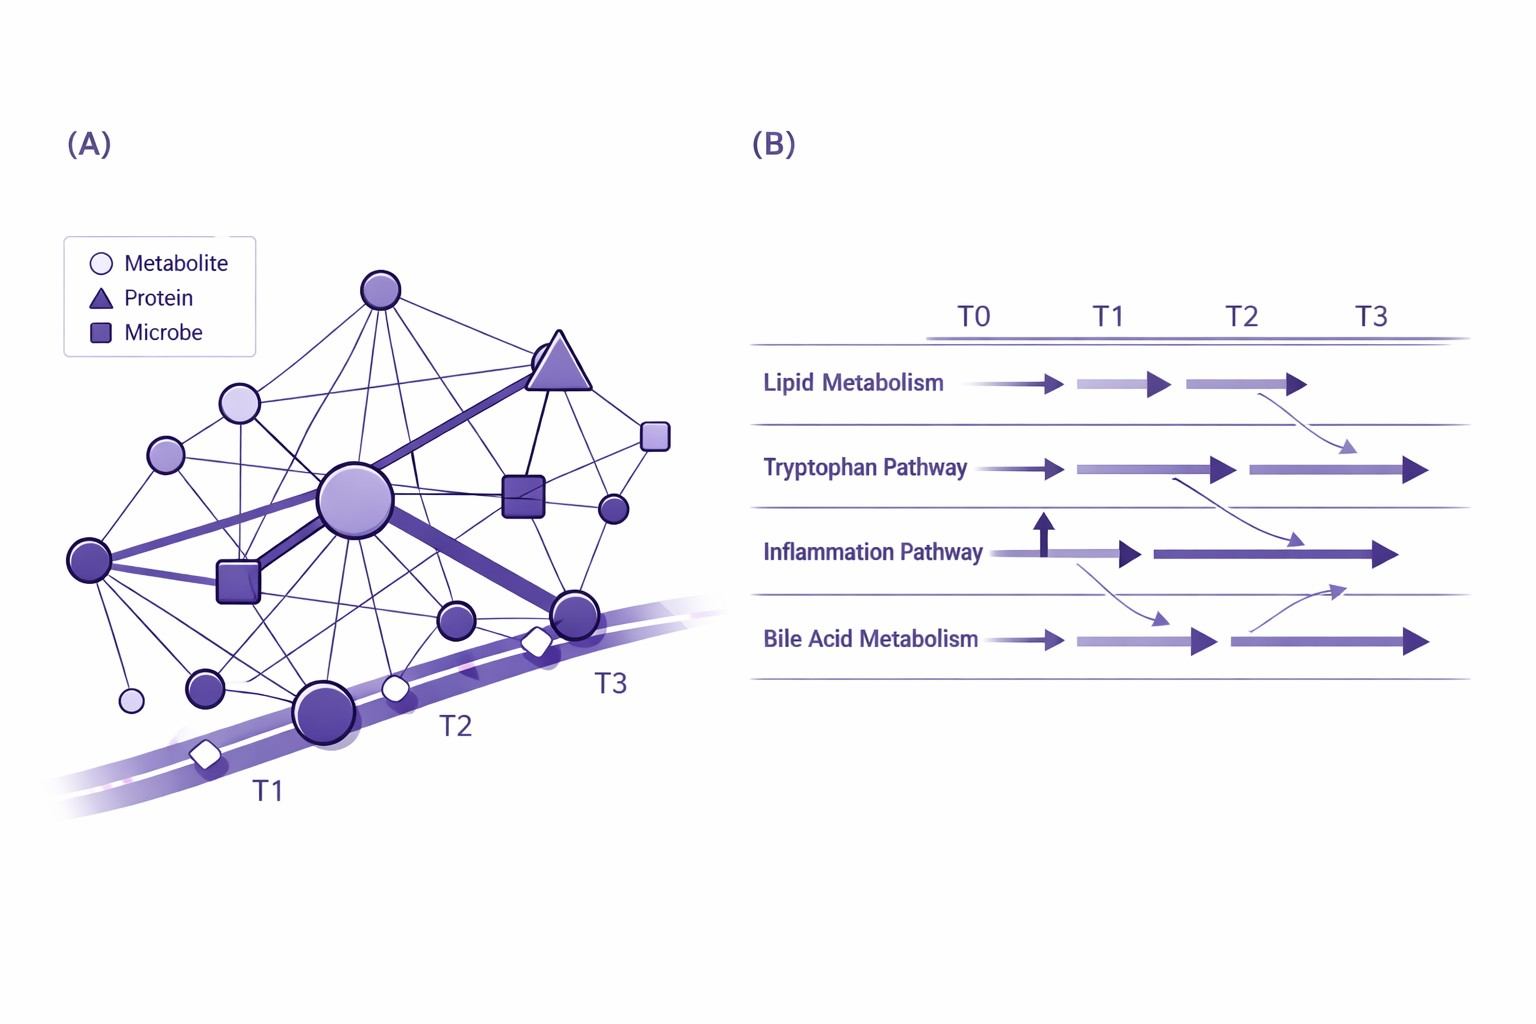
Longitudinal multi-omics is a systems biology approach that profiles multiple molecular layers (e.g., proteome, metabolome, microbiome) from the same individuals across multiple time points. Unlike cross-sectional studies that provide a single snapshot, longitudinal profiling captures within-individual temporal change, enabling detection of time-ordered molecular variation, identification of co-moving pathways, and exploration of microbiome–host coupling dynamics over time.
Importantly, longitudinal association patterns can suggest directionality-informed hypotheses (e.g., microbial changes preceding metabolite shifts), but they do not constitute proof of causation. Results are intended for research interpretation and downstream validation studies.
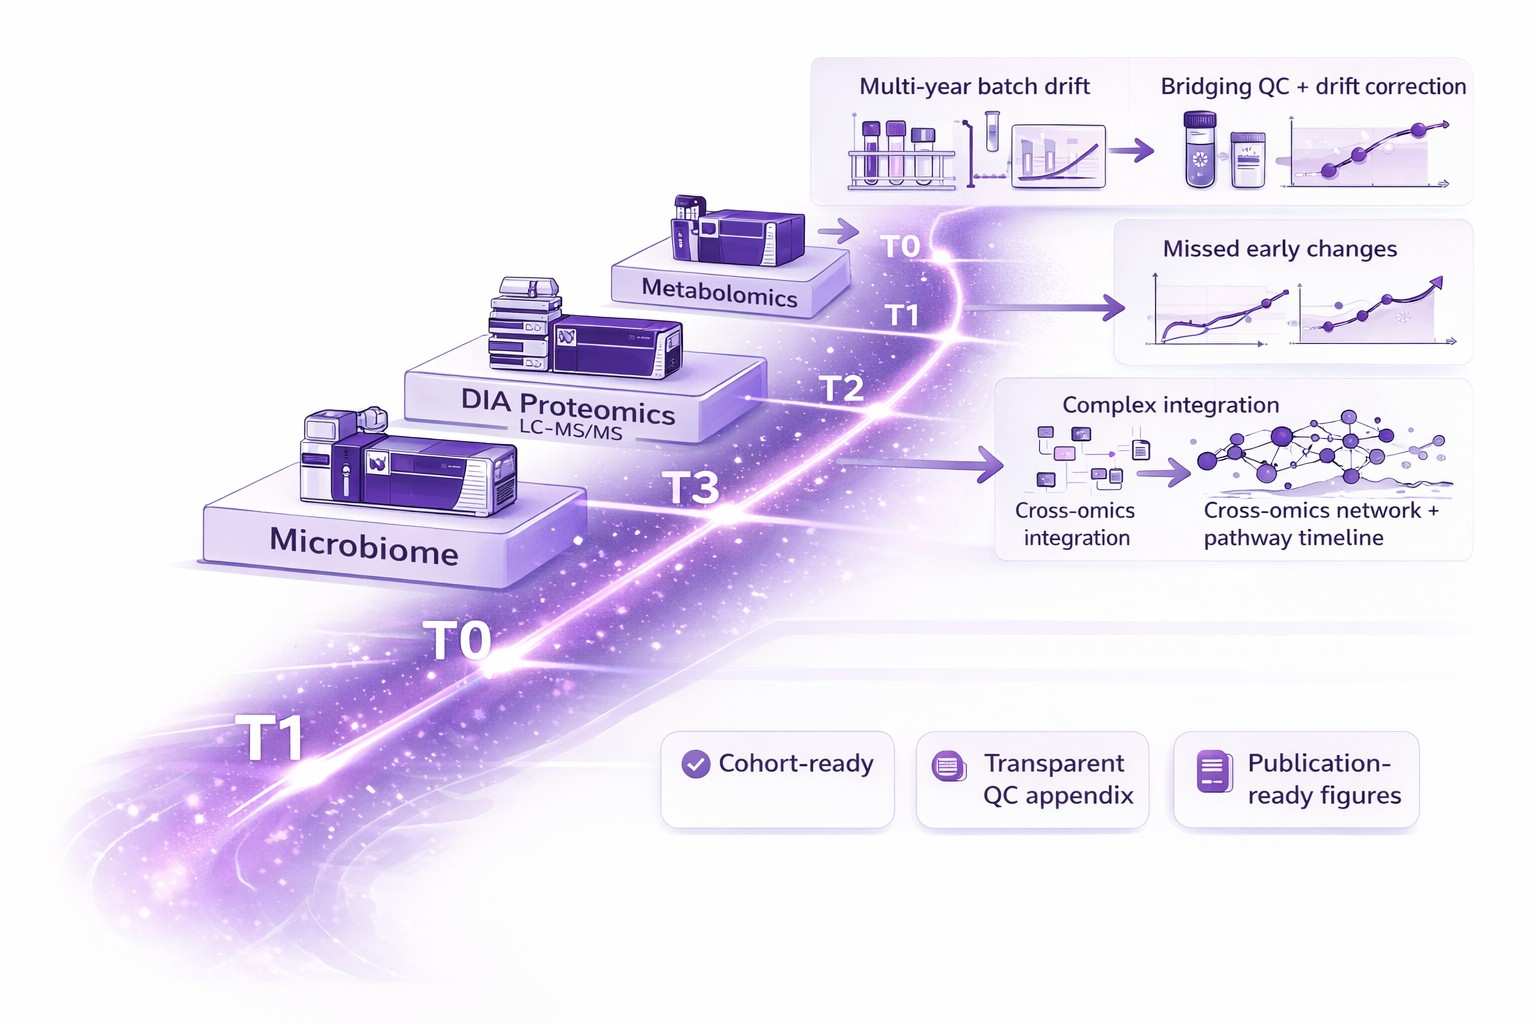
Problems We Can Solve
Longitudinal cohorts face unique technical and analytical hurdles. We convert these challenges into reproducible discovery workflows:
Service Scope and Study Options for Longitudinal Cohorts
We provide modular, cohort-ready services for repeated-measures time-series studies. Choose the track aligned with your primary scientific objective; tracks can be combined as needed.
Track 1 — Longitudinal Metabolomics (Time-Series Phenotyping)
Best for: large cohorts, multiple time points, temporal pattern discovery, intervention-response research designs.
- Metabolomics profiling across time points: untargeted discovery and/or targeted panels for consistent tracking.
- Longitudinal comparability support: study-pool QC + bridging references + drift monitoring/correction.
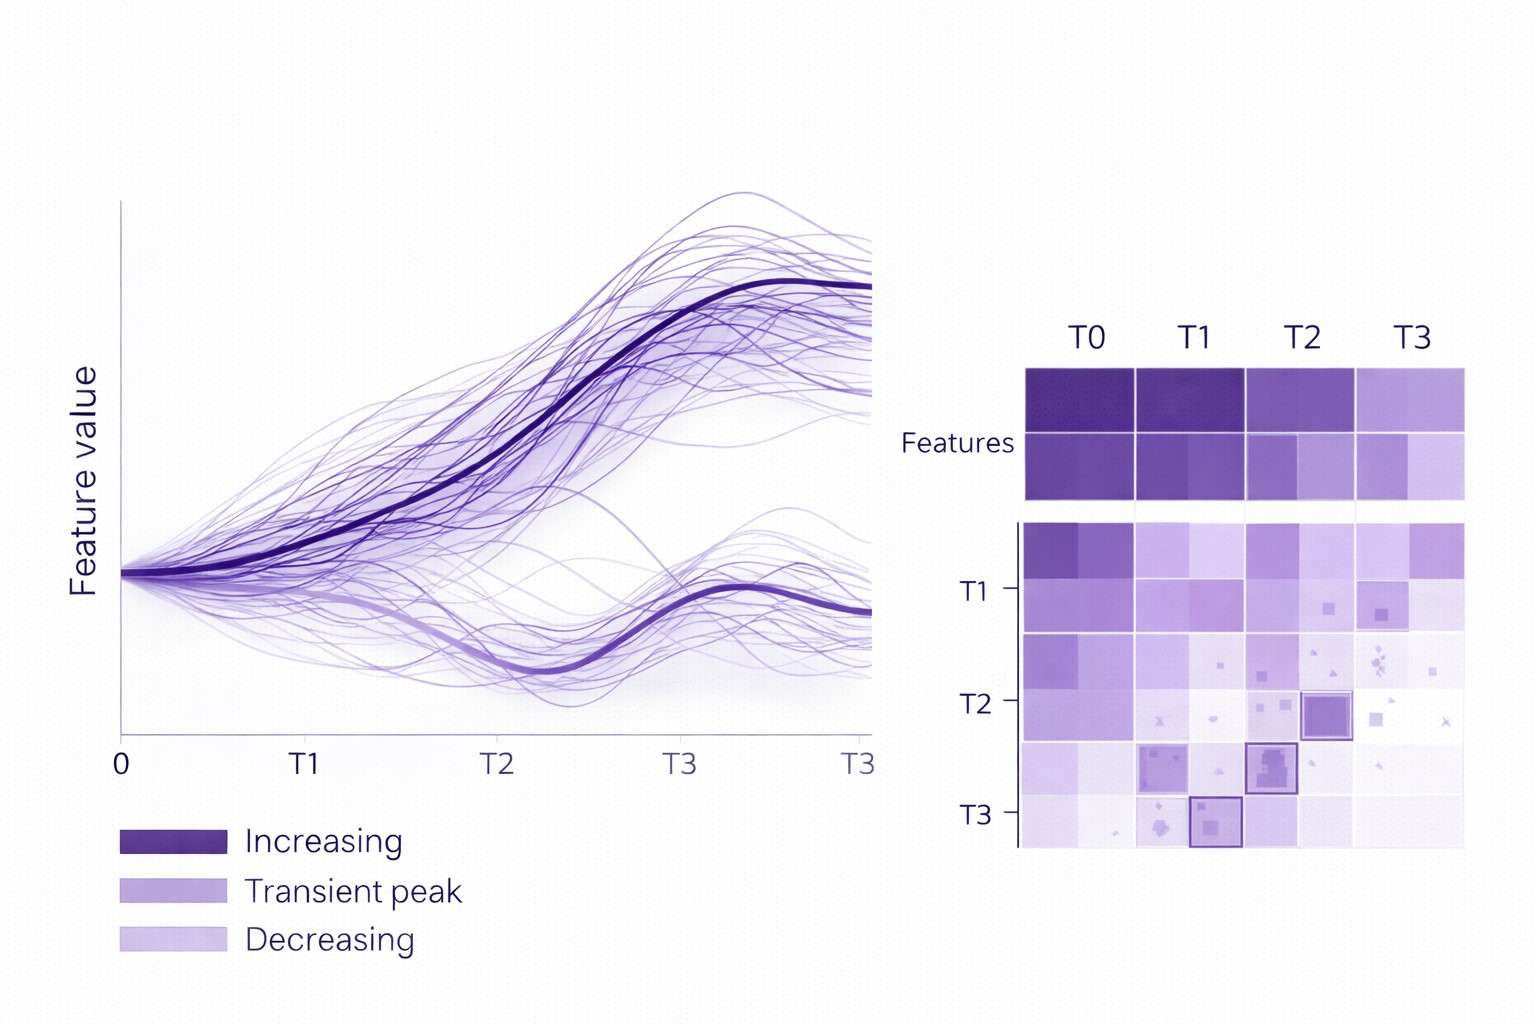
- Time-series analysis outputs: trends, turning-point candidates, subgroup trajectories.
- Typical matrices: plasma/serum/urine (feces optional).
- Recommended time points: ≥3 (2 supports pre/post analysis).
Track 2 — Host Biology Longitudinal Multi-Omics (Proteome + Metabolome)
Best for: host pathway interpretation, immune-metabolic research, longitudinal response profiling.
- DIA proteomics time-series profiling: high-coverage protein quantification with DIA acquisition.
- Metabolomics time-series profiling: untargeted and/or targeted.
- Cross-omics integration: protein–metabolite covariation, pathway timeline summaries, key-axis shortlists.
- Longitudinal QC package: pre/post harmonization diagnostics for multi-batch studies.
- Typical matrices: plasma/serum/urine.
- Recommended time points: ≥3.
Track 3 — Microbiome–Host Longitudinal Multi-Omics (Microbiome + Metabolome ± Proteome)
Best for: microbiome-driven hypotheses, diet/probiotic/antibiotic research designs, host–microbe coupling exploration.
- Microbiome profiling: 16S rRNA sequencing or shotgun metagenomics across time points.
- Metabolomics profiling: plasma/serum/urine and/or feces (study-design dependent).
- Optional proteomics layer: for deeper host mechanism context.
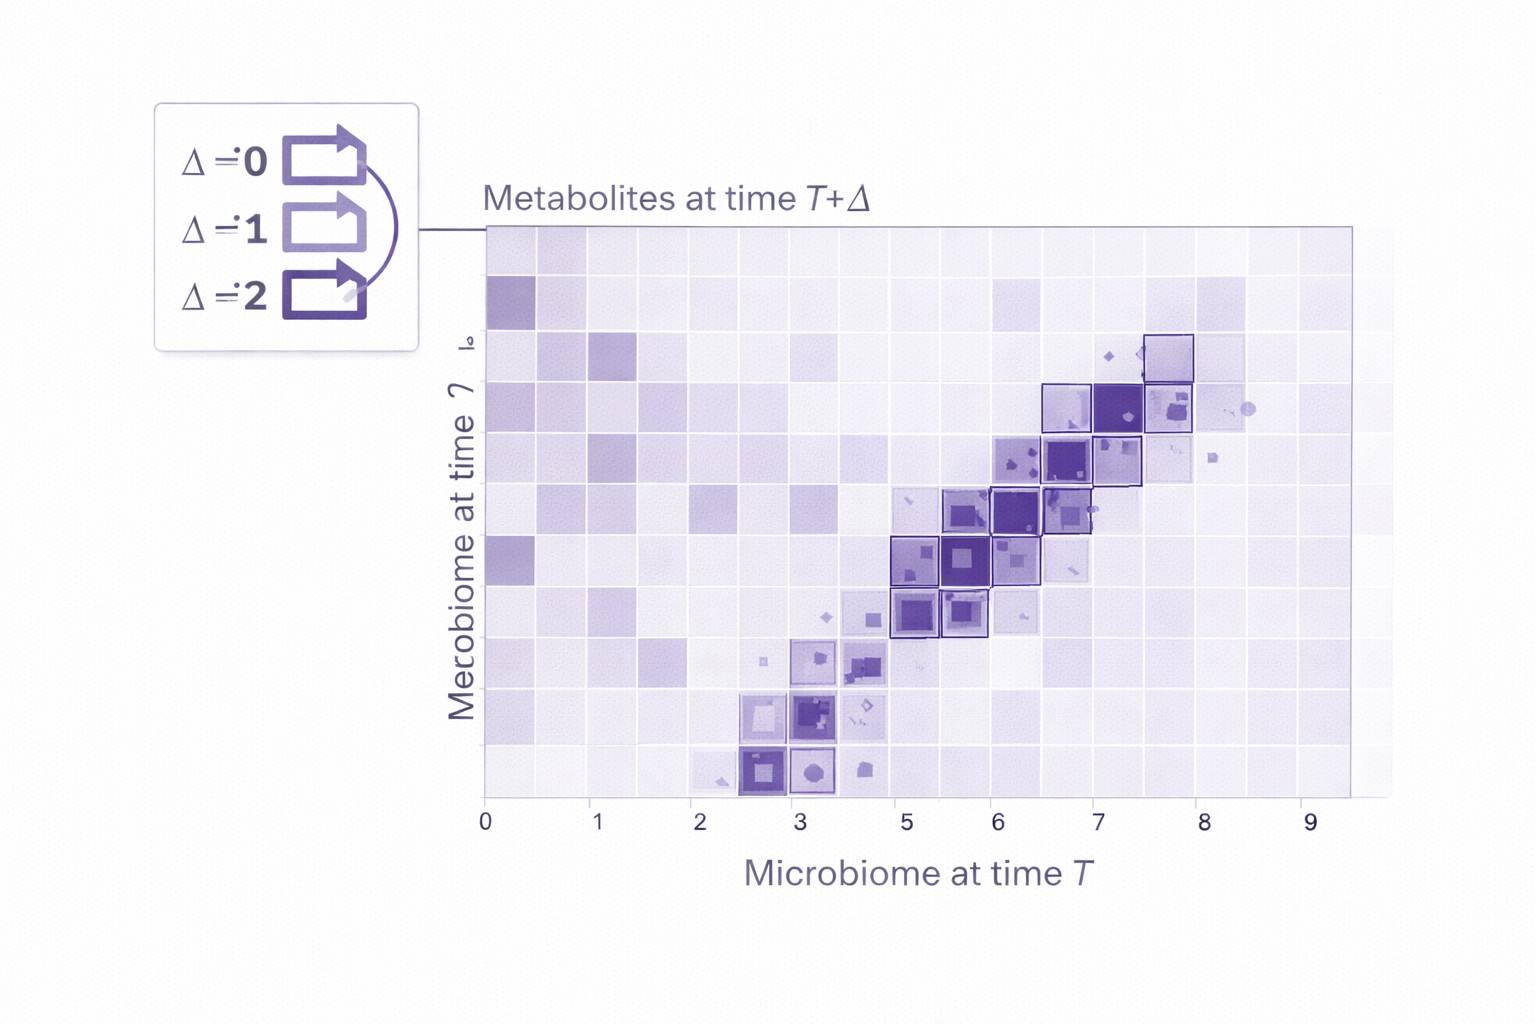
- Integration outputs: cross-omics associations (optionally with time-lag exploration), networks, hub features, and pathway summaries.
- Typical matrices: stool + plasma/serum (urine optional).
- Recommended time points: ≥3.
Included in Every Track (Baseline Service Components)
- Study design input: time-point structure, matrix selection, metadata checklist, and confounder planning guidance (research context).
- Longitudinal QC architecture: study-pool QC, bridging references, drift monitoring/correction, and QC evidence reporting.
- Time-series analytics core: trajectories/trends, subgrouping, cross-omics associations, and pathway/network interpretation.
- Reproducible delivery package: normalized matrices, QC appendix, and methods documentation.
Analyte Coverage and Typical Depth
Coverage varies by matrix, cohort design, and depth settings. Typical ranges below are commonly observed for biofluids (plasma/serum) under standard configurations.
| Omics Layer |
Technology |
Typical Coverage (Approx.) |
Key Analyte Classes |
| Proteomics |
DIA LC-MS/MS |
~1,000–4,000 proteins |
Inflammation/immune proteins, enzymes, signaling, transporters |
| Metabolomics (Targeted) |
Triple Quad (e.g., QTRAP) |
~200–650 metabolites (panel-dependent) |
Amino acids, bile acids, SCFAs, indoles, nucleotides |
| Metabolomics (Untargeted) |
Orbitrap HRAM |
~1,000–3,000 features |
Broad small-molecule coverage (polar & non-polar) |
| Lipidomics |
LC-MS/MS |
~300–800+ lipid species |
PC, PE, TG, DG, Cer, SM, FFAs |
| Microbiome |
16S or Shotgun NGS |
16S: genus-level (often) / Shotgun: species-level + functional genes |
Taxonomy + functional potential (pipeline/depth-dependent) |
Why Choose Our Longitudinal Multi-Omics Service
- Experienced multi-omics operations: Established workflows for complex cohort biospecimens and multi-layer integration (RUO).
- Longitudinal QC-first design: Acceptance criteria are defined per platform/matrix; typical targets include pooled-QC reproducibility (e.g., median RSD around ≤20% where feasible) with transparent reporting of batch behavior.
- End-to-end pipeline: From sample handling guidance to analytics and interpretation—reducing cross-vendor variability and handoff risk.
- Deep longitudinal analytics: Trajectory clustering, time-lag exploration, and network/pathway interpretation to contextualize "what changes with time" and "what changes together."
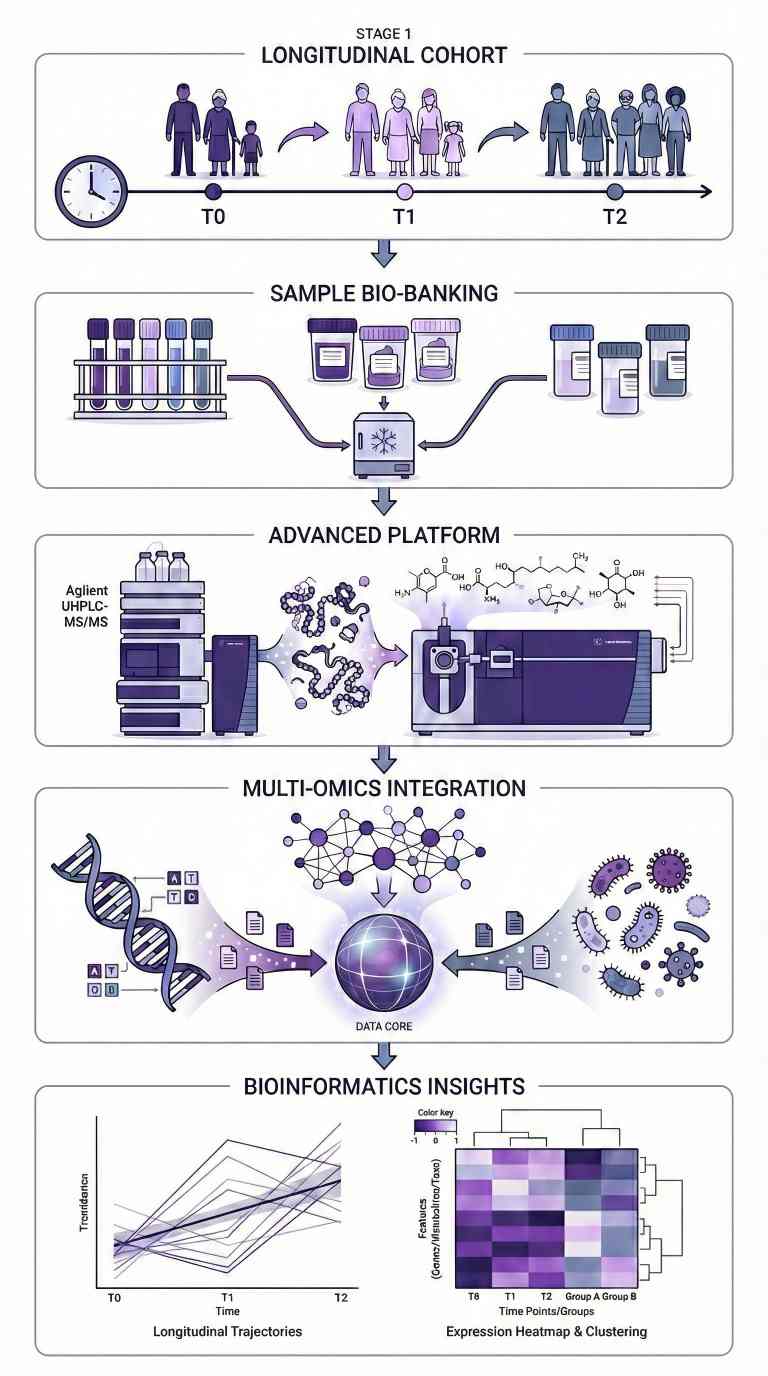
Project Workflow for Longitudinal Multi-omics Profiling
Analytical Platforms for Longitudinal Multi-omics Profiling
We use high-performance platforms optimized for longitudinal stability. Specific configurations may vary by study design and matrix.
Instrumentation (Typical)
- Metabolomics: Triple quadrupole and/or Orbitrap HRAM for targeted/untargeted applications.
- Proteomics: Orbitrap-based DIA acquisition for stable quantification and reduced missingness.
- Sequencing: Illumina platforms for 16S and shotgun metagenomics (depth and read length per study).
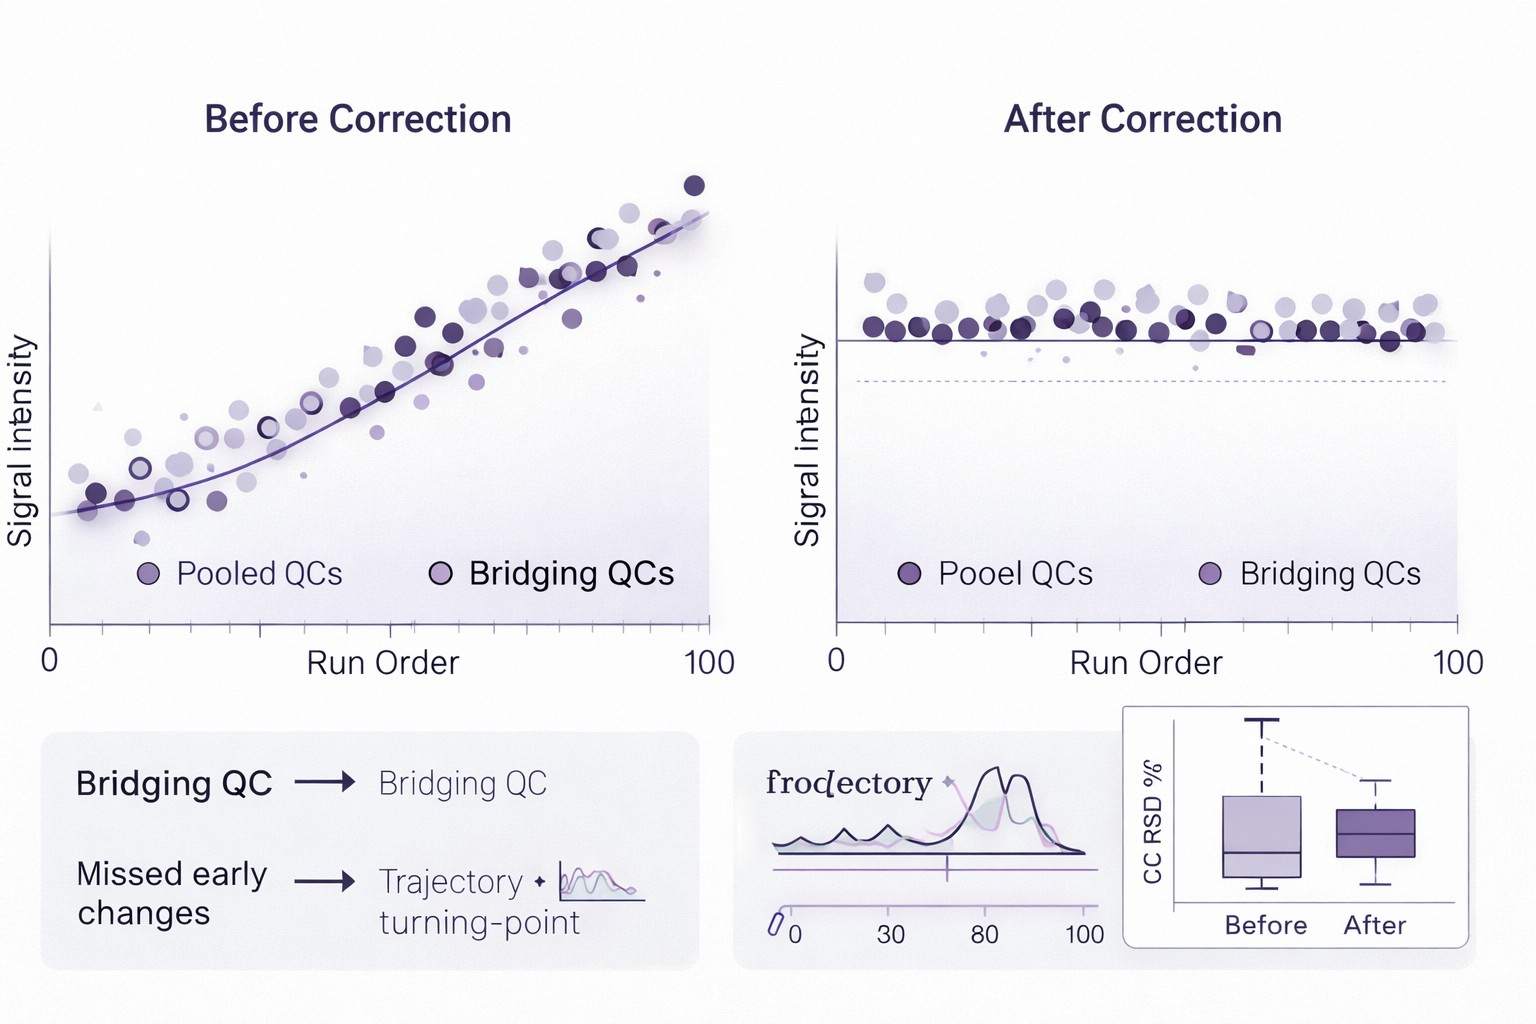
Longitudinal Batch Control Framework
Bridging References: A consistent reference material run across all batches (month 1 to month N) to enable cross-batch modeling.
QC Benchmarks (Study-Dependent):
- Drift monitoring & correction: Methods selected based on QC behavior (e.g., LOESS-type approaches; SERRF-like strategies when appropriate).
- Reproducibility targets: Pooled-QC RSD goals defined per platform/matrix; reported with distributions and batch-level pass/fail rationale.
- Retention time alignment: Alignment windows defined per method; reported with pre/post alignment diagnostics.
Sample Types & Submission Requirements
Core Principle: Keep collection conditions consistent within the cohort to minimize non-biological variability.
| Sample Type |
Volume/Amt (Per Time Point) |
Collection Notes |
Shipping |
| Plasma/Serum |
200 µL–500 µL |
Tube type consistency (e.g., EDTA vs. heparin) is critical. |
Dry ice |
| Urine |
1 mL–5 mL |
Centrifuge to remove debris; document storage time/temperature. |
Dry ice |
| Feces |
200 mg–500 mg |
Freeze immediately (-80°C) or use a standardized stabilizer. |
Dry ice |
| PBMC |
5–10 × 10^6 cells |
Standardized isolation and cryopreservation protocol required. |
Liquid N2 / dry ice |
Deliverables: What You Receive from Our Service
- Processed Data Tables (CSV/XLSX): harmonized metabolomics/proteomics/microbiome matrices + sample/time-point mapping.
- QC & Harmonization Report (PDF): bridging QC design, drift/batch correction evidence (PCA, drift curves, RSD/missingness).
- Longitudinal Analysis Results (CSV/XLSX): trajectory/trend statistics, clustering (if applied), key feature lists.
- Multi-Omics Integration Outputs (CSV): cross-omics association matrices; networks (Cytoscape-ready) if requested.
- Figures (PNG + editable PDF/SVG): key plots for publication and presentations.
- Methods Appendix (PDF/DOCX): brief methods + parameter summary for reproducibility
Longitudinal Multi-Omics Applications and Use Cases
Comparing the metabolic signatures of obesity defined by waist circumference, waist-hip ratio, or BMI
Al Hariri, M., et al.
Journal: Obesity
Year: 2024
DOI: https://doi.org/10.1002/oby.24070
Pregnancy specific shifts in the maternal microbiome and metabolome in the BPH5 mouse model of superimposed preeclampsia
Beckers, K. F., et al.
Journal: PLOS ONE
Year: 2024
DOI: https://doi.org/10.1371/journal.pone.0287145
Anxiety-like behavior during protracted morphine withdrawal is driven by gut microbial dysbiosis and attenuated with probiotic treatment
Oppenheimer, M., et al.
Journal: Gut Microbes
Year: 2025
DOI: https://doi.org/10.1080/19490976.2025.2517838