Why Natural Product Metabolomics?
Natural product matrices are dominated by secondary metabolites and are highly sensitive to variables such as origin, harvest season, processing, and extraction. LC–MS/MS metabolomics provides an efficient way to compare profiles, prioritize key compounds, and link chemical changes to biological outcomes.
Questions this analysis can help answer
- What are the key secondary metabolites in my medicinal plant, extract, or formula?
- How do batches differ across origin, cultivation conditions, processing, or storage?
- Which compounds are absorbed into serum or distributed into target tissues after dosing?
- Which endogenous pathways shift after treatment (e.g., lipids, amino acids, bile acids) and what does that suggest mechanistically?
- Which differential metabolites and pathways can support publishable conclusions and follow-up validation?
What We Analyze: Service Menu
Detectable Metabolite Coverage: Natural Product LC–MS/MS
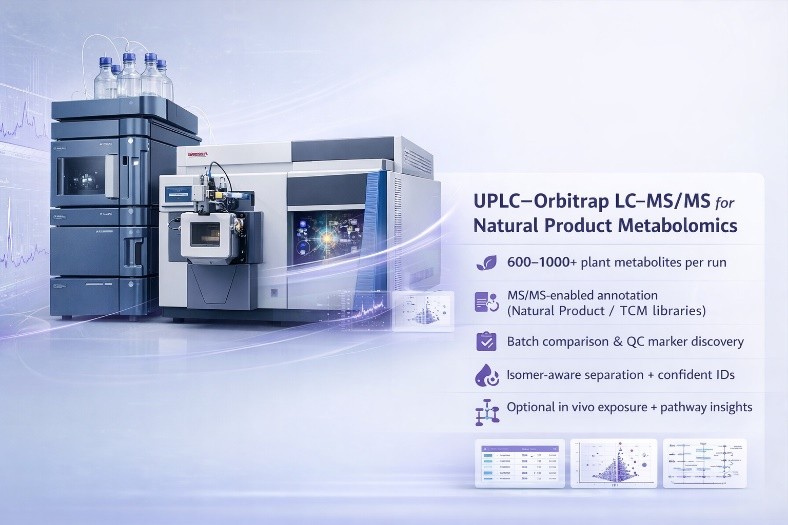
This service profiles plant secondary metabolites in natural products and herbal materials, with optional endogenous metabolomics for in vivo studies. Detection is influenced by matrix, extraction, and ionization response.
Typical detection: ~600–1000+ plant secondary metabolites per run (matrix-dependent).
Plant & Natural Product Secondary Metabolites (Standard Coverage)
| Chemical Family |
Typical Detectability |
Representative Examples (non-exhaustive) |
Common Research Questions Addressed |
Notes |
| Flavonoids |
High |
quercetin, kaempferol, apigenin, luteolin, naringenin, rutin |
batch/origin comparison, QC markers, bioactivity correlation |
Includes glycosides and major subclasses (flavones, flavonols, etc.) |
| Alkaloids |
High |
berberine, palmatine, ephedrine (project-dependent) |
safety/toxicity signals, pharmacology, consistency |
Matrix effects can be strong; method optimized by sample type |
| Terpenoids |
High |
triterpenoids, sesquiterpenes; saponin-type terpenoids (project-dependent) |
efficacy-related constituents, processing impact |
Coverage depends on extraction and ion mode; targeted refinement available |
| Coumarins |
Medium–High |
coumarin, scopoletin, esculetin, imperatorin |
processing comparison, origin/batch differences |
UPLC separation + MS/MS supports isomer discrimination |
| Lignans |
Medium–High |
schisandrin-related, sesamin-related (project-dependent) |
mechanism studies, batch comparison |
Often benefits from RT + MS/MS confidence |
| Phenolic acids |
High |
chlorogenic acid, caffeic acid, ferulic acid, rosmarinic acid |
antioxidant-related studies, QC markers |
Generally robust detection across plant matrices |
| Saponins / Glycosides |
Medium–High |
ginsenoside-like / saikosaponin-like classes (project-dependent) |
formula profiling, activity association |
Frequently improved with optimized gradients and MS/MS settings |
| Anthraquinones |
Medium |
emodin, rhein, chrysophanol |
safety/toxicity, processing effects |
Ion mode and sample prep impact recovery |
| Tannins & polyphenols (subset) |
Medium |
catechin/epicatechin; procyanidin-related (subset) |
QC, bioactivity correlation |
Very large polymers may be partially captured depending on method |
| Other phytochemicals |
Project-dependent |
stilbenes, iridoids, glucosinolates (project-dependent) |
natural product discovery |
Expandable based on study goals and matrix |
Typical number of detected plant secondary metabolites per run: ~600–1000+ (sample-type dependent).
Endogenous Metabolites for In Vivo / Host-Response Studies (Optional)
| Metabolite Family |
Typical Detectability |
Representative Examples (non-exhaustive) |
Common Research Questions Addressed |
Notes |
| Amino acids & derivatives |
High |
tryptophan, phenylalanine, glutamine, taurine |
mechanism-of-action, immune/inflammation links |
Strong pathway interpretability |
| Organic acids (TCA / glycolysis-related) |
High |
citrate, malate, succinate, lactate, pyruvate |
energy metabolism, stress/toxicity response |
Supports pathway enrichment (TCA/glycolysis) |
| Bile acids |
Medium–High |
cholic acid, chenodeoxycholic acid, deoxycholic acid; conjugates |
gut–liver axis, herb–host metabolism |
Especially informative in dosing studies |
| Lipids (subset panels) |
Medium–High |
PCs, LysoPCs, SMs (subset) |
inflammation, membrane remodeling |
Expanded lipidomics available if needed |
| Steroids & steroid hormones (subset) |
Medium |
steroid precursors and hormone-related metabolites (project-dependent) |
endocrine-related mechanisms |
Sensitivity depends on matrix and method |
| Nucleosides (subset) |
Medium |
adenosine, uridine, inosine |
immune/metabolic signaling |
Often interpreted with stress/energy pathways |
| Acylcarnitines (subset) |
Medium |
short/long-chain acylcarnitines (subset) |
mitochondrial function, FAO |
Useful metabolic stress signatures |
| Indole / microbiome-related (subset) |
Medium |
tryptophan-derived indole metabolites (subset) |
gut–host interaction |
Matrix-specific optimization may apply |
| Carbohydrates & polyols (subset) |
Medium |
glucose-related and sugar alcohols (subset) |
energy metabolism |
Coverage varies; targeted options available |
Advantages of Our Natural Product Metabolomics Service
- Deep reference libraries for confident annotation
TCM-focused library capacity: 39,000+ total entries, including 5,000+ TCM standards, 14,000+ manually curated active constituents, and 20,000+ metabolite spectra generated from in vitro incubation models (for metabolite interpretation).
- Endogenous/metazoan metabolite library
10,000+ metabolites with 2,500+ standard-supported entries providing RT + MS1 + MS2 evidence (when applicable to the module).
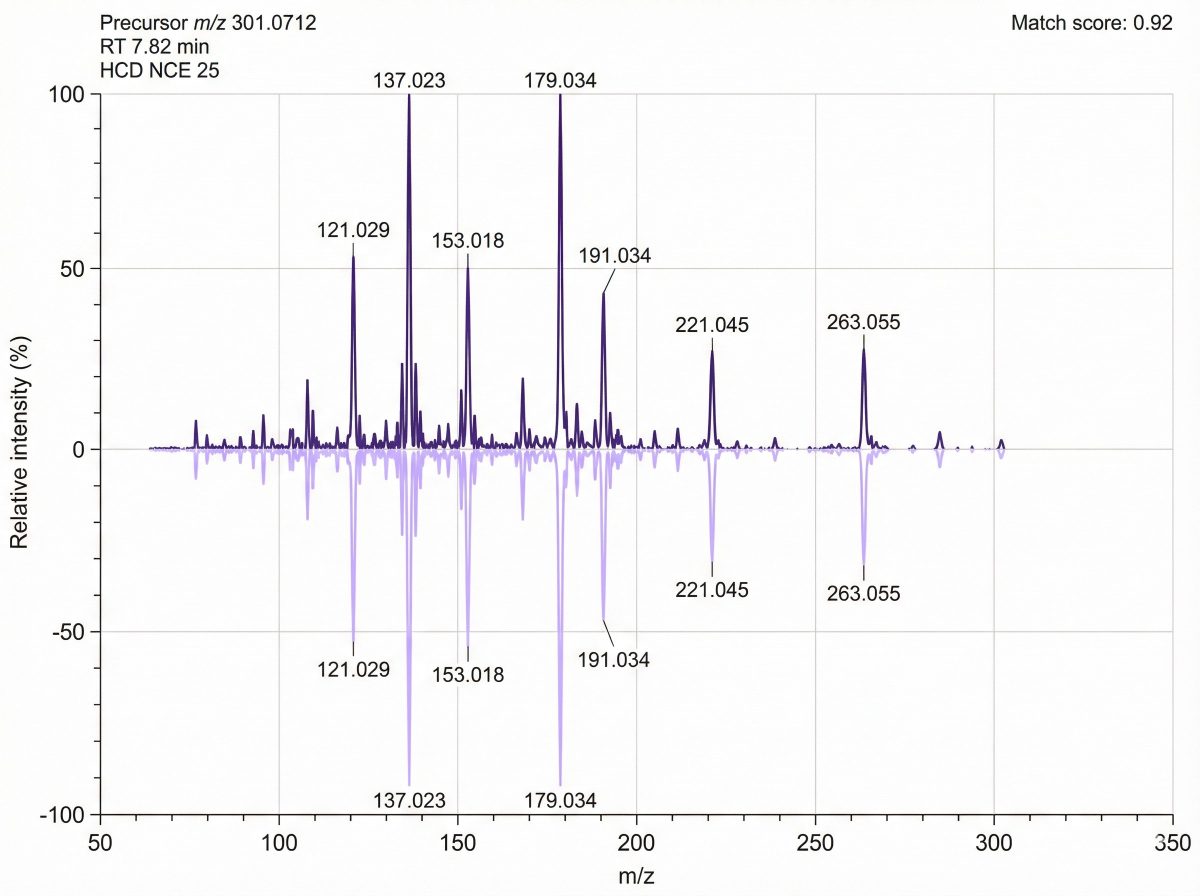
- Standard-supported, multi-dimensional identification options
Highest-confidence reporting can include RT + accurate mass (MS1) + MS/MS (LC–MS/MS) evidence, with match scoring and spectra visualization for key findings.
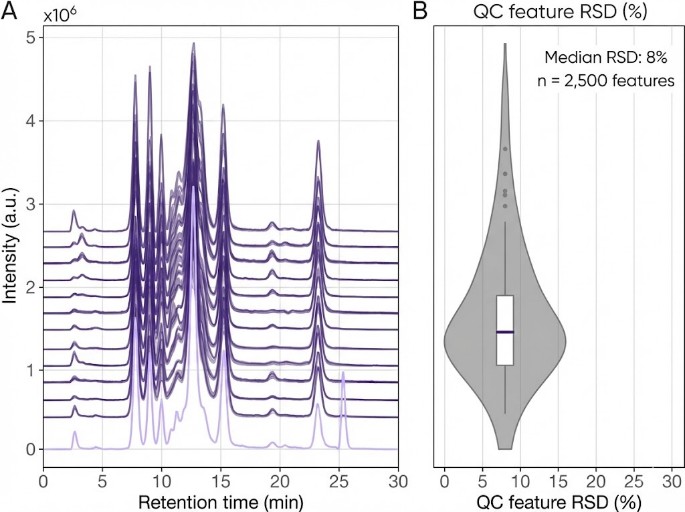
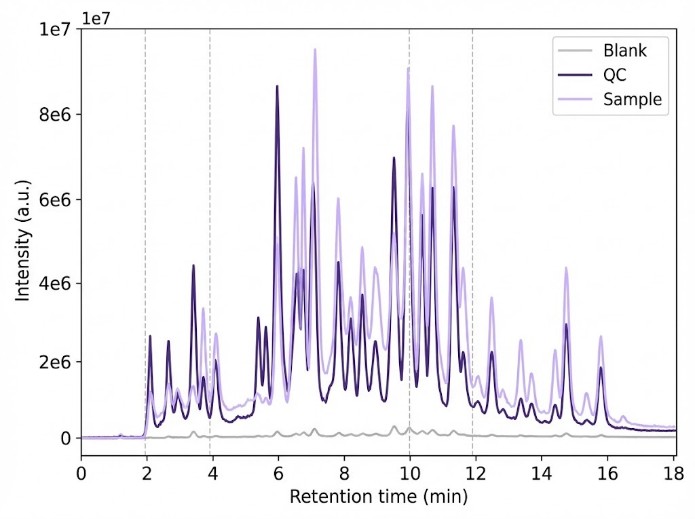
- Quality control built into routine production
Multi-layer QC strategy (e.g., pooled QC injections, blanks, internal standards, signal stability monitoring, RT drift checks, mass accuracy checks) to improve reproducibility and interpretability.
- Scalable production experience
High annual sample throughput supports consistent execution for both pilot studies and larger experimental designs (capacity planning available on request).
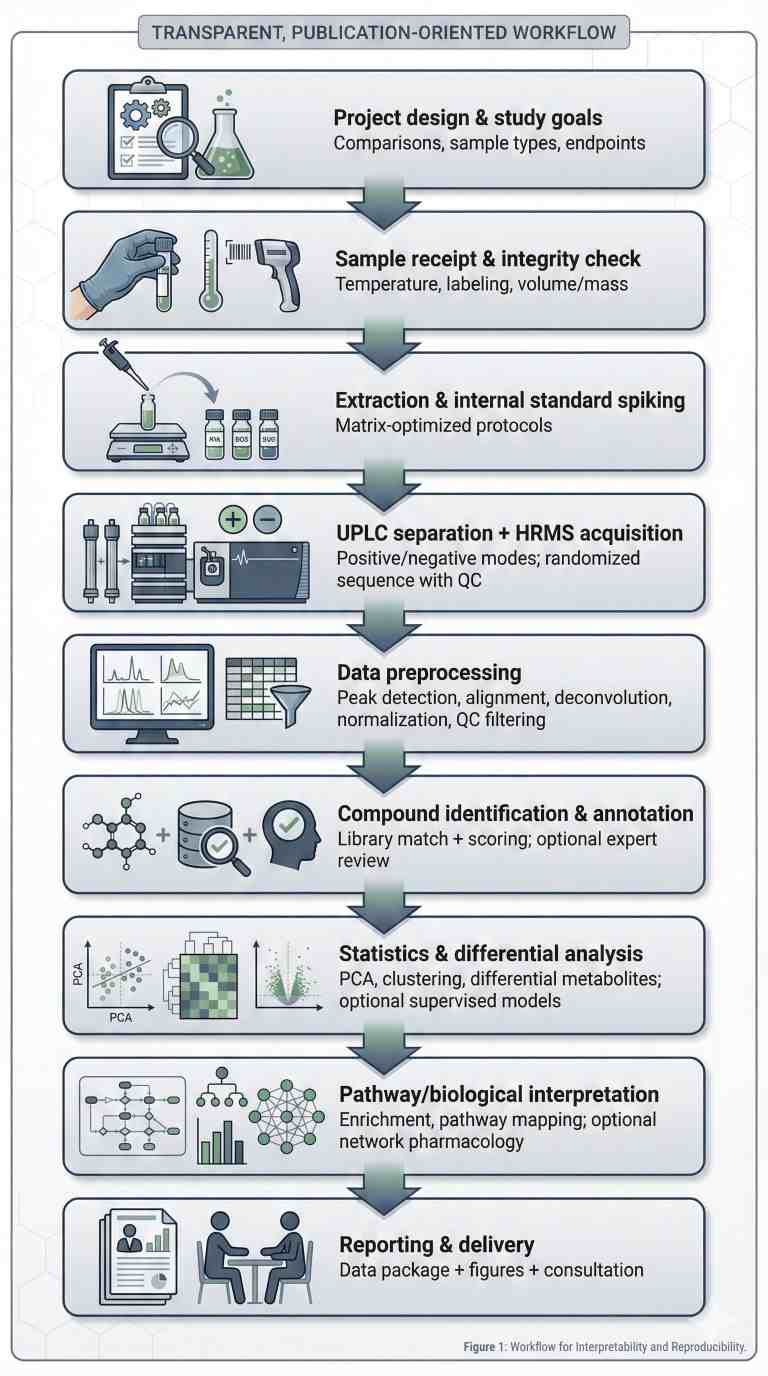
Study Design Support: Recommended Comparisons and Experimental Strategies
We provide practical study design guidance to help you obtain interpretable, publication-ready metabolomics results.
- Group comparison: Control vs treatment, batch/origin, processing (Paozhi), or extraction method.
- Dose–response / time-course: Best for absorbed constituents and mechanism-focused pathway changes.
- Multi-factor design: Separate effects such as origin × processing or cultivar × environment with balanced sampling.
- QC & replicates: Pooled QC, blanks, internal standards, and randomized run order to control drift and batch effects.
Replicate tip: For discovery studies, prioritize biological replicates (a common starting point is ≥6 per group when feasible).
Analytical Platform: UPLC–Orbitrap LC–MS/MS and Key Parameters
We use an industry-standard UPLC–high-resolution Orbitrap LC–MS/MS workflow optimized for natural product complexity.
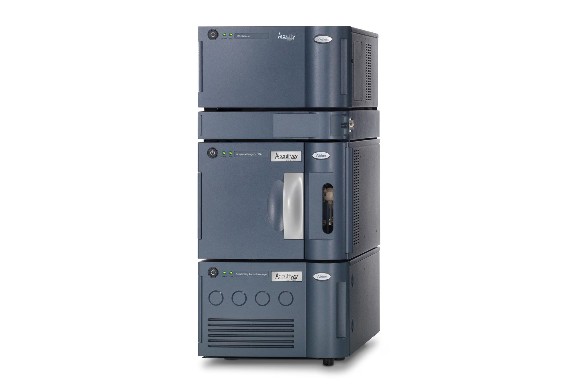
UPLC System
- Waters ACQUITY UPLC I-Class (or equivalent UPLC platform)
- Why it matters: high-pressure UPLC improves separation of isomers and co-eluting phytochemicals and supports stable retention times.
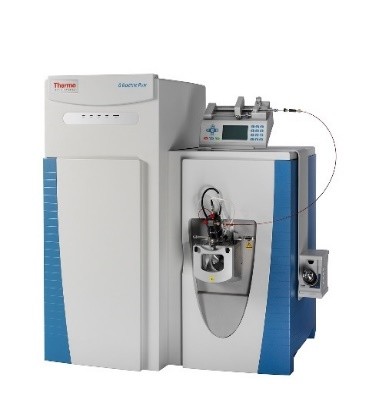
High-Resolution Mass Spectrometer (HRMS)
- Thermo Scientific Q Exactive series Orbitrap (configuration dependent)
Common acquisition characteristics (method-optimized per project):
- Ionization: ESI/HESI in positive and negative modes
- Mass accuracy: typically ≤5 ppm after calibration (project-run dependent)
- MS1 resolution: commonly 70,000–120,000 at m/z 200
- MS/MS resolution: commonly 17,500–30,000 at m/z 200
- Scan range: commonly m/z 70–1,050 (method dependent)
- Acquisition modes: DDA and/or DIA (selected based on coverage vs. annotation goals)
Final acquisition settings are optimized based on matrix complexity (plant tissue vs. extract vs. serum/tissue), expected compound classes, and study objectives.
Sample Requirements: Recommended Inputs, Storage, and Shipping
| Sample Type |
Minimum Amount |
Container |
Storage |
Shipping |
| Raw herb / powder / granules / capsule content |
≥5 g |
Sealed tube/bag |
Dry, ventilated; protect from moisture/mold |
Ambient as appropriate; protected packaging |
| Decoction / injection |
≥20 mL |
Centrifuge tube (≤2/3 full) + sealing film |
−20°C |
Dry ice |
| Serum / urine |
≥500 μL |
Cryovial |
−80°C preferred |
Dry ice |
| Tissue (animal) |
≥20 mg |
Cryovial |
Snap-freeze, −80°C |
Dry ice |
| Fresh plant tissue (if applicable) |
Project-dependent |
10–15 mL tube |
Liquid N₂ snap-freeze 5–10 min; store −80°C |
Dry ice |
Deliverables: Data Files, Reports, and Identification Confidence Levels
- Raw LC–MS/MS data files for all samples (including QC and blanks), provided in instrument format (e.g., .raw) and/or open format (.mzML).
- A processed peak/feature table (sample × feature matrix) including RT, m/z, adduct (if applicable), and peak intensity/area.
- An identified/annotated compound list with compound name, chemical class, RT, precursor m/z, MS/MS match score, and confidence level.
- A QC summary sheet reporting key run metrics such as internal standard performance, signal stability, RT drift, and missing-value rate.
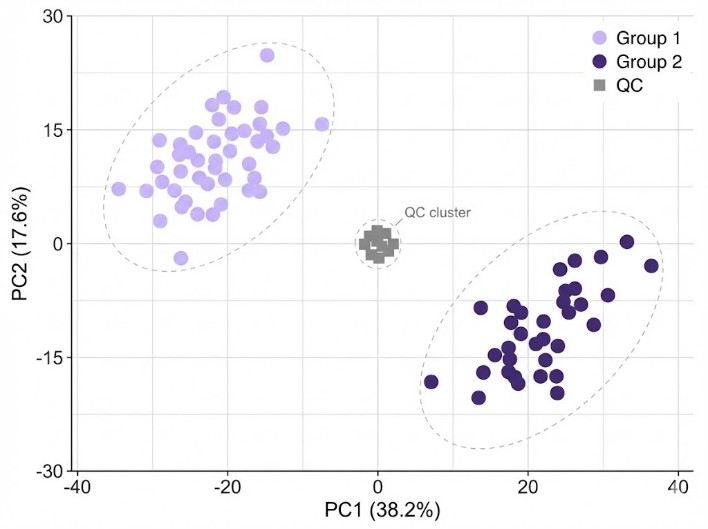
- Core statistical outputs (PCA scores/loadings and clustering/heatmap files) with the corresponding underlying data tables.
- A differential metabolite results table including fold change and statistical values (p-value and/or FDR, as applicable).
- Pathway enrichment results (tables and pathway mapping outputs) for interpretation, when biological pathway analysis is included.
- A final summary report (PDF or Word) describing methods, QC, key findings, and interpretation aligned to your study objectives.
Applications for Natural Product Metabolomics Analysis
Physiological, transcriptomic and metabolomic insights of three extremophyte woody species living in the multi-stress environment of the Atacama Desert
Gajardo, H. A., Morales, M., Larama, G., Luengo-Escobar, A., López, D., Machado, M., ... & Bravo, L. A.
Journal: Planta
Year: 2024
DOI: https://doi.org/10.1007/s00425-024-04484-1
Comparative metabolite profiling of salt sensitive Oryza sativa and the halophytic wild rice Oryza coarctata under salt stress
Tamanna, N., Mojumder, A., Azim, T., Iqbal, M. I., Alam, M. N. U., Rahman, A., & Seraj, Z. I.
Journal: Plant‐Environment Interactions
Year: 2024
DOI: https://doi.org/10.1002/pei3.10155
Multiomics of a rice population identifies genes and genomic regions that bestow low glycemic index and high protein content
Badoni, S., Pasion-Uy, E. A., Kor, S., Kim, S. R., Tiozon Jr, R. N., Misra, G., ... & Sreenivasulu, N.
Journal: Proceedings of the National Academy of Sciences
Year: 2024
DOI: https://doi.org/10.1073/pnas.2410598121
Glucocorticoid-induced osteoporosis is prevented by dietary prune in female mice
Chargo, N. J., Neugebauer, K., Guzior, D. V., Quinn, R. A., Parameswaran, N., & McCabe, L. R.
Journal: Frontiers in Cell and Developmental Biology
Year: 2024
DOI: https://doi.org/10.3389/fcell.2023.1324649
Quantifying forms and functions of intestinal bile acid pools in mice
Sudo, K., Delmas-Eliason, A., Soucy, S., Barrack, K. E., Liu, J., Balasubramanian, A., ... & Sundrud, M. S.
Journal: bioRxiv
Year: 2024
DOI: https://doi.org/10.1101/2024.02.16.580658