Immunometabolism Metabolomics Analysis: What It Measures
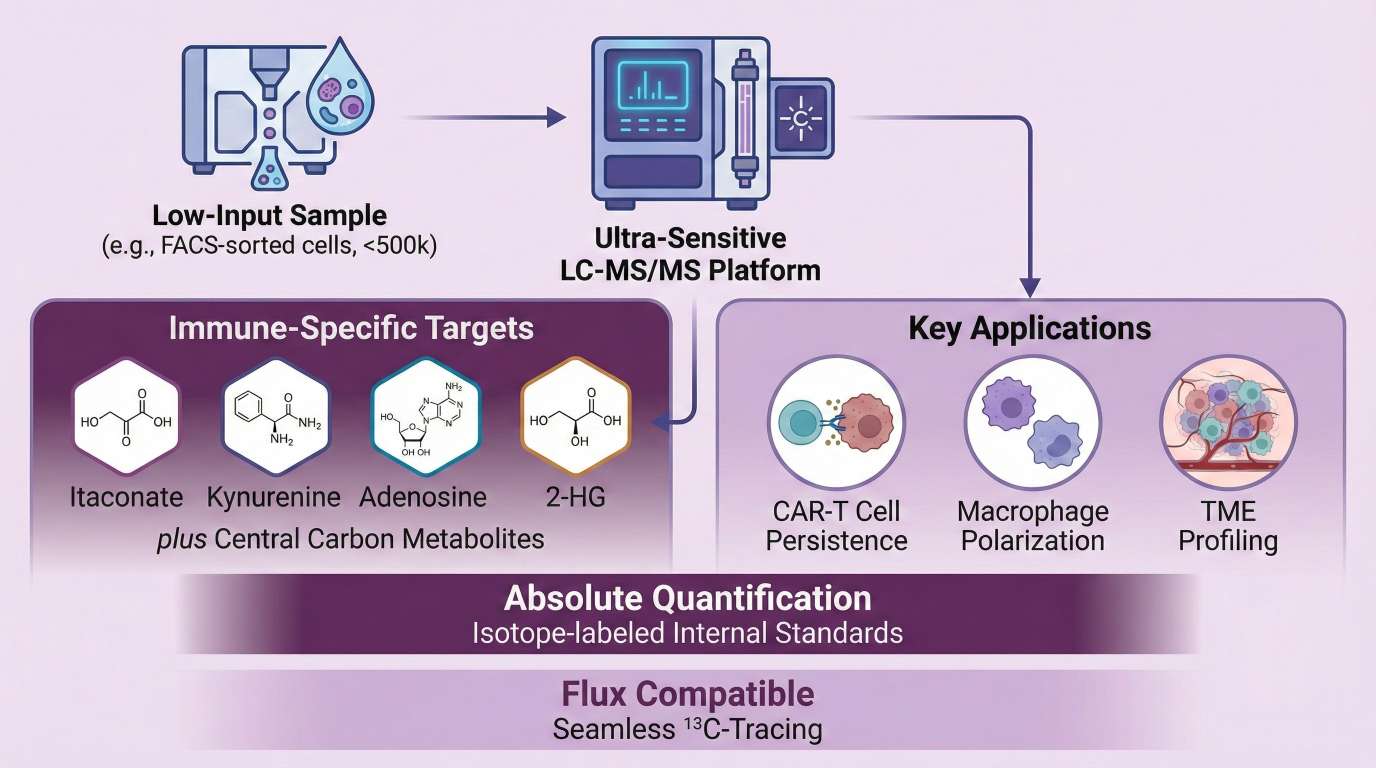
Immunometabolism analysis is the quantitative profiling of metabolic pathways that regulate immune cell differentiation, activation, and function. Unlike static housekeeping processes, metabolism in immune cells is dynamic; specific metabolites (e.g., Itaconate in macrophages, 2-HG in T-cells) act as signaling molecules that directly control gene expression and effector functions.
Quantifying these changes provides a functional readout of the immune state, bridging the gap between gene expression (transcriptomics) and cellular phenotype (cytokines/killing), essential for developing effective immunotherapies.
When Teams Choose an Immunometabolism Panel: Problems We Solve
Service Scope: Targeted Immunometabolomics Service Modules
- Core Immunometabolism Panel: Absolute quantification of 50+ targets including Glycolysis, TCA, Amino Acids, and Immune Signaling molecules.
- Bioenergetics Module: Assessment of Energy Charge (ATP/ADP/AMP) and Redox State (NAD+/NADH, NADP+/NADPH).
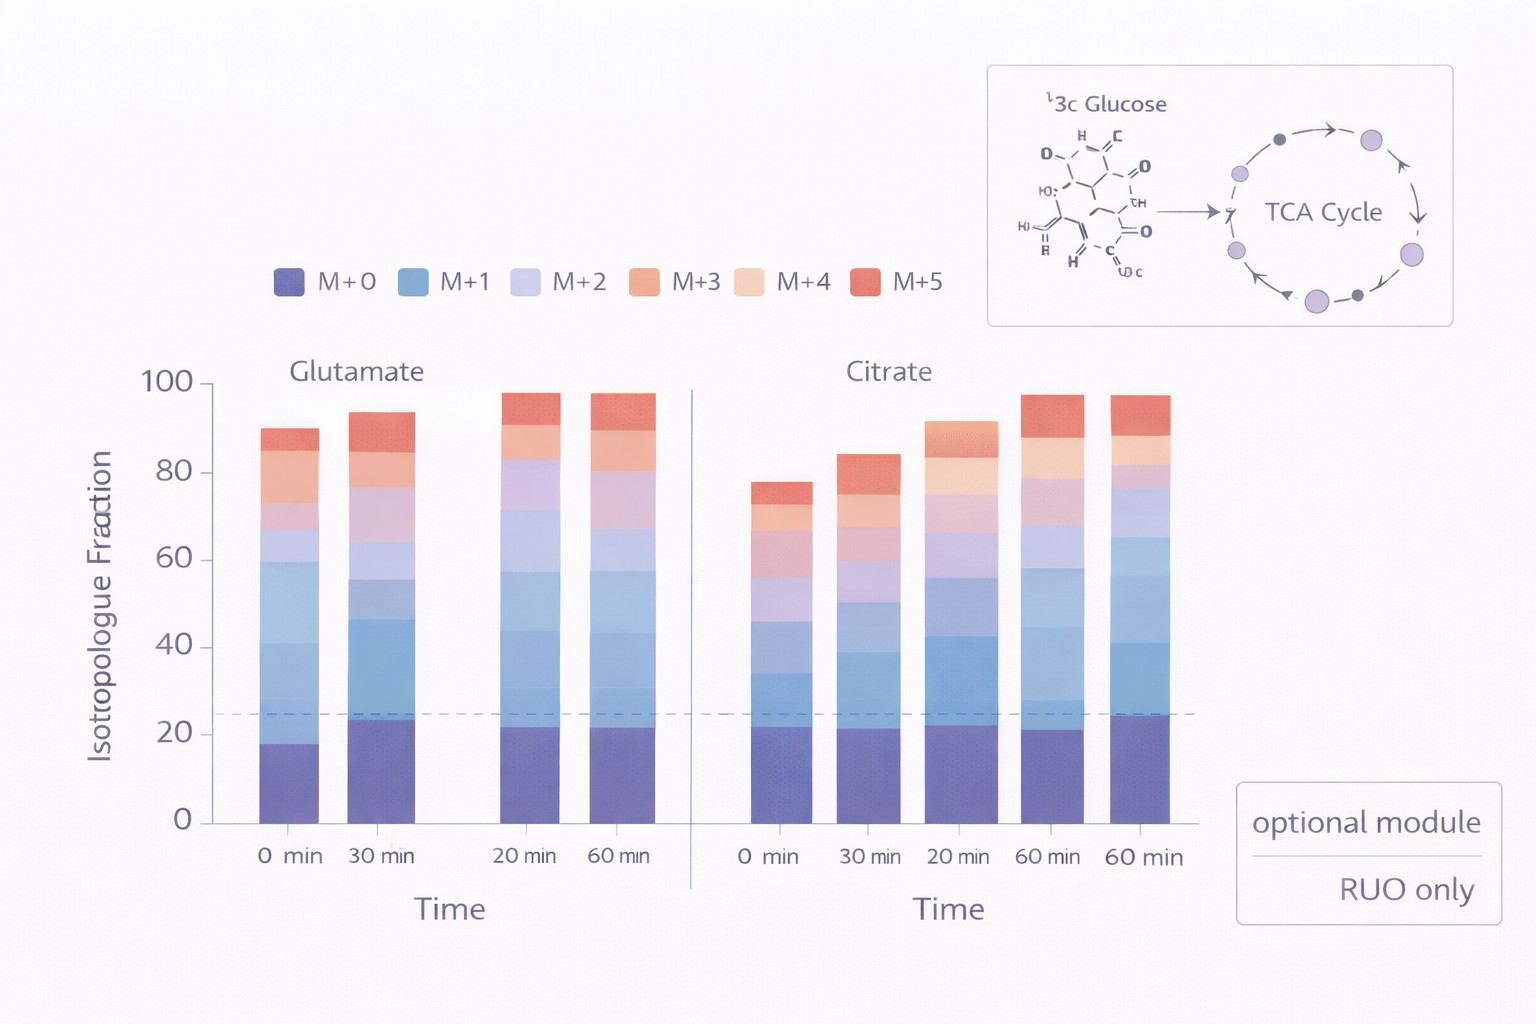
- Flux Analysis Upgrade: Dynamic tracing using [U-¹³C]-Glucose or [U-¹³C]-Glutamine to measure glycolytic and mitochondrial flux rates.
- Exometabolome Profiling: Analysis of culture supernatants to measure nutrient consumption (e.g., Glucose, Arginine) and waste secretion (e.g., Lactate, Ammonia).
Analyte Coverage: LC-MS/MS Immunometabolism Panel Modules
Our panel captures the metabolic machinery driving immune cell plasticity, covering 50+ targets across bioenergetics, signaling, and epigenetic regulation.
| Functional Module |
Key Targets (Absolute Quant) |
Immunological Relevance |
| Immune Checkpoints & Signaling |
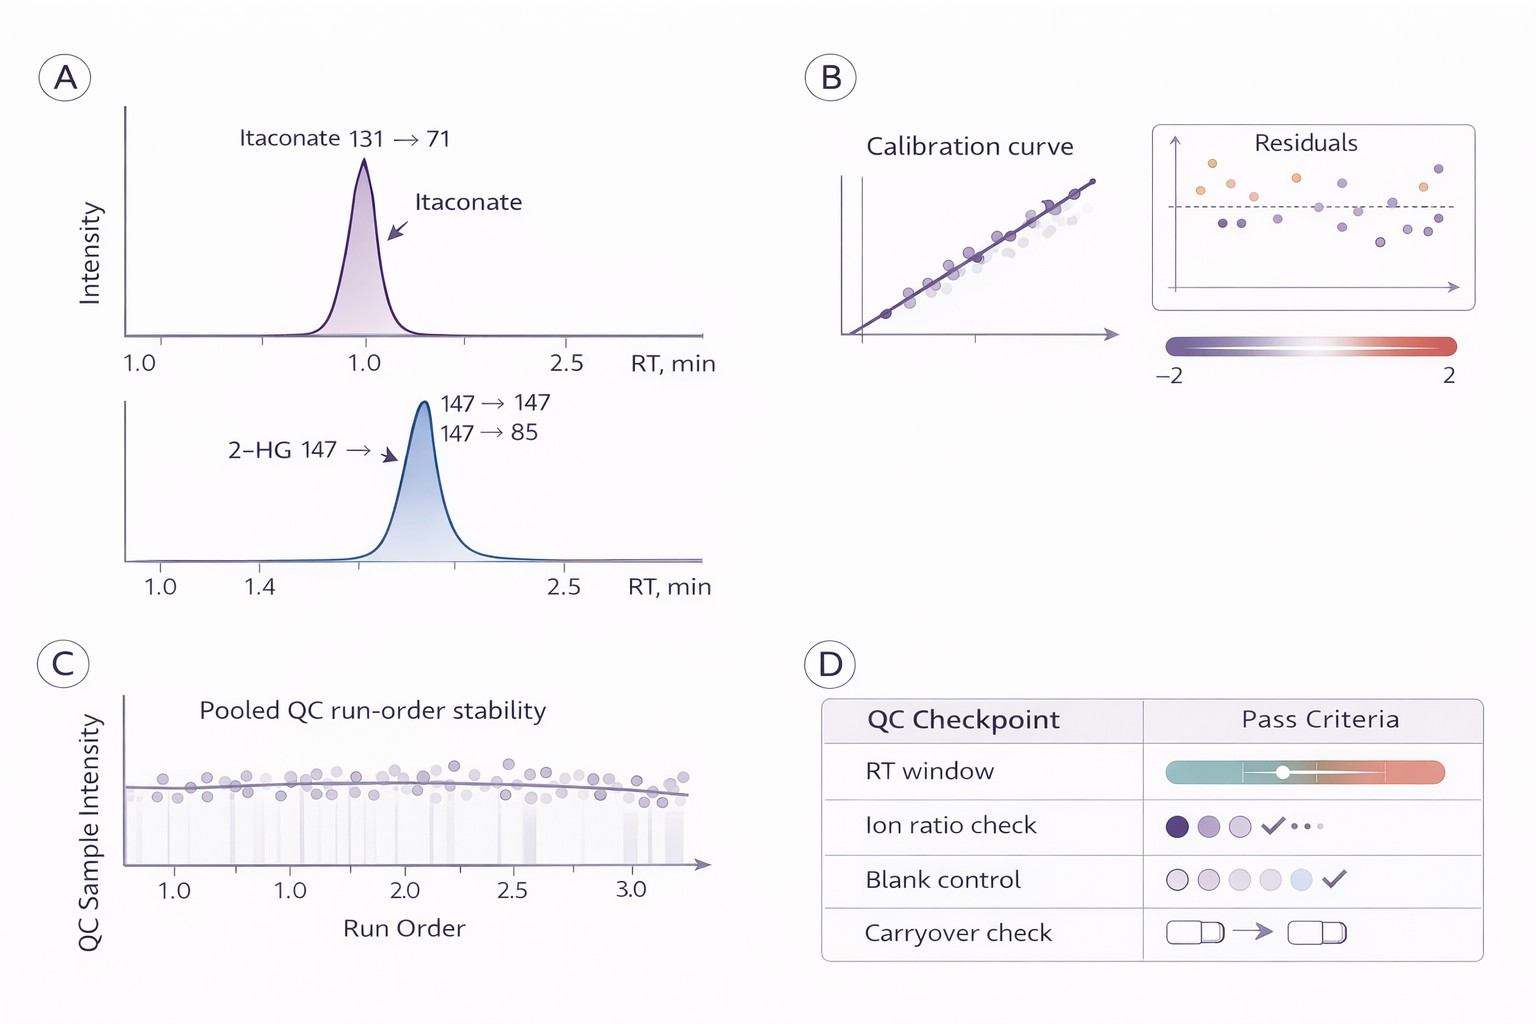
Itaconate, Kynurenine, Tryptophan, 2-Hydroxyglutarate (2-HG), Adenosine |
Itaconate: Marker of M1 Macrophage activation; Inhibits SDH (succinate dehydrogenase).
Kyn/Trp Ratio: Key indicator of IDO1-mediated T-cell suppression. |
| Bioenergetics & Redox |
ATP, ADP, AMP, NAD+, NADH, GSH, GSSG (Glutathione), NAD+/NADH ratio, Acetate, Fatty acids |
Energy Charge: AMP/ATP ratio, AMPK activation.
Redox: ROS scavenging in TME.
Acetate: T-cell differentiation and anti-inflammatory. |
| TCA & Mitochondrial Respiration |
Citrate, Succinate, Fumarate, Malate, α-Ketoglutarate |
Succinate: Drives HIF-1α stabilization and inflammation.
Citrate: Precursor for fatty acid synthesis, promoting T-cell blastogenesis. |
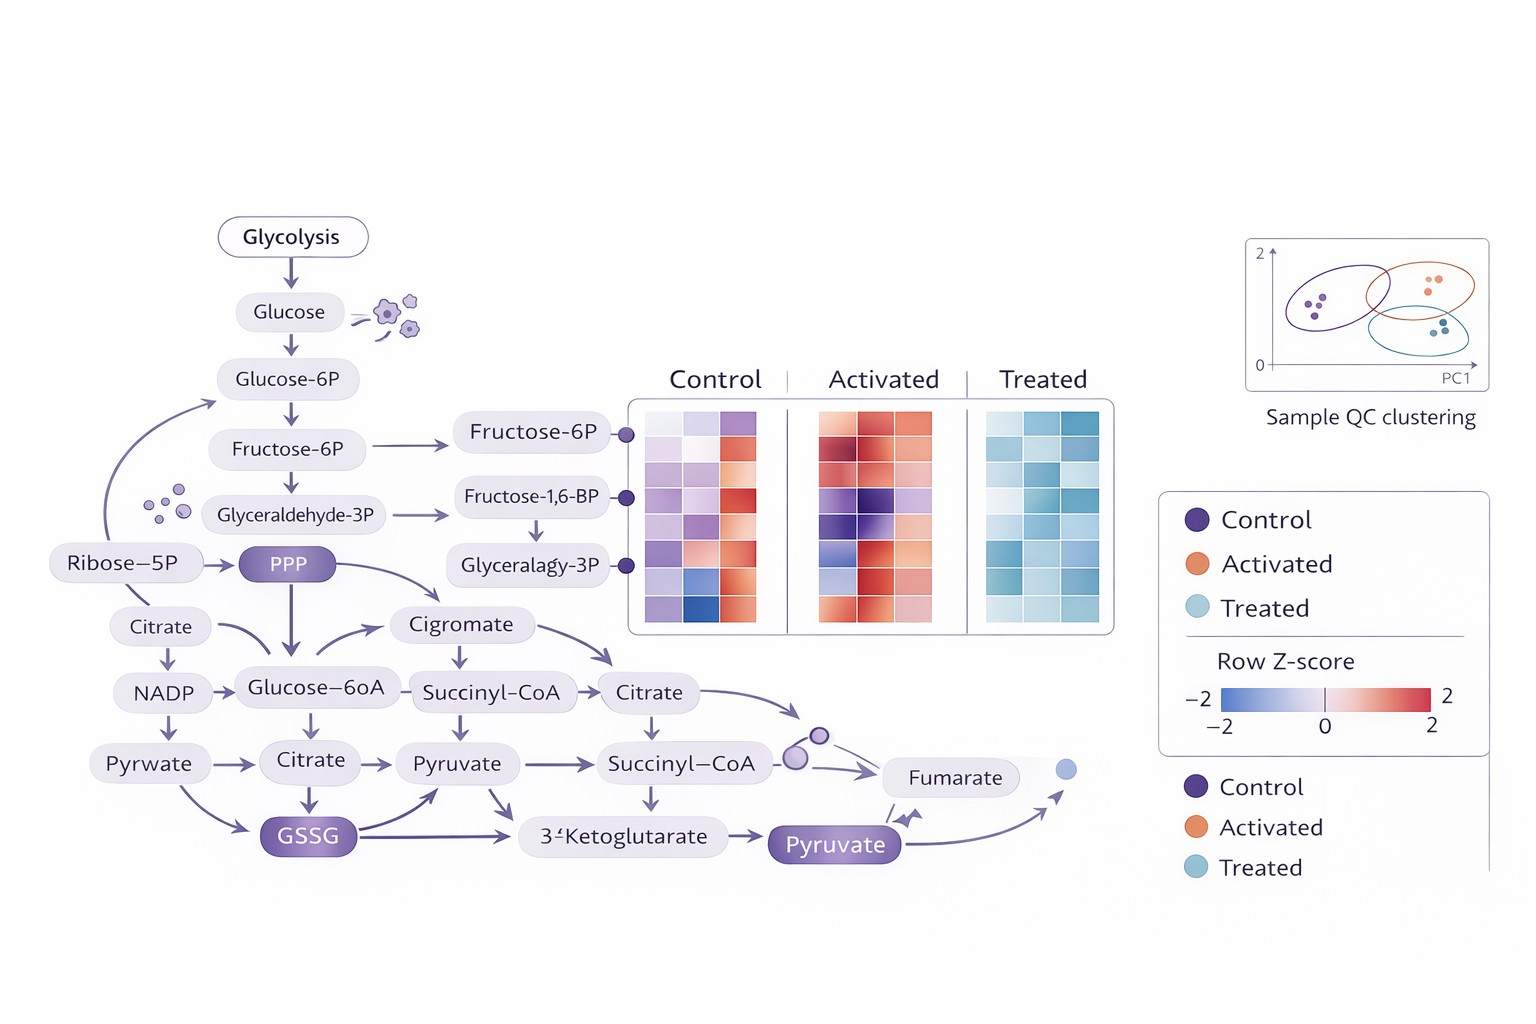
| Warburg Effect & Glycolysis |
Glucose, Pyruvate, Lactate, Phosphoenolpyruvate (PEP) |
Lactate: Marker of TME acidification and T-cell exhaustion.
Glycolysis: Essential for Effector T-cell (Teff) activation. |
| Amino Acid Regulators |
Arginine, Ornithine, Citrulline, Glutamine, Serine, Tryptophan |
Arg/Orn Ratio: Distinguishes M1 (iNOS) vs M2 (Arginase) macrophage polarization.
Glutamine: Supports T-cell proliferation and anaplerosis.
Tryptophan: Regulates immune tolerance via IDO1 enzyme. |
| Epigenetic Modulators (Optional) |
Methionine, SAM, SAH, Acetyl-CoA, Methylthioadenosine (MTA) |
SAM/SAH: Methylation potential driving T-cell differentiation.
Acetyl-CoA: Precursor for histone acetylation in T-cell differentiation.
MTA: Inhibits immune response in tumors. |
| Lipid Metabolism & Inflammation |
Ceramides, Prostaglandins, Leukotrienes, Fatty Acids |
Ceramides: Involved in immune cell death and inflammation.
Prostaglandins & Leukotrienes: Lipid mediators that regulate inflammation and immune responses. |
*Note: Highly labile analytes like Adenosine/ATP require strict adherence to our Rapid Quenching SOP to prevent degradation.
Why Choose This Immunometabolism Targeted Metabolomics Service
- Sensitivity for Rare Cells: Optimized for FACS-sorted populations and rare tumor-infiltrating lymphocytes (TILs), requiring 10x less material than standard methods.
- Absolute Quantification: We use isotope-labeled internal standards to provide concrete concentrations (e.g., pmol/10⁶ cells), essential for metabolic modeling.
- Pathway Depth: Beyond just "energy," we cover signaling metabolites (Itaconate, Adenosine) that act as epigenetic modifiers and immune checkpoints.
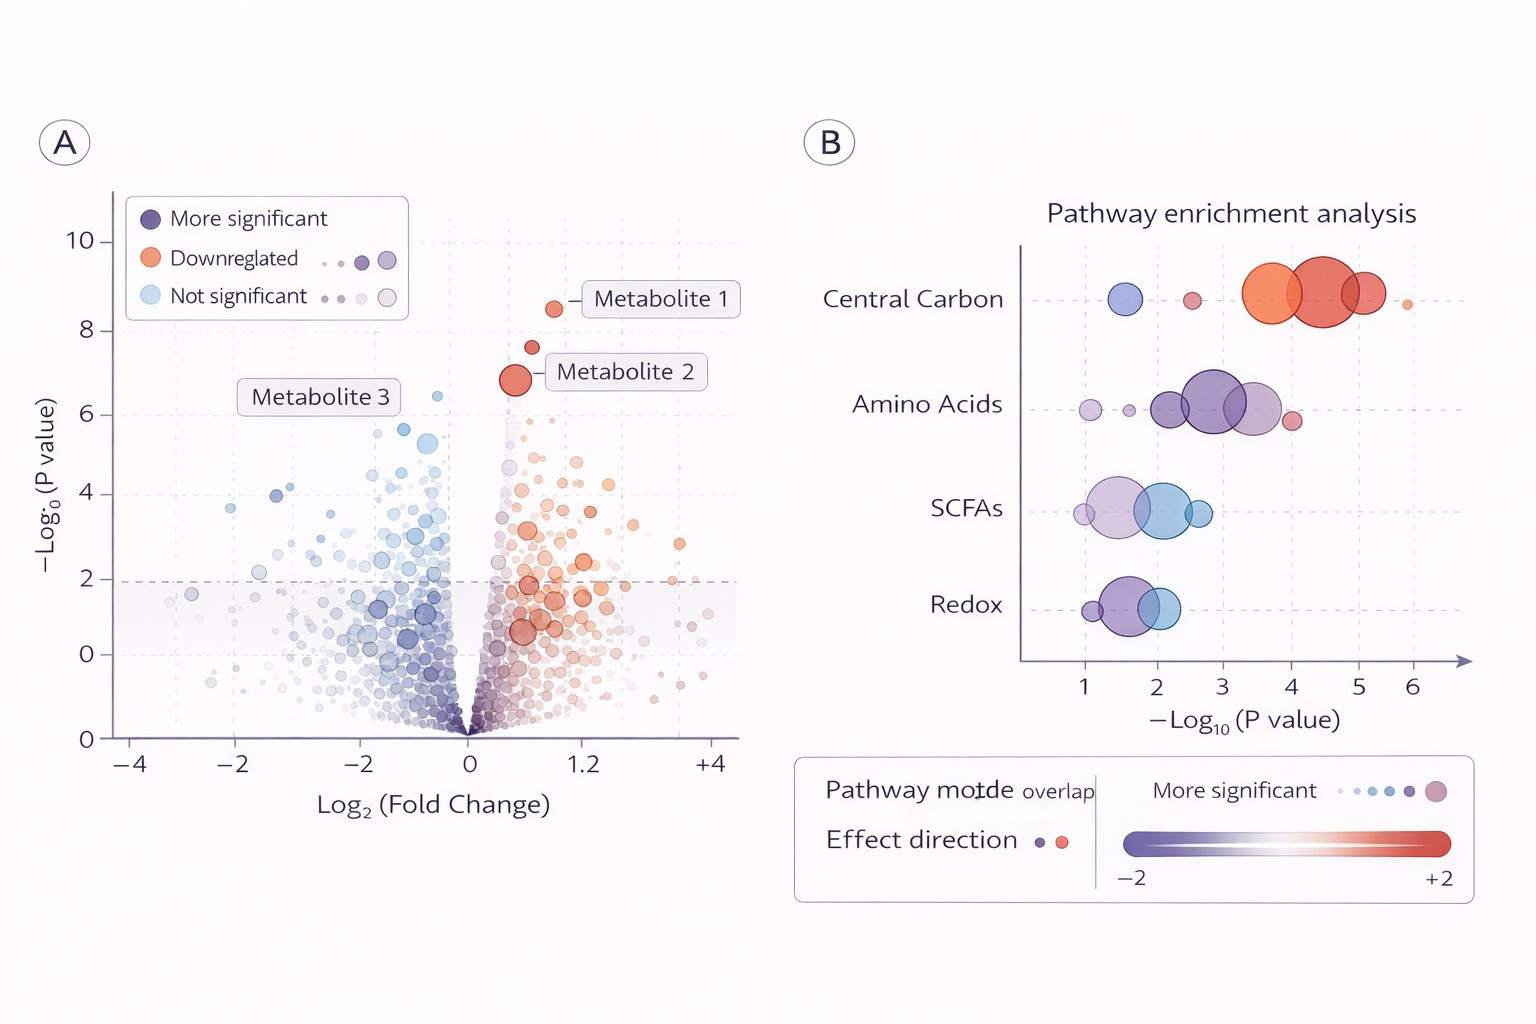
- Publication-Ready Data: Comprehensive reports with PCA, heatmaps, and pathway enrichment analysis ready for high-impact journals.
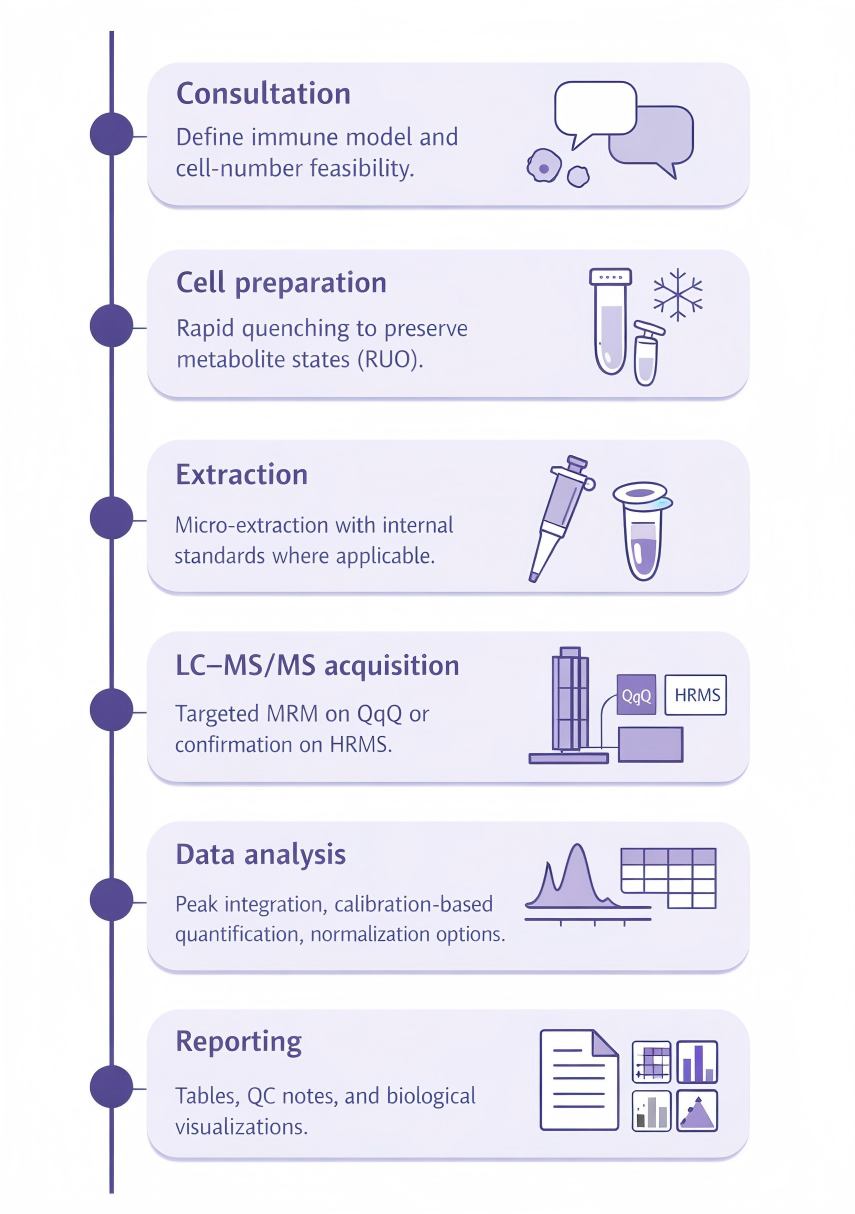
Workflow: Immune Cell Metabolomics Profiling from Sample to Report
Platforms & Technical Specs: LC-MS/MS Setup and QC Checkpoints
We utilize industry-leading instrumentation to ensure data integrity for precious samples.
Instrumentation:
- Sciex QTRAP 6500+: Selected for its industry-leading sensitivity, enabling the detection of trace metabolites in low-cell-count samples.
- Thermo Orbitrap Exploris: utilized for high-resolution confirmation and flux analysis (mass isotopologue distribution).
Quality Control Specs:
- Linearity: Calibration curves with R2 ≥ 0.99 across a broad dynamic range.
- Sensitivity: Validated LOQ suited for samples with <500,000 cells.
- Precision: Technical replicate RSD < 15% for quality control standards.
Sample Preparation & Shipping: Immune-Cell–Ready Guidance
| Sample Type |
Input Amount |
Critical Preparation & Shipping Notes |
FACS Sorted Cells
(Rare Populations) |
1–5 × 10⁵ cells
(Min: 100k) |
Wash: Wash cells 2x with cold PBS to remove sheath fluid.
Pellet: Spin down, remove supernatant completely.
Snap Freeze: Flash freeze pellet in liquid N₂ immediately. Ship on Dry Ice. |
Cultured Cells
(T-cells, Macrophages) |
1–2 × 10⁶ cells |
Quenching: Rapid washing with cold saline/PBS is required to stop metabolism.
Format: Cell pellets (dry) are preferred over lysates for stability. |
Culture Media
(Exometabolome) |
100 µL |
Comparison: Must submit fresh media (blank) alongside spent media.
Processing: Centrifuge to remove cell debris before freezing. |
Tissue / Tumor
(TME Profiling) |
10–30 mg |
Speed: Tissue must be clamped/frozen within seconds of resection to preserve ATP/Lactate levels.
Normalization: Provide wet weight or protein quantification requirement. |
Deliverables: Analysis-Ready Tables, QC Summary, and Pathway Views
- Executive summary: study design recap, module overview, and interpretation notes (RUO).
- Quantitative tables: metabolite-by-sample tables with pathway/module grouping.
- Visual outputs: pathway heatmaps, group comparison plots, and QC trend visuals (as applicable).
- Raw & processed data: raw files (where applicable), processed feature tables, and metadata templates.
- Methods appendix: concise method description, panel/module definition, and QC checkpoint notes.
- Optional: statistics-ready matrix and supporting analysis package outputs.
(Need advanced data interpretation? See our Metabolomics Data Analysis services).
Applications of Immunometabolism Analysis
Resting natural killer cell homeostasis relies on tryptophan/NAD+ metabolism and HIF‐1α
Pelletier, A., Nelius, E., Fan, Z., Khatchatourova, E., Alvarado‐Diaz, A., He, J., ... & Stockmann, C.
Journal: EMBO Reports
Year: 2023
DOI: https://doi.org/10.15252/embr.202256156
B cell-intrinsic epigenetic modulation of antibody responses by dietary fiber-derived short-chain fatty acids
Sanchez, H. N., Moroney, J. B., Gan, H., Shen, T., Im, J. L., Li, T., ... & Casali, P.
Journal: Nature Communications
Year: 2020
DOI: https://doi.org/10.1038/s41467-019-13603-6
YAP mediates compensatory cardiac hypertrophy through aerobic glycolysis in response to pressure overload
Kashihara, T., Mukai, R., Oka, S., Zhai, P., Nakada, Y., Yang, Z., ... & Sadoshima, J.
Journal: The Journal of Clinical Investigation
Year: 2022
DOI: https://doi.org/10.1172/JCI150595
Elevated SLC7A2 expression is associated with an abnormal neuroinflammatory response and nitrosative stress in Huntington's disease
Gaudet, I. D., Xu, H., Gordon, E., Cannestro, G. A., Lu, M. L., & Wei, J.
Journal: Journal of Neuroinflammation
Year: 2024
DOI: https://doi.org/10.1186/s12974-024-03038-2
Central biogenic amine deficiency with concomitant exploratory behavioral deficits in Dnajc12 knock-out mice
Deng, I. B., Follett, J., Fox, J. D., Wall, S., & Farrer, M. J.
Journal: npj Parkinson's Disease
Year: 2025
DOI: https://doi.org/10.1038/s41531-025-00991-4