What is Oncometabolites Analysis and Why It Matters?
Oncometabolites Analysis is a specialized Targeted Metabolomics approach designed to quantify specific metabolites that accumulate to supraphysiological levels due to cancer-associated mutations (e.g., IDH1/2, SDH, FH) or enzyme dysregulation.
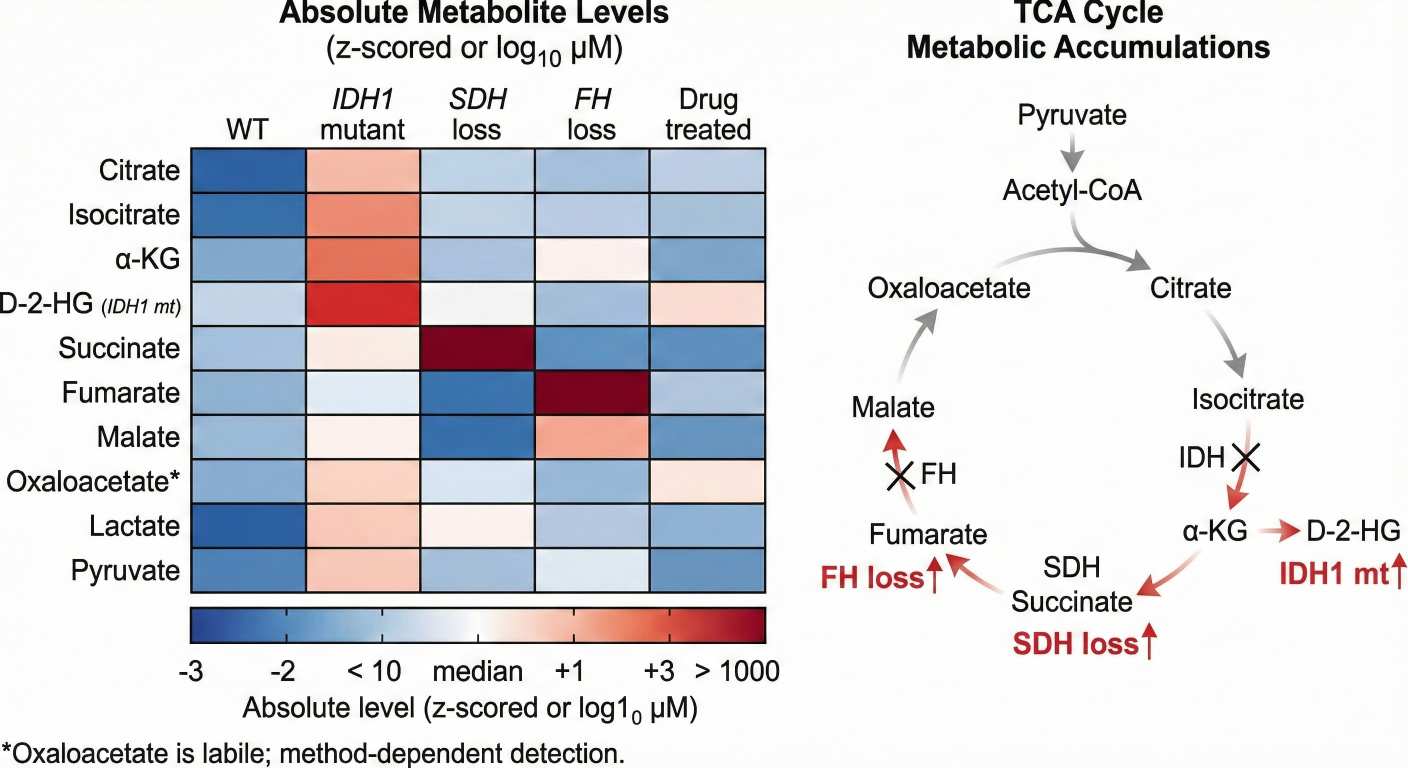
Unlike general metabolic profiling, this service focuses on absolute quantification and chiral separation of molecules that directly drive tumorigenesis, epigenetic remodeling, and immune suppression. It is the gold standard for confirming whether a genetic mutation (e.g., IDH1 R132H) translates into a functional metabolic phenotype (e.g., D-2-HG production).
Overcoming Key Challenges in Cancer Metabolism Research
Service Scope: Targeted Quantification and Optional Flux Analysis
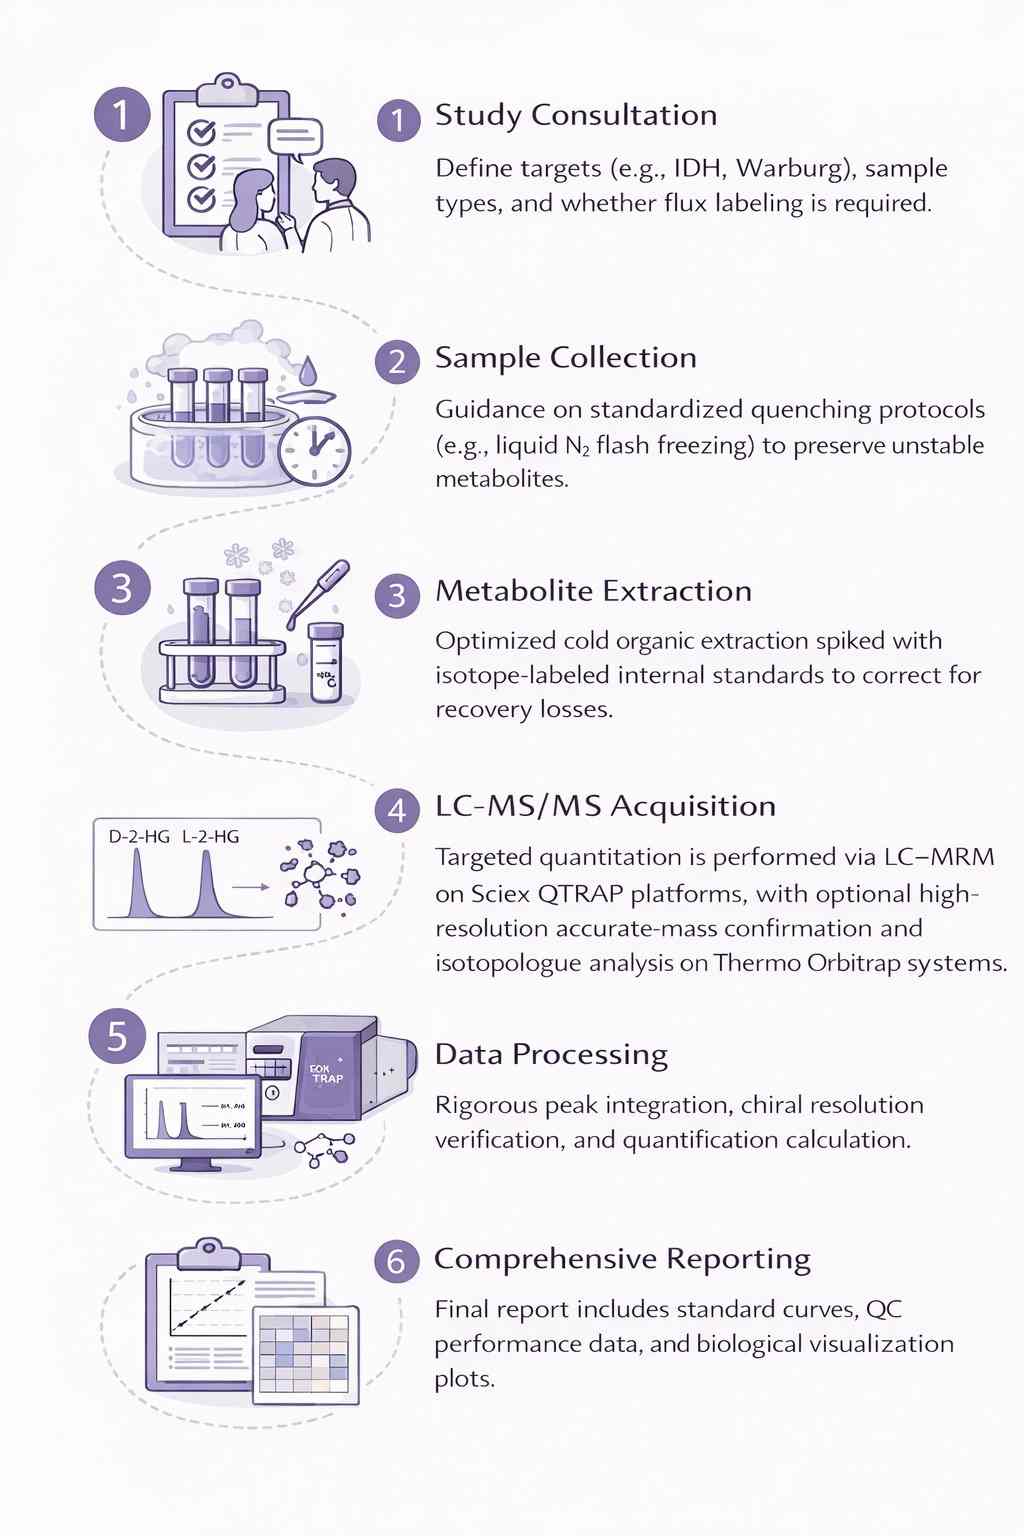
We provide a modular workflow aligned to your study stage, sample type, and pathway hypothesis:
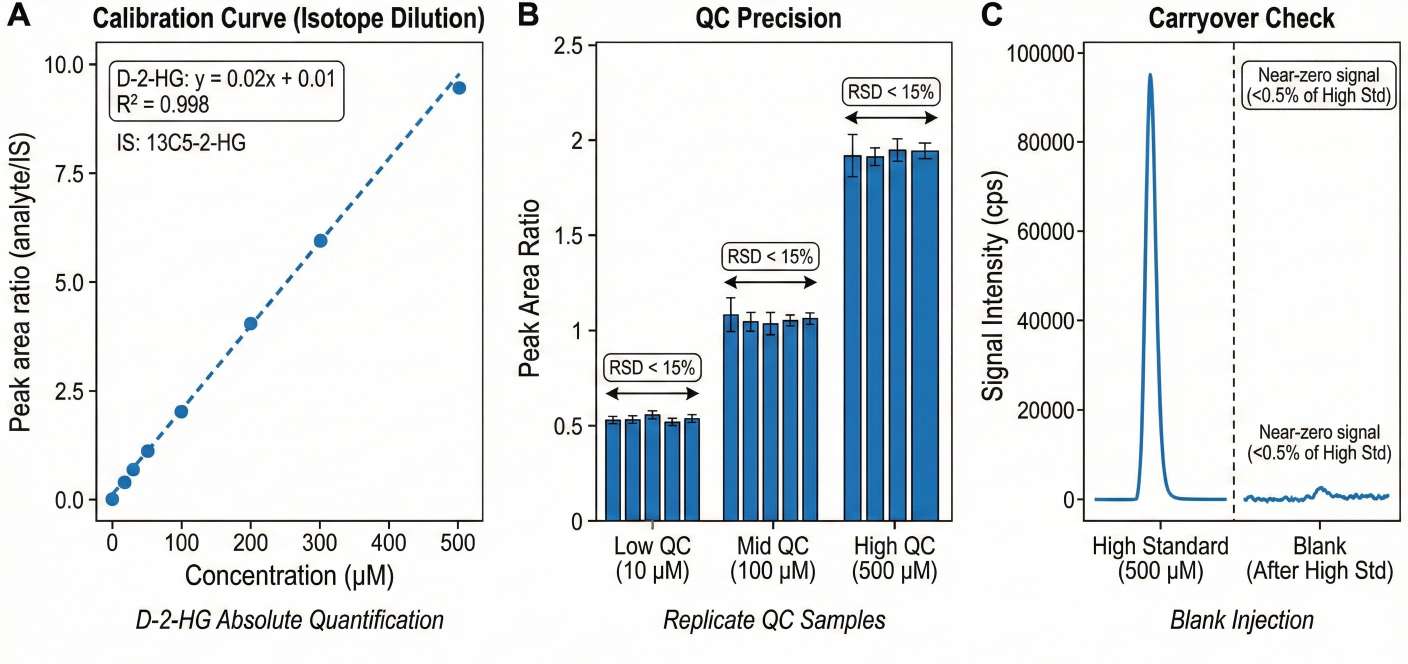
- Targeted Oncometabolite Quantification: Absolute or relative quantification for selected targets (e.g., 2-HG, lactate/pyruvate, TCA intermediates) using calibration curves with internal standards (target-dependent).
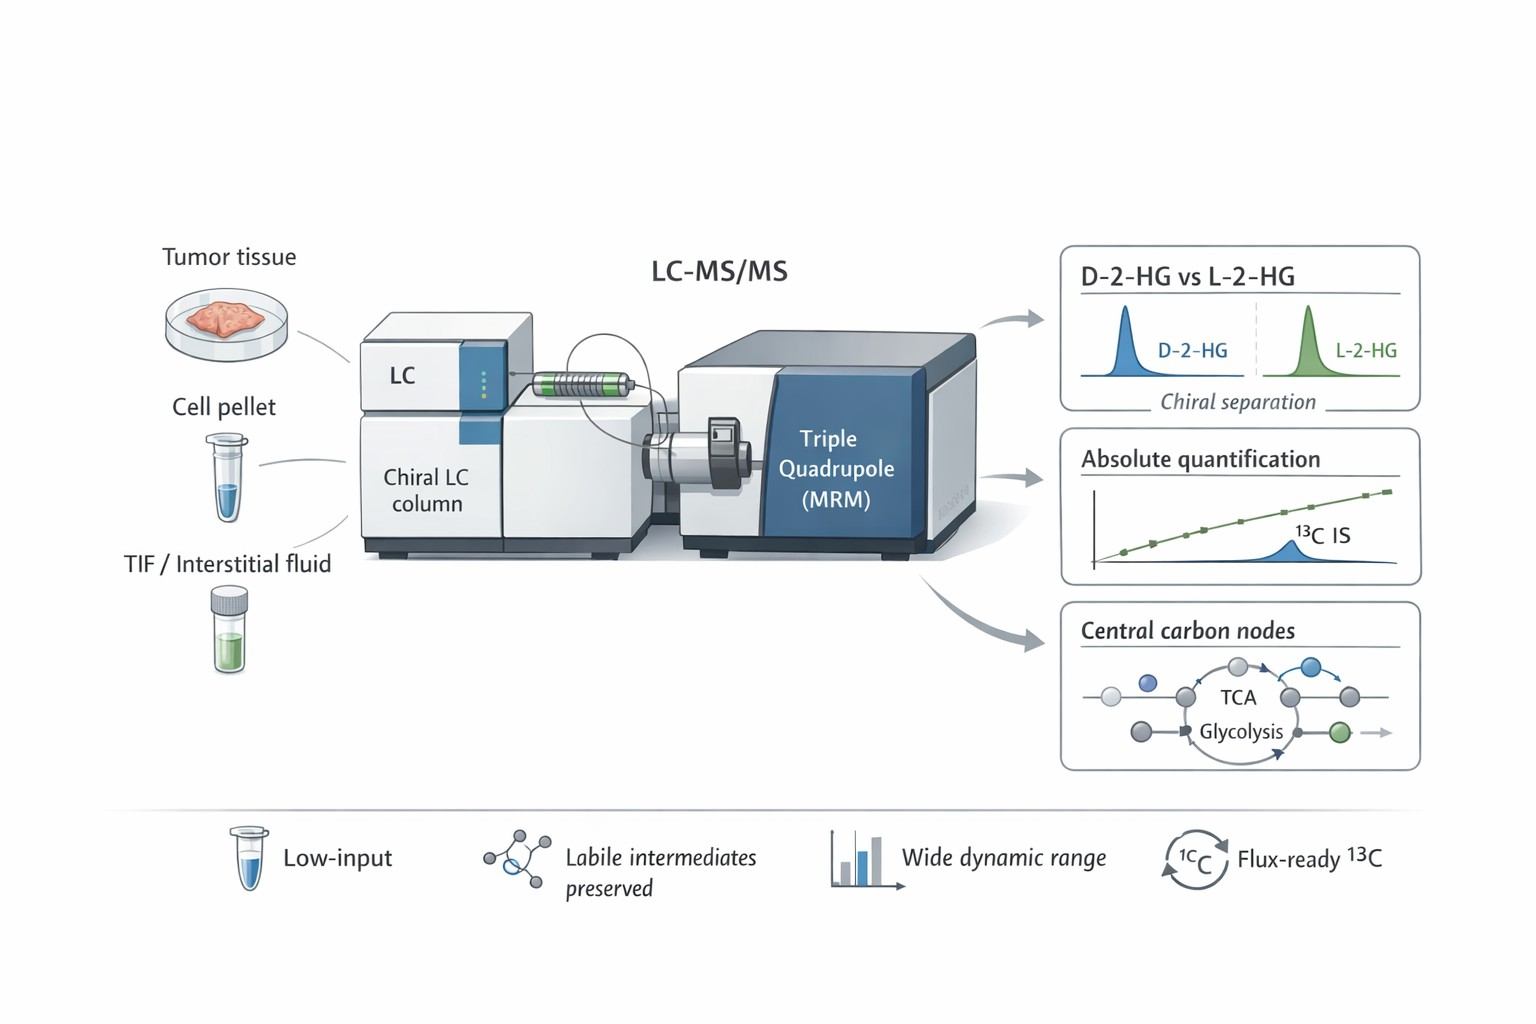
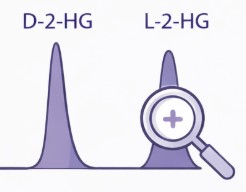
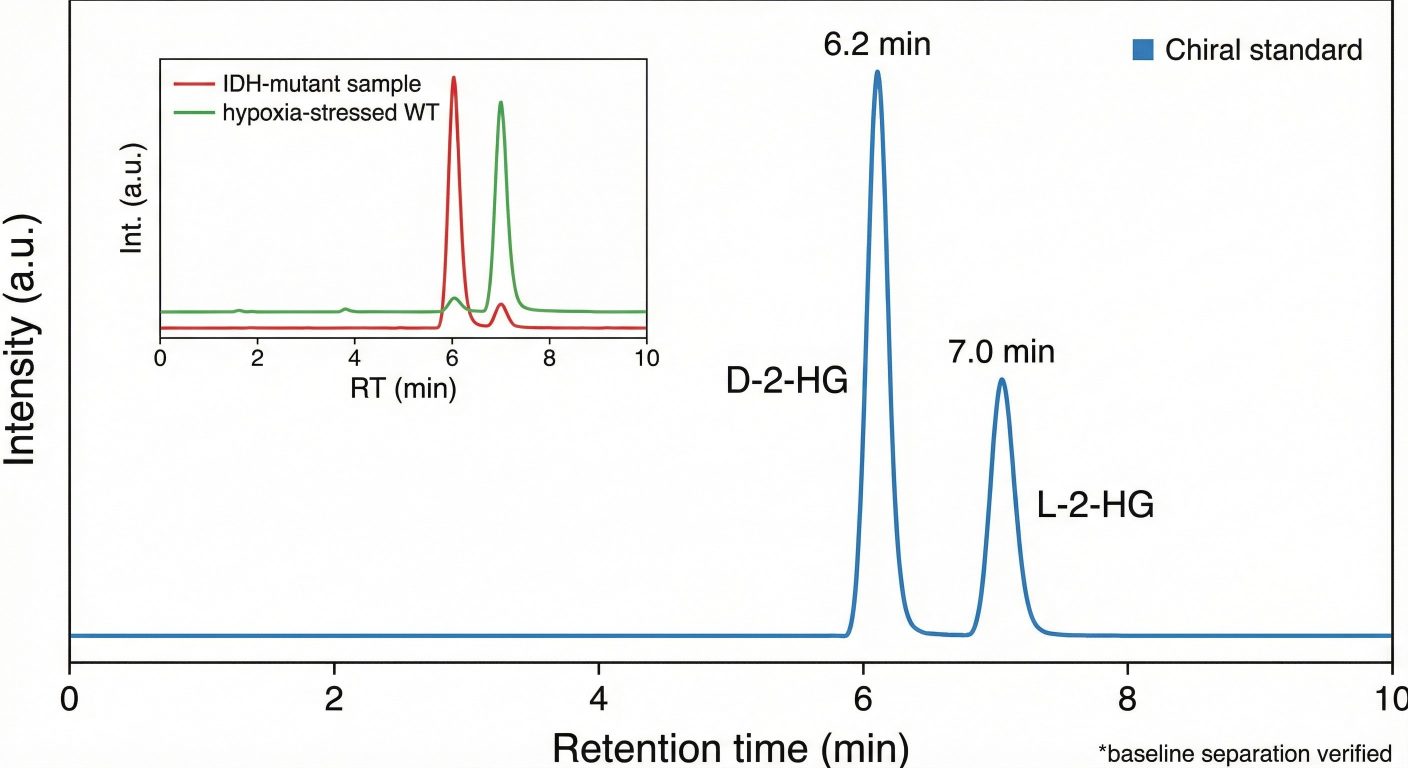
- Chiral 2-HG Resolution Assay: Dedicated chiral LC–MS/MS workflow to quantify D-2-HG and L-2-HG and report the D/L balance.
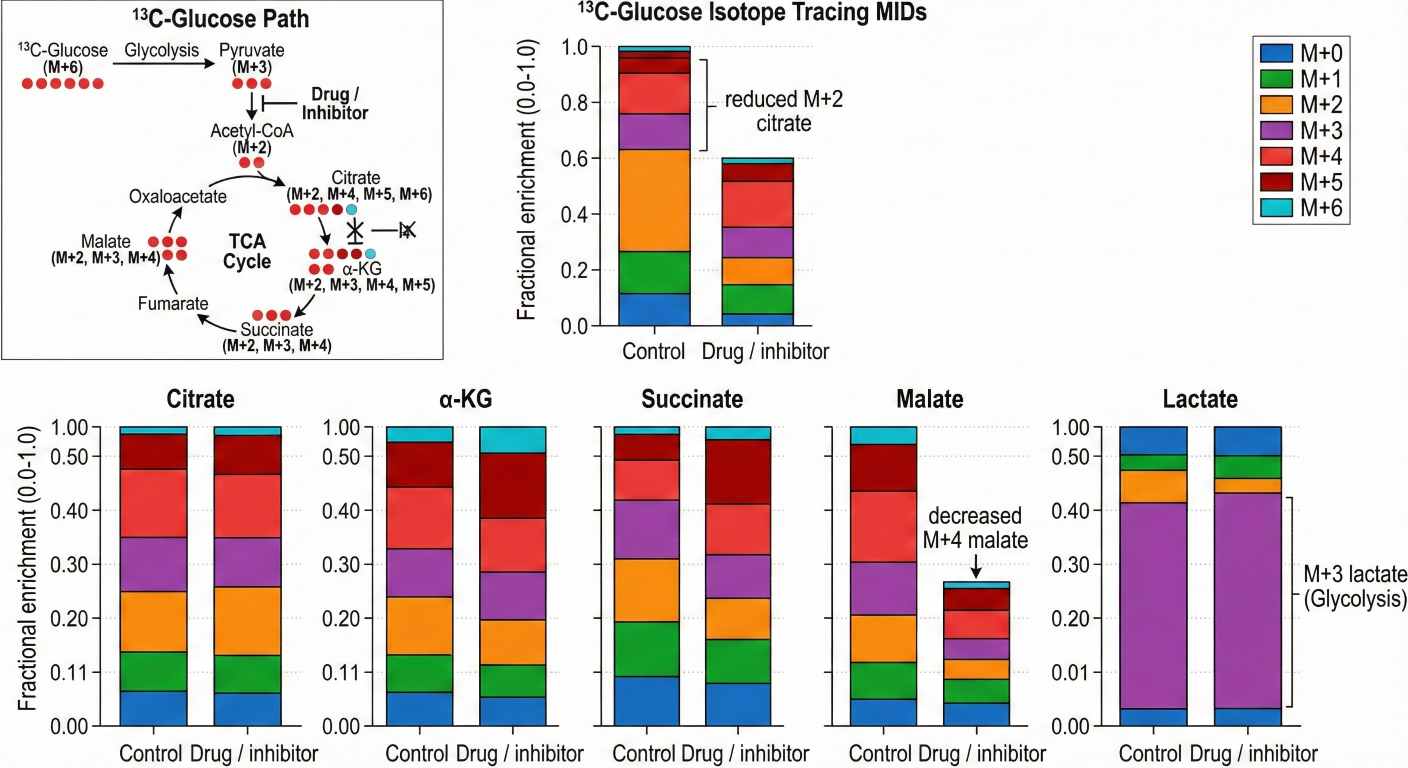
- Optional Metabolic Flux Analysis (MFA): Add ¹³C-glucose or ¹³C-glutamine tracing and quantify mass isotopologue distributions (MID) to support pathway activity interpretation (see Metabolic Flux Analysis Service).
- Tumor Microenvironment (TME) Metabolic Nodes: Quantify key TME-relevant nodes, including nutrient utilization (e.g., glucose/glutamine) and secretion readouts (e.g., lactate/pyruvate). Kynurenine/tryptophan modules are available as optional add-ons.
Analyte Coverage: Core Oncometabolites and Central Carbon Nodes
Our panel covers core cancer-relevant metabolites, with optional pathway and cofactor add-ons depending on study design and extraction requirements.
| Metabolite Class |
Representative Analytes |
Research Relevance |
Availability Notes |
| Oncometabolites |
D-2-HG, L-2-HG |
Mechanism-focused readout for IDH-associated metabolic rewiring |
Core (chiral separation supported) |
| TCA Cycle Intermediates |
Citrate, isocitrate, α-KG, succinate, fumarate, malate, oxaloacetate* |
Central carbon status; SDH/FH-linked accumulation patterns |
Core, some labile targets are method-dependent |
| Glycolysis / Warburg Nodes |
Glucose, G6P, pyruvate, lactate |
Aerobic glycolysis readouts and carbon routing |
Core (matrix-dependent) |
| Anaplerotic Amino Acids |
Glutamine, glutamate, aspartate, serine, glycine |
TCA replenishment and carbon/nitrogen balance |
Core / Optional (panel configuration) |
| Energy & Redox Cofactors |
NAD+, NADH, NADPH, ATP, ADP |
Energy/redox status |
Optional add-on (requires specific extraction protocol) |
*Note: Final target list is confirmed at project setup and reported in the methods appendix.
Why Choose Our Oncometabolites Profiling Service?
- True Chiral Precision: We don't just measure "Total 2-HG." We separate D- and L-forms to confirm IDH mutation status versus general hypoxic response, a distinction critical for high-impact publications.
- Absolute Quantification Standard: We utilize isotope-labeled internal standards (e.g., 13C5-2-HG, 13C4-Succinate) for every class, providing concrete concentration data (e.g., μM or ng/mg) rather than relative peak areas.
- Broad Dynamic Range: Our methods are optimized to quantify metabolites across 4-5 orders of magnitude, accurately measuring both trace intracellular signals and high-abundance media nutrients in a single run.
- Flux-Ready Platform: Our methods are inherently compatible with stable isotope tracers. You can upgrade any study from "static pool size" to "dynamic flux" without changing the core analytical platform.
Project Workflow: Step-by-Step Analysis
Analytical Platforms & Quality Control Standards
We utilize industry-leading instrumentation to ensure data integrity and reproducibility.
Instrumentation:
- Sciex QTRAP 6500+: Selected for its unmatched sensitivity in targeted quantitation (MRM mode), ideal for low-abundance oncometabolites.
- Thermo Orbitrap Exploris 480: Used for high-resolution confirmation and complex flux analysis (mass isotopologue distribution).
Quality Control Specs:
- Linearity: Calibration curves with R2 ≥ 0.99 for all quantified analytes.
- Precision: Technical replicate RSD < 15% for quality control samples.
- Carryover: Strict blank monitoring between samples to prevent cross-contamination.
Sample Types & Submission Requirements
| Sample Type |
Recommended Input |
Preparation & Shipping Notes |
| Cell Pellet / Cell Lysate |
~0.5–2 × 10⁶ cells (typical) |
Remove media quickly; rinse briefly if needed; quench/freeze immediately. Avoid repeated freeze–thaw. For adherent cells, plate-quenching is acceptable if applied consistently. Ship on dry ice (sealed tubes + secondary containment). |
| Tumor Tissue / Biopsy |
~10–30 mg (typical) |
Minimize ischemia time; snap-freeze as quickly as possible. Record tissue weight and handling time. Avoid thawing during aliquoting—prepare multiple frozen pieces if needed. Ship on dry ice (labeled cryovials). |
| Plasma / Serum |
~100–200 µL (typical) |
Separate plasma/serum promptly after collection; avoid hemolysis when possible. Record tube type and processing time. Aliquot to reduce freeze–thaw cycles. Ship on dry ice (leak-proof vials). |
| Culture Media (Spent / Baseline) |
~100–300 µL (typical) |
Collect at defined time points; clarify by brief centrifugation if needed. Provide matching blank media controls when possible (same formulation). Ship on dry ice. |
| Tumor Interstitial Fluid (TIF) / Low-Input Fluids |
As available |
Keep cold during collection; freeze immediately. Note collection method and volume. Low-input feasibility is matrix-dependent—consult prior to shipment. Ship on dry ice. |
Packaging checklist: Dry ice in an insulated container; sample inventory sheet; clearly labeled tubes; secondary containment to prevent leakage.
Deliverables: Publication-Ready Data Package
We provide a comprehensive data package designed for direct inclusion in manuscripts.
Data Report:
- Concentration tables (Excel/CSV).
- Calibration curve parameters and QC performance report.
Representative Data Visualization:
- Chiral 2-HG Chromatogram: Baseline separation of D- and L-2-Hydroxyglutarate.
- Differential Volcano Plot: Identifying significant metabolic shifts in mutant tumors.
- TCA Cycle Heatmap: Visualizing metabolic bottlenecks in the TCA cycle.
- Drug Response Bar Chart: Assessing drug efficacy on oncometabolite levels.
(Need advanced data interpretation? See our Metabolomics Data Analysis services).
Applications in Oncology Research
Macrophage-Associated Lipin-1 Promotes β-Oxidation in Response to Proresolving Stimuli
Schilke, R. M., Blackburn, C. M. R., Rao, S., Krzywanski, D. M., Finck, B. N., & Woolard, M. D.
Journal: ImmunoHorizons
Year: 2020
DOI: https://doi.org/10.4049/immunohorizons.2000047
YAP mediates compensatory cardiac hypertrophy through aerobic glycolysis
Kashihara, T., Mukai, R., Oka, S. I., Zhai, P., Nakada, Y., Yang, Z., ... & Sadoshima, J.
Journal: The Journal of Clinical Investigation
Year: 2022
DOI: https://doi.org/10.1172/JCI150595
A personalized probabilistic approach to ovarian cancer diagnostics based on serum metabolic profiles
Ban, D., Housley, S. N., Matyunina, L. V., McDonald, L. D., Bae-Jump, V. L., Benigno, B. B., ... & McDonald, J. F.
Journal: Gynecologic Oncology
Year: 2024
DOI: https://doi.org/10.1016/j.ygyno.2023.12.030
MS CETSA deep functional proteomics uncovers DNA repair programs leading to gemcitabine resistance
Nordlund, P., Liang, Y. Y., Khalid, K., Van Le, H., Teo, H. M., Raitelaitis, M., ... & Prabhu, N.
Journal: Research Square (Preprint)
Year: 2024
DOI: https://doi.org/10.21203/rs.3.rs-4820265/v1